#TAI/USDT Pump Anticipated#TAI
The price is moving within an ascending channel on the 1-hour timeframe and is adhering to it well. It is poised to break out strongly and retest the channel.
We have a downtrend line on the RSI indicator that is about to break and retest, which supports the upward move.
There is a key support zone in green at 0.02830, representing a strong support point.
We have a trend of consolidation above the 100-period moving average.
Entry price: 0.02965
First target: 0.03050
Second target: 0.03170
Third target: 0.03300
Don't forget a simple money management rule:
Place your stop-loss order below the green support zone.
Once you reach the first target, save some money and then change your stop-loss order to an entry order.
For any questions, please leave a comment.
Thank you.
Taiwan

#TAI/USDT Eyeing Re-accumulation Within Ascending Channel !#TAI
The price is moving within an ascending channel on the 1-hour timeframe and is adhering to it well. It is poised to break out strongly and retest the channel.
We have a downtrend line on the RSI indicator that is about to break and retest, which supports the upward move.
There is a key support zone in green at the 0.04000 price level, representing a strong support point.
We have a trend of consolidation above the 100-period moving average.
Entry price: 0.04040
First target: 0.04146
Second target: 0.04260
Third target: 0.04393
Don't forget a simple point: capital management.
Upon reaching the first target, save some money and then change your stop-loss order to an entry order.
For any questions, please leave a comment.
Thank you.

#TAI/USDT Pump Anticipated
#TAI
The price is moving in a descending channel on the 1-hour frame and is expected to break and continue upward.
We have a trend to stabilize above the 100 moving average once again.
We have a downtrend on the RSI indicator that supports the upward move with a breakout.
We have a major support area in green that pushed the price higher at 0.04324.
Entry price: 0.04500.
First target: 0.04766.
Second target: 0.05059.
Third target: 0.05387.
To manage risk, don't forget stop loss and capital management.
When you reach the first target, save some profits and then change the stop order to an entry order.
For inquiries, please comment.
Thank you.

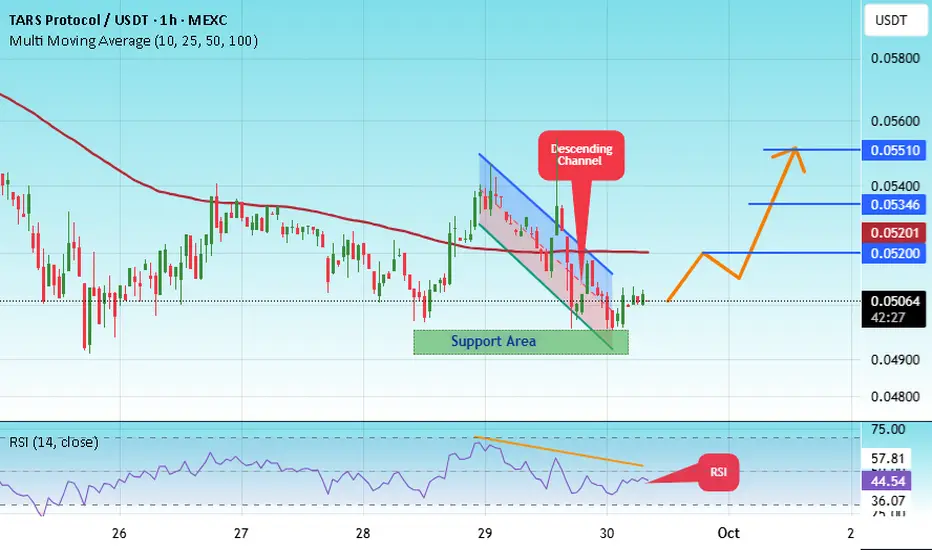
#TAI/USDT Eyeing Re-accumulation Within Ascending Channel !#TAI
The price is moving within a descending channel on the 1-hour frame, adhering well to it, and is heading for a strong breakout and retest.
We have a bearish trend on the RSI indicator that is about to be broken and retested, which supports the upward breakout.
There is a major support area in green at 0.04962, which represents a strong support point.
We are heading for consolidation above the 100 moving average.
Entry price: 0.05065
First target: 0.05200
Second target: 0.05346
Third target: 0.05510
Don't forget a simple matter: capital management.
When you reach the first target, save some money and then change your stop-loss order to an entry order.
For inquiries, please leave a comment.
Thank you.
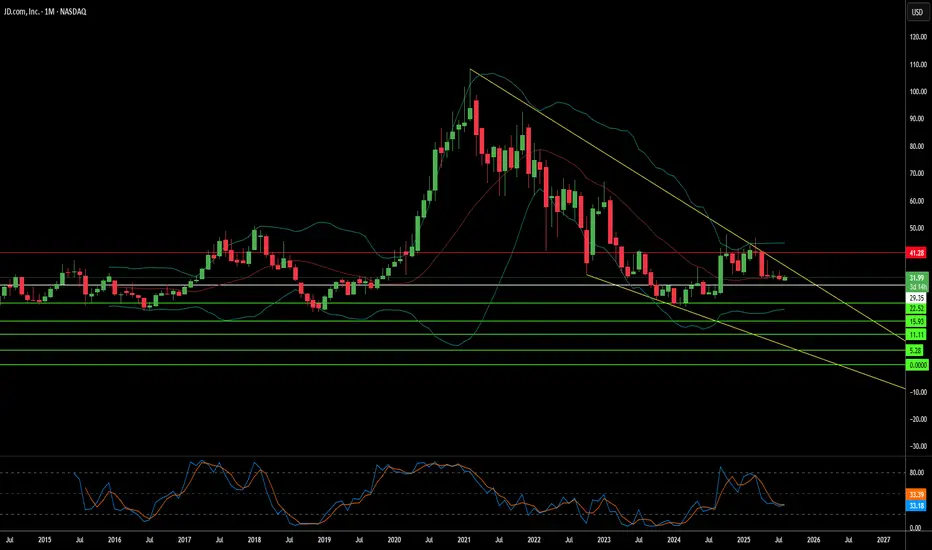
Can Strong Fundamentals Survive Geopolitical Storms?JD.com presents a compelling paradox in modern investing: a company demonstrating robust operational performance while its stock remains volatile due to factors entirely beyond its control. Despite market speculation about decline, JD.com has shown impressive financial resilience with consistent revenue growth—15.8% in Q1 2025 and 22.4% in Q2 2025 - alongside improving operating margins that reached 4.5% for JD Retail in Q2 2025. The company has strategically invested over RMB 75 billion in R&D since 2017, building a sophisticated logistics network spanning over 3,600 warehouses and developing cutting-edge technologies that have reduced fulfillment costs to a world-leading 6.5%.
However, JD.com's strong fundamentals exist within a challenging ecosystem of domestic and international pressures. China's deflationary environment, with CPI rising only 0.2% in 2024, has created subdued consumer demand, while intensifying competition from disruptors like Pinduoduo has reshaped the e-commerce landscape. Rather than engaging in destructive price wars, JD.com has pivoted toward sustainable profitability, leveraging its premium brand reputation and proprietary logistics network as key differentiators in an increasingly crowded market.
The most significant risk facing JD.com - and all US-listed Chinese companies- is geopolitical uncertainty rather than operational weakness. US-China trade tensions, regulatory crackdowns in both countries, and the specter of potential Taiwan conflict scenarios create unprecedented risks for investors. A hypothetical Taiwan invasion could trigger catastrophic sanctions, including SWIFT banking exclusions and forced delistings, potentially rendering these stocks worthless regardless of their underlying business strength. This analysis reveals that Bloomberg Economics estimates such a conflict would cost the global economy $10 trillion, with Chinese companies facing existential threats to their international operations.
The JD.com case study ultimately illustrates a new reality in global investing: traditional financial analysis focusing on revenue growth and operational efficiency may be insufficient when evaluating companies operating across geopolitical fault lines. While JD.com remains operationally strong with clear competitive advantages, investors must recognize they are essentially placing bets on US-China diplomatic stability rather than just corporate performance. This political risk premium fundamentally changes the investment equation.
#TAI/USDT Eyeing Re-accumulation Within Ascending Channel !#TAI
The price is moving within an ascending channel on the 1-hour frame, adhering well to it, and is poised to break it strongly upwards and retest it.
We have support from the lower boundary of the ascending channel, at 0.05860.
We have a downtrend on the RSI indicator that is about to break and retest, supporting the upside.
There is a key support area (in green) at 0.05850, which represents a strong basis for the upside.
Don't forget one simple thing: ease and capital.
When you reach the first target, save some money and then change your stop-loss order to an entry order.
For inquiries, please leave a comment.
We have a trend of stability above the Moving Average 100.
Entry price: 0.05950
First target: 0.06162
Second target: 0.06400
Third target: 0.06660
Don't forget one simple thing: ease and capital.
When you reach the first target, save some money and then change your stop-loss order to an entry order.
For inquiries, please leave a comment.
Thank you.

#TAI/USDT#TAI
The price is moving within an ascending channel on the 1-hour frame, adhering well to it, and is poised to break it strongly upwards and retest it.
We have support from the lower boundary of the ascending channel, at 0.06600.
We have a downtrend on the RSI indicator that is about to break and retest, supporting the upward move.
There is a key support area (in green) at 0.06450, which represents a strong basis for the upward move.
Don't forget one simple thing: ease and capital.
When you reach the first target, save some money and then change your stop-loss order to an entry order.
For inquiries, please leave a comment.
We have a trend of stability above the Moving Average 100.
Entry price: 0.06700
First target: 0.06786
Second target: 0.07120
Third target: 0.07507
Don't forget one simple thing: ease and capital.
When you reach the first target, save some money and then change your stop-loss order to an entry order.
For inquiries, please leave a comment.
Thank you.

#TAI/USDT :- TARS AI Long#TAI
The price is moving within a descending channel on the 1-hour frame and is expected to break and continue upward.
We have a trend to stabilize above the 100 moving average once again.
We have a downtrend on the RSI indicator that supports the upward break.
We have a support area at the lower boundary of the channel at 0.8050, acting as strong support from which the price can rebound.
We have a major support area in green that pushed the price upward at 0.07200.
Entry price: 0.08566
First target: 0.08976
Second target: 0.09417
Third target: 0.10031
To manage risk, don't forget stop loss and capital management.
When you reach the first target, save some profits and then change your stop order to an entry order.
For inquiries, please comment.
Thank you.

#TAI/USDT#TAI
The price is moving within a descending channel on the 1-hour frame, adhering well to it, and is heading for a strong breakout and retest.
We are experiencing a rebound from the lower boundary of the descending channel. This support is at 0.090600.
We are experiencing a downtrend on the RSI indicator, which is about to break and retest, supporting the upward trend.
We are heading for stability above the 100 Moving Average.
Entry price: 0.09355
First target: 0.09900
Second target: 0.10380
Third target: 0.11000

Bitcoin Controlled consolidation above 106,480 Technical Overview – Summary Points
➤ BTC trades in the 1st quartile of its yearly range (100k – 111k).
➤ Stacked resistance zone: 108,239 to 110,603 USDT → potential seller exhaustion.
➤ Key support at 106,480; defensive cluster 102,626–99,581.
➤ Risk On / Risk Off Indicator = Strong Buy; ISPD Divergence = Neutral.
➤ Normal volume, but lack of fresh capital → sustainability of rally questionable.
__________________________________________________________________________________
Strategic Summary
➤ HTF trend bullish above 106,480; breakout > 108,239 targets 109,950 / 110,600.
➤ Buy swing pullbacks on 106,480 or 104,600. Invalidation < 102,626 = drop to 99k.
➤ Tactical short scalps around 108,250–109,000.
➤ Core PCE = major catalyst (June 27).
➤ Watch spot volumes, funding, and Risk On / Risk Off signals.
__________________________________________________________________________________
Multi-Timeframe Analysis
➤ 1D : bullish bias > 106,480; danger < 102,626.
➤ 12H : bullish consolidation; confirmed breakout > 108,239.
➤ 6H : compression; buy dips 106,480 / 104,600.
➤ 4H : lateral-bullish; key support = 104,600.
➤ 2H : neutral-bullish; triggers = 107,800 / 106,000.
➤ 1H : bull flag; micro-divergence, prefer long > 106,950.
➤ 30 min : tight triangle; breakout at 107,200 / 106,650 = signal.
➤ 15 min : bearish < 106,950, expected bounce on 106,480.
__________________________________________________________________________________
Macro, News & On-Chain Analysis
➤ Macro backdrop: “Higher for longer” stance continues, no FOMC imminent.
➤ Core PCE June 27: upside surprise (2.7% YoY vs 2.6% expected) – USD supported, potential headwind for risk assets.
➤ Pacific Region: ongoing tensions in Taiwan Strait and South China Sea:
- Increased military activity: air incursions, naval maneuvers.
- High risk of escalation flagged by defense analysts & social feeds.
- Risk sentiment: volatile – sudden events could trigger risk-off.
➤ On-chain: Range 100–110k; weak spot volume; cautious leverage; no major sell-side imbalance.
__________________________________________________________________________________
Conclusion
➤ BTC maintains a controlled bullish bias > 106,480.
➤ Swing buy zones = 106,480 & 104,600; targets 109,950 / 110,600.
➤ Main risk: break < 102,626 = sell-off toward 99k.
➤ Monitor Core PCE and geopolitical risk in the Pacific region.
__________________________________________________________________________________

Is this an Asian currency crisis in reverse? The Taiwan Dollar surged more than 5% against the U.S. dollar on Monday, briefly pushing USD/TWD below the 29.00 mark.
The two-day rally—totaling nearly 10%—is the sharpest in over three decades. But Taiwan isn’t alone. A broader wave of U.S. dollar selling has lifted several Asian currencies, including the Singapore Dollar, South Korean Won, Malaysian Ringgit, Chinese Yuan, and Hong Kong Dollar.
Goldman Sachs reported on Tuesday that investor positioning has shifted significantly, with clients moving from short yuan positions to long ones—suggesting a growing expectation of continued U.S. dollar weakness.

Taiwan Dollar Weakens Past 30 per USD Amid Trade Rumors and CentThe Taiwanese dollar weakened past 30 per USD on Tuesday, reversing a two-day rally and retreating from its strongest level in nearly three years.
📉 Recent gains in Asian currencies like the TWD and MYR were fueled by speculation over regional support for U.S. trade talks. However, Taiwan’s central bank denied any such coordination, stating the U.S. made no formal request. President Lai Ching-te also warned against spreading misinformation.
🔧 As a key player in global chip production, Taiwan remains highly exposed to shifts in trade dynamics and geopolitical risks.

ES FUTURES LEVELS TO WATCH AND QUICK LOOKLevels to watch on ES futures Quick Look. keep a eye out for more action on these areas

America's 500 correct Trump inauguration and second termDonald Trump's inauguration for his second term will shake the market to adapt to his fringe trade policies. The upcoming Trump Administration already announced to impose tariffs which will advance the cause for more domestic production, but as the general cost of goods will rise, so will inflation. The first correction of the market will set S&P500 below its 200-day average. As it is unclear which role the most influential billionaire of the world, Elon Musk, will have on government policies, the market will at least frown on this uncertainty, if not react to his announcements, that "it needs to get worse before it gets better" with overall sellout.
Meanwhile, major trading counterparts in the world, namely Mexico and the EU prepared for a second term of the loathed-by-leaders protectionist. China, currently in unsettling nationwide economy cooldown, braces for upcoming conflicts with the sole remaining 20th century super-power, as the inevitable Battle for Taiwan would be the longed-for distraction and a cause to get the increasingly incredulous chinese people behind the ever-scrutinized leader Xi Jinping. The conflict will further impact the High Tech industry of the west, as despite measures to recess from dependencies with the powerful Chinese economy, certain resources and products are not yet available anywhere else. Leading analysts don't see a conflict with China happening for another 2 years, opening the chance for China's economy to recover and further depress the urge of its leading powers to find a unifying cause.

(TSM) Taiwan Semiconductor Set for a Bullish Surge!Technical Analysis: Taiwan Semiconductor (TSM) – 15-Minute Timeframe (Long Trade)
We entered a long trade on Taiwan Semiconductor (TSM) at 204.25 after a clear bullish signal. The trade is currently in progress, and we are waiting for the profit targets to be hit.
Key Levels
Entry: 204.25 – The long position was initiated here following a strong upward signal.
Stop-Loss (SL): 195.45 – Positioned below support to manage risk and protect against downside movement.
Take Profit 1 (TP1): 215.12 – The first target we are eyeing as the bullish momentum unfolds.
Take Profit 2 (TP2): 232.71 – A further upside target, marking a significant rally if the momentum continues.
Take Profit 3 (TP3): 250.30 – A potential target if the bullish trend remains strong.
Take Profit 4 (TP4): 261.17 – The ultimate target, signaling a substantial upside move.
Trend Analysis
The price is well above the Risological Dotted trendline, indicating strong bullish momentum. The upward movement is supported by a solid breakout, and we are now watching for the targets to be met.
The long trade on TSM looks promising, with a clear entry at 204.25. We are now monitoring the price as it approaches the first target at 215.12, expecting further upside momentum.

(FX) function x "ultra music festival"function X is involved with Ultra music festival by supporting Ultra on chain. There is an up coming Ultra Music in ROC and Hong Kong for the first time this year. Mid September for the Hong Kong experience and November for Republic of China (ROC) ultra music festival. Visit ultra music festival page for details. To see the connection visit Function X and go to their ecosystem and select lifestyle tab to see the connection to Ultra.

TSM Taiwan Semiconductor Options Ahead of EarningsIf you haven`t bought TSM before it skyrocketed:
Now analyzing the options chain and the chart patterns of TSM Taiwan Semiconductor prior to the earnings report this week,
I would consider purchasing the 190usd strike price Calls with
an expiration date of 2024-9-20,
for a premium of approximately $12.70.
If these options prove to be profitable prior to the earnings release, I would sell at least half of them.

TSM Taiwan Semiconductor Options Ahead of EarningsIf you haven`t sold TSM here:
Then analyzing the options chain and the chart patterns of TSM Taiwan Semiconductor prior to the earnings report this week,
I would consider purchasing the 100usd strike price at the money Calls with
an expiration date of 2024-9-20,
for a premium of approximately $11.45.
If these options prove to be profitable prior to the earnings release, I would sell at least half of them.

Trade Like A Sniper - Episode 48 - HKDTWD - (18th June 2024)This video is part of a video series where I backtest a specific asset using the TradingView Replay function, and perform a top-down analysis using ICT's Concepts in order to frame ONE high-probability setup. I choose a random point of time to replay, and begin to work my way down the timeframes. Trading like a sniper is not about entries with no drawdown. It is about careful planning, discipline, and taking your shot at the right time in the best of conditions.
A couple of things to note:
- I cannot see news events.
- I cannot change timeframes without affecting my bias due to higher-timeframe candles revealing its entire range.
- I cannot go to a very low timeframe due to the limit in amount of replayed candlesticks
In this session I will be analyzing HKDTWD, starting from the 3-Month chart.
If you want to learn more, check out my profile.

Trade Like A Sniper - Episode 47 - USDTWD - (18th June 2024)This video is part of a video series where I backtest a specific asset using the TradingView Replay function, and perform a top-down analysis using ICT's Concepts in order to frame ONE high-probability setup. I choose a random point of time to replay, and begin to work my way down the timeframes. Trading like a sniper is not about entries with no drawdown. It is about careful planning, discipline, and taking your shot at the right time in the best of conditions.
A couple of things to note:
- I cannot see news events.
- I cannot change timeframes without affecting my bias due to higher-timeframe candles revealing its entire range.
- I cannot go to a very low timeframe due to the limit in amount of replayed candlesticks
In this session I will be analyzing USDTWD, starting from the 4-Month chart.
If you want to learn more, check out my profile.

TSM: After Downgrading The Outlook, What To Expect?
Trend
- On the weekly chart: Clearly showing an uptrend.
- The uptrend channel has extended 100% and is expected to return to the middle line at least, with a chance of reaching the lower band of the original channel.
100% Symmetrical Projection: Uptrend “N” Patterns
- A 100% Symmetrical Projection of the initial swing (from A to B) and then projected from C. As a result, D was our initial target price.
- Without a symmetrical retracement from D to E, there's a resistance-turn-support at level D, and the price continued to rise. The target price was adjusted another 100% higher to D' due to the very strong momentum.
- However, the price failed to reach D' and fell below level D at $135, indicating that the momentum has dissipated. Additionally, on the daily chart, there's a support-turn-resistance to reinforce the level's importance.
- What's next?
The price may retrace 100% of the "extra force" of the blue box; or
The price is likely to fulfill the original symmetrical retracement from D to E.
N Pattern’s Target Price & Fibonacci Price Cluster
- The 0.5 Fibonacci Retracement of the entire swing from A to HH perfectly aligns with level E, which can be seen as one of the current target prices on the short side.
- The 0.618 Fibonacci Retracement of the more recent swing from C to HH is close to the low of the returning blue box.
- Both levels and the previous key resistance level at B form a tight zone, likely to be a significant support area (the gray area).
Conclusion
- After breaking below the key level at $135, TSM is expected to retrace to the tight range between $109 and $112.7.
- In other words, if you’re considering to buy more and invest in TSM, this tight support area presents an opportune entry point.
Not Financial Advice
The information contained in this article is not intended as, and should not be understood as financial advice. You should take independent financial advice from a professional who is aware of the facts and circumstances of your individual situation.

#TAI/USDT#TAI
The price is moving in a descending triangle on the 12-hour frame
We have a green support area at 0.03650
Now we have a nice breakout coming up
Our RSI indicator has a trend that is about to break to the upside
Entry price is 0.04054
The first target is 0.04436
The second target is 0.04850
The third goal is 0.05333

NVIDIA - The top; lets the great Short beginHappy 2024 dragon year! This is the year of China, when they will most certainly reclaim their world stage position- aka take Taiwan back. I predict that when military action will begin NVIDIA stocks will fall.
