Master Correlation StrategiesUnlocking the Power of Inter-Market Relationships in Trading.
1. Understanding Correlation in Trading
Correlation refers to the statistical relationship between two or more financial instruments — how their prices move relative to each other. It is expressed through a correlation coefficient ranging from -1 to +1.
Positive Correlation (+1): When two assets move in the same direction. For example, crude oil and energy sector stocks often rise and fall together.
Negative Correlation (-1): When two assets move in opposite directions. For instance, the U.S. dollar and gold often have an inverse relationship — when one rises, the other tends to fall.
Zero Correlation (0): Indicates no consistent relationship between two assets.
Understanding these relationships helps traders predict how one market might respond based on the movement of another, enhancing decision-making and portfolio design.
2. Why Correlation Matters
In modern financial markets, where globalization links commodities, equities, currencies, and bonds, no asset class operates in isolation. Correlation strategies allow traders to see the “bigger picture” — understanding how shifts in one area of the market ripple across others.
Some key reasons why correlation is vital include:
Risk Management: Diversification is only effective when assets are uncorrelated. If all your holdings move together, your portfolio is not truly diversified.
Predictive Analysis: Monitoring correlated assets helps anticipate price moves. For example, a rally in crude oil might foreshadow gains in oil-dependent currencies like the Canadian Dollar (CAD).
Hedging Opportunities: Traders can offset risks by holding negatively correlated assets. For instance, pairing long stock positions with short positions in an inverse ETF.
Market Confirmation: Correlations can validate or contradict signals. If gold rises while the dollar weakens, the move is more credible than when both rise together, which is rare.
3. Core Types of Correlations in Markets
a. Intermarket Correlation
This examines how different asset classes relate — such as the link between commodities, bonds, currencies, and equities. For example:
Rising interest rates typically strengthen the domestic currency but pressure stock prices.
Falling bond yields often boost equity markets.
b. Intra-market Correlation
This focuses on assets within the same category. For example:
Technology sector stocks often move together based on broader industry trends.
Gold and silver tend to share similar price patterns.
c. Cross-Asset Correlation
This involves analyzing relationships between assets of different types, such as:
Gold vs. U.S. Dollar
Crude Oil vs. Inflation Expectations
Bitcoin vs. NASDAQ Index
d. Temporal Correlation
Certain correlations shift over time. For instance, the correlation between equities and bonds may be positive during economic growth and negative during recessions.
4. Tools and Techniques to Measure Correlation
Correlation is not merely an observation—it’s a quantifiable concept. Several statistical tools help traders measure and monitor it accurately.
a. Pearson Correlation Coefficient
This is the most widely used formula to calculate linear correlation between two data sets. A reading close to +1 or -1 shows a strong relationship, while values near 0 indicate weak correlation.
b. Rolling Correlation
Markets evolve constantly, so rolling correlation (using moving windows) helps identify how relationships shift over time. For example, a 30-day rolling correlation between gold and the USD can show whether their inverse relationship is strengthening or weakening.
c. Correlation Matrices
These are tables showing the correlation coefficients between multiple assets at once. Portfolio managers use them to construct diversified portfolios and reduce overlapping exposures.
d. Software Tools
Platforms like Bloomberg Terminal, TradingView, MetaTrader, and Python-based tools (like pandas and NumPy libraries) allow traders to calculate and visualize correlation efficiently.
5. Applying Correlation Strategies in Trading
a. Pair Trading
Pair trading is a market-neutral strategy that exploits temporary deviations between two historically correlated assets.
Example:
If Coca-Cola and Pepsi usually move together, but Pepsi lags temporarily, traders may go long Pepsi and short Coca-Cola, betting the relationship will revert.
b. Hedging with Negative Correlations
Traders can use negatively correlated instruments to offset risk. For instance:
Long positions in the stock market can be hedged by taking positions in safe-haven assets like gold or the Japanese Yen.
c. Sector Rotation and ETF Strategies
Investors track sector correlations with broader indices to identify leading and lagging sectors.
For example:
If financial stocks start outperforming the S&P 500, this could signal a shift in the economic cycle.
d. Currency and Commodity Correlations
Currencies are deeply linked to commodities:
The Canadian Dollar (CAD) often correlates positively with crude oil prices.
The Australian Dollar (AUD) correlates with gold and iron ore prices.
The Swiss Franc (CHF) is often inversely correlated with global risk sentiment, acting as a safe haven.
Traders can exploit these relationships for cross-market opportunities.
6. Case Studies of Correlation in Action
a. Gold and the U.S. Dollar
Gold is priced in dollars; therefore, when the USD strengthens, gold usually weakens as it becomes more expensive for other currency holders.
During 2020’s pandemic uncertainty, both assets briefly rose together — a rare situation showing correlation can shift temporarily under stress.
b. Oil Prices and Inflation
Oil serves as a barometer for inflation expectations. When crude prices rise, inflation fears grow, prompting central banks to tighten policies.
Traders who monitor this relationship can anticipate policy shifts and market reactions.
c. Bitcoin and Tech Stocks
In recent years, Bitcoin has shown increasing correlation with high-growth technology stocks. This suggests that cryptocurrency markets are influenced by risk sentiment similar to the equity market.
7. Benefits of Mastering Correlation Strategies
Enhanced Market Insight: Understanding inter-market dynamics reveals the underlying forces driving price movements.
Stronger Portfolio Construction: Diversify effectively by choosing assets that truly offset one another.
Smarter Risk Control: Correlation analysis highlights hidden exposures across asset classes.
Improved Trade Timing: Correlation signals help confirm or challenge technical and fundamental setups.
Global Perspective: By studying correlations, traders gain insight into how global events ripple through interconnected markets.
8. Challenges and Limitations
Despite its power, correlation analysis is not foolproof. Traders must be aware of its limitations:
Changing Relationships: Correlations evolve over time due to policy changes, crises, or shifting investor sentiment.
False Correlation: Sometimes two assets appear correlated by coincidence without a fundamental link.
Lag Effect: Correlation may not capture time delays between cause and effect across markets.
Overreliance: Correlation is one tool among many; combining it with technical, fundamental, and sentiment analysis produces more reliable outcomes.
9. Advanced Correlation Techniques
a. Cointegration
While correlation measures relationships at a moment in time, cointegration identifies long-term equilibrium relationships between two non-stationary price series.
For example, even if short-term correlation fluctuates, two assets can remain cointegrated over the long run — useful in statistical arbitrage.
b. Partial Correlation
This method isolates the relationship between two variables while controlling for others. It’s particularly helpful in complex portfolios involving multiple correlated instruments.
c. Dynamic Conditional Correlation (DCC) Models
These advanced econometric models (used in quantitative finance) measure time-varying correlations — essential for modern algorithmic trading systems.
10. Building a Correlation-Based Trading System
A professional correlation strategy can be structured as follows:
Data Collection: Gather historical price data for multiple assets.
Statistical Analysis: Calculate correlations and rolling relationships using software tools.
Strategy Design: Develop pair trades, hedges, or intermarket signals based on correlation thresholds.
Backtesting: Validate the system across different market phases to ensure robustness.
Execution and Monitoring: Continuously update correlation data and adjust positions as relationships evolve.
Risk Control: Implement stop-loss rules and diversification limits to prevent overexposure to correlated positions.
11. The Future of Correlation Strategies
In an era of high-frequency trading, AI-driven analytics, and global macro interconnectedness, correlation strategies are evolving rapidly. Machine learning models now identify non-linear and hidden correlations that traditional statistics might miss.
Furthermore, as markets integrate further — with crypto, ESG assets, and alternative data sources entering the scene — understanding these new correlations will be crucial for maintaining an edge in trading.
12. Final Thoughts
Mastering correlation strategies isn’t just about mathematics — it’s about understanding the language of global markets. Every movement in commodities, currencies, and indices tells a story about how capital flows across the world.
A trader who comprehends these relationships gains not only analytical power but also strategic foresight. By mastering correlation analysis, you move beyond isolated price charts and see the interconnected web that drives the global financial ecosystem.
In essence, correlation strategies are the bridge between micro-level technical trades and macro-level economic understanding. Those who can navigate this bridge with confidence stand at the forefront of modern trading excellence — armed with knowledge, precision, and an unshakable sense of market direction.
Tarde
Global Energy and Geopolitical Trade Routes1. Introduction
Energy has always been a critical driver of human civilization, influencing economic growth, technological progress, and geopolitical power. From coal in the Industrial Revolution to oil and natural gas in the modern era, energy resources are both strategic assets and commodities. The flow of energy across borders—through pipelines, shipping lanes, and electricity grids—forms a complex network of trade routes that shapes global geopolitics. Understanding these trade routes is essential for comprehending the interplay between energy security, international relations, and economic stability.
Global energy trade is not just about moving fuel from one country to another; it is about ensuring reliability, affordability, and access in a world of shifting political alliances, regional conflicts, and environmental concerns. The strategic positioning of energy resources often determines the balance of power in international politics, making trade routes both economic lifelines and potential flashpoints for conflict.
2. Evolution of Energy Trade
2.1 Early Energy Trade
Historically, energy trade was local. Coal, wood, and water-powered mills dominated economies. With the discovery of oil in the 19th century, energy trade expanded internationally. Oil pipelines and shipping routes allowed nations to access distant reserves. Countries like the United States, Russia, and the Middle East became key players due to their rich resources.
2.2 The Oil Era and Strategic Importance
The 20th century saw oil emerge as the world’s dominant energy source. The U.S., Middle Eastern nations, and later Russia became central to the global energy landscape. Key shipping routes like the Strait of Hormuz, the Suez Canal, and the Panama Canal gained strategic importance as chokepoints controlling the flow of petroleum. Control over these routes often translated into geopolitical leverage.
2.3 Natural Gas and Modern Diversification
The late 20th and early 21st centuries brought diversification, with natural gas, coal, and renewable energy playing significant roles. LNG (liquefied natural gas) trade added a new dimension to energy geopolitics, allowing countries without pipeline access to participate in global markets. The development of liquefaction and regasification terminals enabled nations to bypass traditional transit routes, reducing dependency on politically unstable regions.
3. Types of Energy in Global Trade
3.1 Crude Oil
Crude oil remains the cornerstone of energy trade. It is used in transportation, manufacturing, and as feedstock for petrochemicals. Oil trade is highly concentrated; the Middle East holds roughly a third of global proven reserves, and the Organization of the Petroleum Exporting Countries (OPEC) plays a major role in controlling supply and prices.
Key characteristics:
Transported via tankers and pipelines.
Highly sensitive to geopolitical events.
Prices influenced by supply disruptions, conflicts, and sanctions.
3.2 Natural Gas
Natural gas is increasingly important due to its lower carbon footprint compared to coal. It is traded through pipelines (e.g., Russia–Europe networks) and as LNG. Global gas trade is shaped by regional alliances, energy contracts, and infrastructure availability.
Key characteristics:
Regionalized market, unlike oil’s global market.
Dependent on pipeline diplomacy.
LNG offers flexibility but requires expensive infrastructure.
3.3 Coal
Coal trade has declined in advanced economies but remains vital for emerging economies like India and China. It is largely transported via shipping and rail networks. Political stability in supplier countries like Australia and Indonesia significantly affects global coal markets.
3.4 Renewables and Electricity
While renewable energy does not traditionally require trade routes like fossil fuels, cross-border electricity trade (via grids) and critical materials for solar panels, wind turbines, and batteries are increasingly relevant. Materials like lithium, cobalt, and rare earth elements follow trade routes essential for renewable infrastructure.
4. Major Global Energy Trade Routes
Energy trade relies on a combination of maritime chokepoints, pipelines, and rail/road networks. Each route has strategic, economic, and geopolitical significance.
4.1 Maritime Routes
Maritime routes dominate global energy trade due to the volume of crude oil and LNG transported by tankers.
Strait of Hormuz: Located between Oman and Iran, it is the most critical chokepoint for oil transport. Approximately 20–25% of global oil passes through this strait daily. Any disruption, due to geopolitical tensions, can sharply increase global oil prices.
Suez Canal: Connecting the Mediterranean and Red Sea, this canal is vital for oil, LNG, and other commodities between Europe and Asia. Blockages, like the 2021 Ever Given incident, highlight the canal’s economic vulnerability.
Bab el-Mandeb Strait: Linking the Red Sea to the Gulf of Aden, this route is crucial for Middle Eastern oil shipments to Europe and North America. Piracy and regional conflicts pose threats.
Malacca Strait: Connecting the Indian Ocean with the South China Sea, this strait is critical for oil supplies to East Asia, especially China, Japan, and South Korea.
Panama Canal: Facilitates oil and LNG transport between the Atlantic and Pacific Oceans. While smaller in volume compared to the Middle East, its strategic importance is increasing for the Americas.
4.2 Pipelines
Pipelines are the backbone of natural gas and oil transport on land. They reduce dependence on maritime routes but are vulnerable to political conflicts.
Druzhba Pipeline: Russia to Europe, transporting crude oil to central and eastern Europe.
Nord Stream 1 & 2: Russia to Germany, key to European natural gas security.
Trans-Anatolian Pipeline (TANAP): Part of the Southern Gas Corridor, linking Azerbaijan to Europe.
Keystone Pipeline: Canada to the U.S., transporting crude oil.
EastMed Pipeline (planned): Will link Eastern Mediterranean gas reserves to Europe.
4.3 Rail and Road Networks
While less significant than pipelines or shipping for bulk trade, rail and road are essential for regional energy supply, particularly for coal and refined products in Asia and Europe.
5. Geopolitical Dynamics of Energy Trade
Energy trade routes are highly sensitive to geopolitical shifts. Control over resources and transit routes confers power, while dependency on foreign energy exposes vulnerabilities.
5.1 Middle East Influence
The Middle East controls a significant portion of global oil reserves, giving it leverage over oil prices. Conflicts, sanctions, and OPEC decisions have historically influenced global energy markets. Countries reliant on imported oil, like Japan or Europe, must navigate complex relationships with suppliers.
5.2 Russian Energy Leverage
Russia’s natural gas exports to Europe create strategic dependencies. Pipeline politics, especially through Ukraine and Belarus, influence European energy security. Energy diplomacy becomes a tool for exerting influence or negotiating sanctions relief.
5.3 U.S. Energy Policy
The U.S., a major oil and LNG producer, uses energy exports to strengthen geopolitical ties. Sanctions on Iran or Venezuela, or policies promoting shale oil, affect global energy flows.
5.4 Asia’s Growing Demand
China, India, and other Asian economies are increasingly shaping energy trade. The dependence on Middle Eastern oil and Southeast Asian LNG creates vulnerabilities and strategic interests in maritime security.
5.5 Geopolitical Risks and Chokepoints
Maritime chokepoints are vulnerable to blockades, piracy, or military confrontation. Countries dependent on these routes invest in naval capabilities and strategic partnerships to ensure uninterrupted energy flow.
6. Economic Impacts of Energy Trade Routes
The economic significance of energy trade routes extends beyond the direct cost of fuel. It affects global markets, inflation, and development.
Price Volatility: Disruptions in key routes can spike oil and gas prices, impacting transportation, manufacturing, and electricity costs globally.
Supply Security: Nations with diversified supply routes mitigate economic risks.
Investment in Infrastructure: Ports, pipelines, and LNG terminals require massive investment, influencing economic priorities.
Global Trade Patterns: Energy availability influences industrial location, trade balances, and regional development.
7. Environmental and Security Considerations
Energy trade routes are increasingly scrutinized for environmental and security concerns.
Oil Spills: Shipping routes like the Strait of Malacca and Suez Canal are at risk of spills affecting biodiversity.
Pipeline Sabotage: Political instability or terrorism can target pipelines, affecting supply security.
Climate Policies: Transition to renewables could alter trade routes and reduce dependency on fossil fuels, while critical minerals gain importance.
8. Future Trends in Global Energy Trade
8.1 Diversification and Redundancy
Countries are investing in alternative routes and suppliers to reduce dependency. LNG terminals, new pipelines, and renewable energy infrastructure increase resilience.
8.2 Renewable Energy and Critical Minerals
Trade in lithium, cobalt, and rare earths is becoming geopolitically significant. Battery production and renewable energy expansion will create new “energy trade routes” based on materials rather than fuel.
8.3 Digitalization and Smart Grids
Electricity trade across borders via smart grids could redefine energy flows. Countries may trade excess renewable energy in real time, reducing dependency on fossil fuels and traditional routes.
8.4 Geopolitical Realignment
Shifting alliances, energy sanctions, and regional conflicts will continue to shape trade. Asia’s growing energy demand, U.S. export policies, and Middle Eastern strategies will remain central to global energy geopolitics.
9. Case Studies
9.1 Russia-Ukraine Energy Conflict
The Russia-Ukraine conflict demonstrated how pipeline control and sanctions influence European energy security. Gas supply disruptions forced Europe to diversify LNG imports, highlighting vulnerability to geopolitical risk.
9.2 Strait of Hormuz Tensions
Repeated tensions in the Strait of Hormuz illustrate how a narrow chokepoint can impact global oil prices. Any military confrontation in this region could disrupt a significant portion of global oil trade.
9.3 U.S. LNG Exports to Europe
The U.S. rapidly expanded LNG exports to Europe after 2022, mitigating Russian energy leverage and reshaping global LNG trade dynamics.
10. Conclusion
Global energy and geopolitical trade routes are more than logistical pathways; they are instruments of power, security, and economic influence. The strategic positioning of oil, gas, coal, and renewable energy resources shapes alliances, conflicts, and global markets. Maritime chokepoints, pipelines, and infrastructure investments are central to energy security, while evolving technologies and renewables are gradually transforming trade patterns.
Understanding these routes is essential for policymakers, businesses, and investors. As the world transitions to low-carbon energy, the nature of these trade routes will evolve, but their geopolitical and economic significance will remain critical. Energy trade, in essence, is a mirror reflecting the broader patterns of global power, economics, and diplomacy.
IPO Structure & Strategy1. Introduction to IPO
An IPO is a process by which a private company becomes publicly listed on a stock exchange. The fundamental purpose is to raise equity capital from a broad range of investors. Companies may pursue an IPO for several reasons:
Capital for Expansion: Raising funds to invest in new projects, infrastructure, research, or acquisitions.
Liquidity for Shareholders: Allowing early investors and founders to realize some returns.
Brand Enhancement: Being publicly listed enhances credibility, attracting customers, partners, and top talent.
Debt Reduction: IPO proceeds can be used to repay existing debt, improving the balance sheet.
However, an IPO is not just a financial transaction—it is a complex strategic initiative. The structure of the offering, timing, pricing, and investor targeting all influence the success of the IPO.
2. Types of IPO Structures
IPO structures vary depending on the objectives of the company, market conditions, and regulatory frameworks. Common structures include:
2.1 Fixed Price Offering
The company sets a fixed price per share in consultation with underwriters.
Investors subscribe at that price.
Simpler but risky if the market price diverges from the fixed price.
2.2 Book Building
Price range (price band) is provided, and investors bid within the range.
The final price is determined based on demand.
Most common method globally due to market efficiency and price discovery.
2.3 Offer for Sale (OFS)
Typically used by promoters to sell their existing shares to the public.
Does not result in fresh capital infusion but increases public shareholding.
2.4 Direct Listing
Companies bypass traditional underwriting and list existing shares directly on the exchange.
No capital is raised, but liquidity is provided.
Popular with mature tech firms.
2.5 Combination Offer
Some IPOs use a mix of fresh issue and offer for sale to balance capital raising and liquidity for existing shareholders.
3. Key Participants in IPO
Successful IPO execution requires coordination among multiple participants:
Company Promoters & Management
Drive the strategic vision, prepare financials, and liaise with regulators.
Underwriters / Investment Banks
Assess valuation, structure the offer, market the IPO, and ensure subscription.
Regulatory Authorities
Ensure compliance with securities laws (e.g., SEBI in India, SEC in the US).
Legal & Audit Advisors
Conduct due diligence, prepare offering documents, and certify disclosures.
Institutional & Retail Investors
Subscribe to shares and determine the success of the offering.
4. IPO Preparation Strategy
The preparation phase is crucial for IPO success. It includes both internal readiness and market positioning.
4.1 Financial Readiness
Audit of financial statements for at least three years.
Streamlined accounting practices.
Robust governance and risk management frameworks.
4.2 Regulatory Compliance
Filing draft prospectus (DRHP in India, S-1 in the US).
Ensuring all disclosures meet regulatory standards.
Resolving pending litigations or compliance issues.
4.3 Corporate Governance
Strengthening board structure.
Introducing independent directors.
Implementing transparency and accountability measures.
4.4 Market Timing
Assessing market conditions (equity market trends, sector performance, investor sentiment).
Avoiding volatile periods or market corrections.
Aligning IPO timing with growth milestones or earnings announcements.
5. IPO Valuation Strategy
Valuation is both an art and a science. Underpricing or overpricing can significantly affect the company’s reputation and capital raised.
5.1 Valuation Methods
Discounted Cash Flow (DCF): Future cash flows discounted to present value.
Comparable Company Analysis: Based on valuation multiples of peer companies.
Precedent Transactions: Considering valuations in prior IPOs of similar companies.
5.2 Pricing Strategy
Underpricing: Encourages oversubscription and first-day gains.
Fair Pricing: Reflects true intrinsic value to avoid leaving money on the table.
Premium Pricing: Signals confidence and strength, but may risk undersubscription.
6. Marketing & Investor Targeting Strategy
A well-executed marketing campaign ensures investor awareness and demand generation.
6.1 Roadshows
Company executives present growth story to institutional investors.
Involves international roadshows in cases of cross-border IPOs.
6.2 Media & Public Relations
Strategic communication through press releases, interviews, and social media.
Focus on transparency, company story, and future prospects.
6.3 Institutional vs Retail Allocation
Allocating shares between high-value institutional investors and retail investors.
Ensures broad-based participation and market stability.
7. Risk Management in IPO
IPO involves multiple risks:
Market Risk
Equity market volatility may reduce demand or affect pricing.
Operational Risk
Mismanagement during preparation or subscription phases.
Regulatory Risk
Delays in approvals or non-compliance penalties.
Reputation Risk
Poor performance post-IPO affects investor trust.
Mitigation Strategies:
Conservative valuation.
Thorough due diligence.
Active investor communication.
8. Post-IPO Strategy
Post-listing strategies ensure sustainable growth and market confidence.
8.1 Price Stabilization
Underwriters may support share price initially to avoid volatility.
Lock-in periods for promoters prevent mass sell-off.
8.2 Investor Relations
Continuous disclosure of financial performance and strategic initiatives.
Building a transparent, long-term relationship with investors.
8.3 Growth Capital Deployment
Utilizing IPO proceeds effectively for business expansion or debt repayment.
Demonstrates prudent capital management.
9. Strategic Considerations for IPO Timing and Market Conditions
9.1 Market Cycles
IPOs perform better during bullish markets.
Consideration of macroeconomic trends, interest rates, and liquidity conditions.
9.2 Sector-Specific Opportunities
Technology, green energy, and healthcare often attract high investor interest.
Positioning IPO to align with sector momentum improves subscription rates.
9.3 Regulatory Changes
IPO windows may be influenced by new regulations, tax policies, or investor-friendly reforms.
10. Global Trends in IPO Strategy
Modern IPO strategies increasingly reflect global practices:
SPACs (Special Purpose Acquisition Companies)
An alternative to traditional IPOs, allowing faster market access.
Dual Listings
Listing on multiple exchanges to attract international investors.
ESG-Linked IPOs
Companies highlighting environmental, social, and governance credentials gain investor interest.
Conclusion
An IPO is far more than a mechanism to raise capital. It is a strategic event that reshapes a company’s financial, operational, and market positioning. The success of an IPO depends on careful planning, transparent governance, meticulous valuation, strategic marketing, and effective post-IPO management. Companies that adopt a structured and holistic approach to IPO planning are better equipped to maximize capital, strengthen investor confidence, and achieve sustainable growth.
Globalization vs. Deglobalization Debate in the World MarketUnderstanding Globalization
Globalization can be defined as the process of increasing interdependence and interconnectedness among countries in economic, political, cultural, and technological dimensions. In markets, it primarily manifests as:
Free Trade Expansion – Removal of tariffs, quotas, and trade restrictions.
Global Supply Chains – Companies outsourcing production to countries with cost advantages.
Cross-Border Investments – Growth of foreign direct investment (FDI) and multinational corporations (MNCs).
Financial Integration – Capital moving across borders through stock markets, banks, and investment funds.
Technology & Communication – Internet and digitalization connecting producers, consumers, and investors worldwide.
Globalization surged after the Cold War (1990s onward), when liberalization and deregulation policies spread across emerging markets. Institutions like the World Trade Organization (WTO), International Monetary Fund (IMF), and World Bank promoted cross-border economic integration. The rise of China as the world’s factory, India’s IT revolution, and global consumer brands like Apple, Toyota, and Samsung are products of globalization.
Understanding Deglobalization
Deglobalization refers to the deliberate reduction of interdependence between nations in trade, investment, and financial flows. Instead of expanding global linkages, countries adopt policies that bring economic activities closer to home. It manifests as:
Trade Protectionism – Tariffs, quotas, and restrictions on imports.
National Industrial Policies – Encouraging domestic manufacturing (e.g., “Make in India,” “America First”).
Supply Chain Re-shoring – Companies moving production back to home countries or nearby regions.
Geopolitical Rivalries – Economic sanctions, tech wars, and restricted access to markets.
Financial Decoupling – Limiting cross-border capital exposure to reduce vulnerability.
Deglobalization does not imply complete isolation but rather a recalibration of global connections. It gained momentum post-2008 financial crisis, accelerated during COVID-19 when countries realized the risks of overdependence on global supply chains, and strengthened further with geopolitical conflicts like the Russia-Ukraine war.
Historical Evolution of Globalization & Deglobalization
The globalization-deglobalization cycle is not entirely new.
First Wave of Globalization (1870–1914): Fueled by industrial revolution, railroads, shipping, and colonialism. Trade flourished until World War I disrupted global markets.
First Wave of Deglobalization (1914–1945): Wars, the Great Depression, and protectionist policies (e.g., Smoot-Hawley Tariff in the US) restricted global trade.
Second Wave of Globalization (1945–1980s): Post-WWII reconstruction, Bretton Woods system, and the spread of liberal economic policies.
Third Wave of Globalization (1990–2008): Collapse of the Soviet Union, rise of China, internet boom, global outsourcing, and trade liberalization.
Second Wave of Deglobalization (2008–Present): Financial crises, populism, technological nationalism, environmental concerns, and supply chain reconfiguration.
Thus, globalization and deglobalization are not absolute opposites but phases of world economic history.
Globalization: Benefits and Challenges
Benefits:
Economic Growth: Expanding markets allow countries to specialize and scale production.
Lower Costs: Outsourcing and supply chains reduce production costs for consumers.
Innovation & Technology Transfer: Global collaboration accelerates knowledge sharing.
Access to Capital: Emerging economies benefit from FDI and portfolio investments.
Cultural Exchange: Travel, media, and education foster cross-cultural connections.
Challenges:
Job Displacement: Outsourcing leads to unemployment in high-cost economies.
Income Inequality: Benefits unevenly distributed between nations and social groups.
Environmental Damage: Global supply chains increase carbon emissions.
Financial Vulnerability: Global crises spread rapidly (2008, 2020).
Cultural Homogenization: Local cultures risk being overshadowed by global brands.
Deglobalization: Benefits and Challenges
Benefits:
Domestic Industry Protection: Safeguards jobs and industries from global shocks.
Supply Chain Resilience: Reduces vulnerability to disruptions.
National Security: Greater control over critical industries (food, energy, defense).
Environmental Gains: Local production may cut transport-related emissions.
Balanced Global Order: Prevents excessive dependence on a few countries (e.g., China).
Challenges:
Higher Costs: Localized production increases consumer prices.
Reduced Innovation: Less collaboration slows technological progress.
Market Fragmentation: Trade restrictions reduce efficiency of global systems.
Risk of Retaliation: Trade wars harm exporters and global supply chains.
Slower Global Growth: Reduced trade and capital flows hinder overall prosperity.
Impact on World Markets
Trade Volumes: WTO data shows slowing global trade growth since 2015.
Stock Markets: Globalization increases correlation across markets; deglobalization creates divergence.
Commodities: Oil, gas, and food supplies disrupted by geopolitical tensions.
Currencies: Dollar dominance challenged by yuan, euro, and alternative payment systems (de-dollarization debates).
Corporate Strategies: Multinationals now adopt “China+1” strategy to diversify manufacturing bases.
Future Outlook: Convergence or Divergence?
Not the End of Globalization: Rather than collapse, globalization is restructuring.
Selective Deglobalization: Nations are decoupling in strategic sectors (defense, tech, energy) while still integrating in consumer goods and services.
Regionalization: Global supply chains are evolving into regional blocs (USMCA, EU, RCEP).
Digital Globalization: Data, AI, and digital finance will shape future trade flows.
Sustainable Globalization: Green energy, climate agreements, and ESG investments may form a new framework.
Conclusion
The globalization vs. deglobalization debate is not about one force replacing the other but about how the balance shifts over time. Globalization brought unprecedented prosperity, technological progress, and interconnectedness, but it also exposed vulnerabilities such as inequality, overdependence, and fragility of global systems. Deglobalization responds to these weaknesses, yet it risks reversing gains made over decades.
In reality, the world is likely moving toward a hybrid model—“re-globalization” or “regional globalization”—where countries remain interconnected but with greater safeguards, diversification, and focus on self-reliance. The future world market will not be flat, as Thomas Friedman once wrote, but rather fragmented yet interconnected, shaped by geopolitics, technology, and sustainability imperatives.
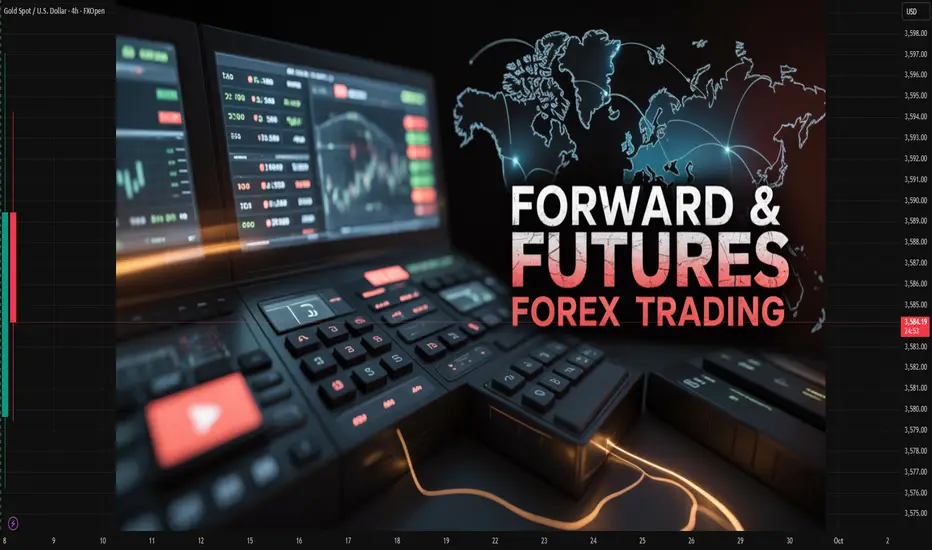
Forward & Futures Forex TradingChapter 1: Basics of Forex Derivatives
1.1 What are Forex Derivatives?
A derivative is a financial instrument whose value depends on the price of an underlying asset. In forex, derivatives derive their value from currency exchange rates.
Common forex derivatives include:
Forwards – customized OTC contracts.
Futures – standardized exchange-traded contracts.
Options – rights but not obligations to exchange currencies.
Swaps – agreements to exchange cash flows in different currencies.
1.2 Why Use Forex Derivatives?
Hedging: To protect against adverse currency movements.
Speculation: To profit from expected exchange rate movements.
Arbitrage: To exploit price discrepancies across markets.
Chapter 2: Forward Forex Contracts
2.1 What is a Forward Contract?
A forward contract is a private agreement between two parties to buy or sell a specified amount of currency at a predetermined exchange rate on a future date.
Example:
A U.S. importer agrees today to buy €1 million from a bank in three months at an agreed exchange rate of 1.10 USD/EUR. Regardless of the spot rate in three months, the importer must pay at that rate.
2.2 Key Features of Forward Contracts
Customization: Amount, maturity date, and settlement terms are negotiable.
Over-the-Counter (OTC): Not traded on exchanges, but arranged between banks, institutions, and corporations.
Obligation: Both buyer and seller are bound to fulfill the contract.
No upfront payment: Typically requires no premium, though banks may ask for collateral.
2.3 Types of Forward Contracts
Outright Forward – standard agreement for a fixed amount and date.
Flexible Forward – allows settlement within a range of dates.
Non-Deliverable Forward (NDF) – cash-settled in one currency, often used for restricted currencies (e.g., INR, CNY).
Window Forward – permits multiple drawdowns during a period.
2.4 Participants in Forward Contracts
Corporations – hedge imports/exports.
Banks – provide liquidity and quotes.
Hedge Funds – speculate on currency movements.
Central Banks – occasionally use forwards to manage reserves.
Chapter 3: Forex Futures
3.1 What are Futures Contracts?
A forex futures contract is a standardized agreement traded on an exchange to buy or sell a currency at a predetermined price on a specified future date.
Example:
A trader buys a EUR/USD futures contract expiring in December at 1.1050. If the euro strengthens, the futures price rises, and the trader profits by selling the contract later.
3.2 Key Features of Futures Contracts
Standardization: Contract size, maturity, and tick value are fixed by the exchange.
Exchange-Traded: Offered on platforms like CME (Chicago Mercantile Exchange).
Daily Settlement: Marked-to-market each day, with gains/losses credited/debited.
Margin Requirement: Traders must deposit initial and maintenance margins.
Liquidity: High in major currency pairs like EUR/USD, GBP/USD, and JPY/USD.
3.3 Common Forex Futures Contracts
EUR/USD futures
GBP/USD futures
JPY/USD futures
AUD/USD futures
Emerging market currency futures (less liquid but growing).
3.4 Participants in Futures Contracts
Speculators – retail and institutional traders betting on price moves.
Hedgers – corporations, exporters, and importers.
Arbitrageurs – exploit mispricing between spot, forward, and futures.
Chapter 4: Forwards vs Futures – Key Differences
Feature Forwards Futures
Market OTC (private contracts) Exchange-traded
Standardization Fully customized Standard contract sizes/dates
Settlement On maturity Daily mark-to-market
Counterparty Risk Higher (depends on bank/party) Low (exchange clearinghouse guarantees)
Liquidity Varies by bank relationship High in major pairs
Flexibility High Low
Usage Hedging (corporates) Hedging & speculation (traders/investors)
Chapter 5: Pricing and Valuation
5.1 Forward Pricing Formula
Forward exchange rate = Spot rate × (1 + interest rate of base currency) / (1 + interest rate of quote currency).
Example:
Spot EUR/USD = 1.1000
USD interest rate = 5% p.a.
EUR interest rate = 3% p.a.
1-year forward = 1.1000 × (1.05 / 1.03) ≈ 1.1214
5.2 Futures Pricing
Futures pricing is similar but adjusted for:
Daily settlement (mark-to-market).
Exchange trading costs.
Slight deviations from theoretical parity due to liquidity.
Chapter 6: Strategies with Forwards & Futures
6.1 Hedging Strategies
Importer Hedge: Lock in forward rate to avoid rising costs.
Exporter Hedge: Lock in forward to protect against falling revenues.
Futures Hedge: Use standardized contracts to offset exposure.
6.2 Speculation Strategies
Directional Trades: Bet on EUR/USD rising or falling using futures.
Carry Trade via Forwards: Exploit interest rate differentials.
Spread Trading: Trade differences between spot and futures.
6.3 Arbitrage Opportunities
Covered Interest Arbitrage: Lock in risk-free profits by exploiting discrepancies between forward rates and interest rate differentials.
Cash-and-Carry Arbitrage: Use spot and futures price mismatches.
Chapter 7: Risks in Forward & Futures Trading
7.1 Risks in Forwards
Counterparty Risk – the other party may default.
Liquidity Risk – difficult to unwind before maturity.
Regulation Risk – OTC contracts less transparent.
7.2 Risks in Futures
Margin Calls – sudden volatility can wipe out traders.
Leverage Risk – high leverage amplifies losses.
Market Risk – currency volatility due to geopolitical or economic shocks.
Chapter 8: Real-World Applications
8.1 Corporate Hedging Example
Airline Company: A U.S. airline buying aircraft from Europe may use a forward to lock in EUR/USD exchange rate for payment due in six months.
8.2 Speculator Example
Futures Trader: A hedge fund expects USD to weaken against EUR and buys EUR/USD futures contracts. If EUR rises, profits are made without ever handling physical currency.
8.3 Emerging Market Case
Indian IT Exporter: Uses USD/INR forward contracts to protect revenue from U.S. clients.
Chapter 9: Regulatory Environment
Forwards: Governed by ISDA agreements in OTC markets.
Futures: Regulated by exchanges (CME, ICE) and oversight bodies (CFTC in the U.S., ESMA in Europe).
Basel III Framework: Requires banks to hold capital for counterparty risks in derivatives.
Chapter 10: The Future of Forward & Futures Forex Trading
Digitalization: Rise of electronic platforms for forward trading.
Crypto Futures: Growing demand for crypto/forex hybrid products.
AI & Algo Trading: Automated strategies dominating futures markets.
Emerging Market Growth: Increasing use of forwards in Asia and Latin America.
Conclusion
Forward and futures forex contracts are cornerstones of global currency trading, serving hedgers, speculators, and arbitrageurs alike.
Forwards provide customized, flexible solutions for corporations to hedge currency risk.
Futures offer standardized, liquid, and transparent trading instruments for both hedging and speculation.
Both carry risks—from counterparty risk in forwards to leverage and margin risks in futures—but they remain indispensable tools in managing the uncertainties of currency markets.
In today’s interconnected economy, where exchange rate volatility is influenced by central bank policies, geopolitical events, and global trade flows, forward and futures forex trading will continue to be critical for risk management and investment strategies worldwide.
ACA/USDT Scalp Trade AnalysisBased on the analysis of the ACA/USDT scalp chart, it is recommended to enter a position at a price of $0.0931. The targets for this trade are set at $0.0994, $0.110, and $0.1182, respectively. In order to limit potential losses, it is advisable to set a stop loss at $0.0881.
It is important to note that the ACA cryptocurrency is currently in a bearish trend, and has recently broken its all-time low. Therefore, it is essential to only enter this trade if the price reaches the specified entry point of $0.0931. Once the order is filled, it is recommended to place the stop loss at $0.0881 to minimize potential losses.
Overall, it is important to approach this trade with a professional mindset and adhere to proper risk management techniques.


BTCUSD FUTURE TRADEI have to search even in these difficult times, I tried to look for positions,
I would open short positions here.
non-financial advice.
Follow me.

Alementation Couche Tarde ATD.B.to Couche Tard Bull pennant, broken old resistance from 2020. looking for a retest of the support lines before buying.


XAUUSDThis is my understanding and my quick analysis of XAUUSD , if you are going to place this trade, this is at your own risk, however in the analysis you can see a very good opportunity, from my understanding XAUUSD will reach 1800.00 not much to explain you can see my analysis, however for people who have just started forex I would highly recommend you to stay away from gold as its very risky to trade during this time and gold more loss than other pair such as AUDUSD, GBPUSD, AUDJPY.

GBPJPY => Short Trade Setup Predicted Shortwe appreciate your coming for taking the time to read our idea please do not forget to hit the like it's our only reward🙌
If one of our idea can help one other person , then to me, that is success. Strive to be authentic, not perfect. Share your Ideas in Comments – that’s what enables Traders to connect. And know that there is always someone listening –
=>
if You Need Trading guide, any Notes, any information about trading Feel free to message us through Trading view.
Check today analysis
___________________________________________________________________________
Before trading our ideas make your own analysis and research properly.
Forex Trading are leveraged product & can result in the loss of your entire capital.
Please ensure you fully understand the Risks involved.
>>
I’d like to close with a big thank you. Thank you for reading and for helping us to grow. But most of all thank you for being a part of our journey…
With love,
Trading Fleet Team


