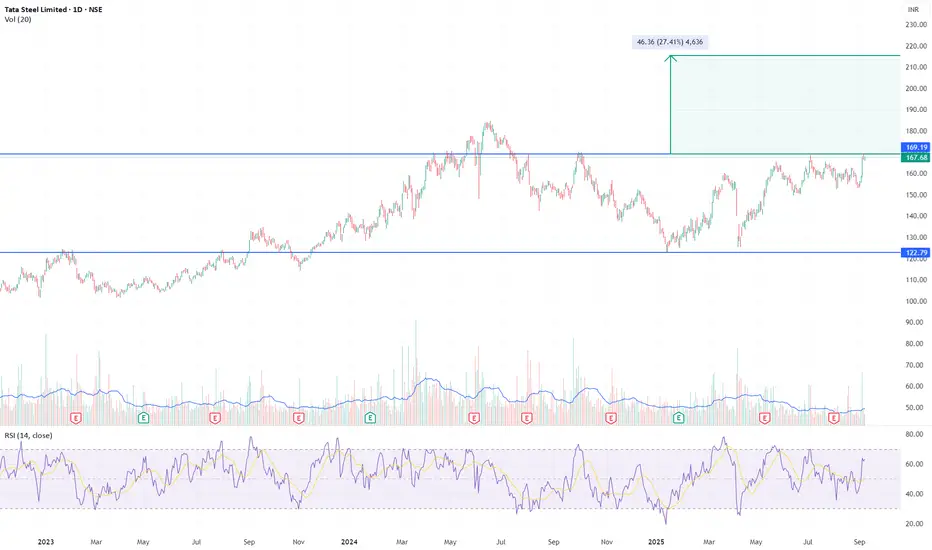
Tata Steel – Multi-Year Base Breakout Setting UpThesis
Tata Steel is testing a major resistance zone around ₹169 after consolidating in a wide range (115–170) for nearly 2 years. A decisive breakout here would mark the completion of a multi-year rounding base, opening the path to higher levels.
Technical Setup
Structure: Multi-year consolidation / rounding base since mid-2023
Breakout Level: ₹169 (tested repeatedly)
Primary Target: ₹185–190 (nearest supply zone)
Extended Target: ₹210–215 (measured move of base depth)
RSI: ~63, rising but not overbought
Volume: Needs strong confirmation to validate breakout
Invalidation: Breakdown below ₹160
Fundamental Context
Recent quarters show earnings recovery from cost control and safeguard duties.
Valuations elevated (P/E ~46–51×), margins thin, leverage moderate.
Interpretation: Fundamentals are mixed, but cyclical tailwinds and government protection provide near-term support.
Disclaimer
For educational purposes only. Not investment advice.
Tatasteel
TATA STEEL Ltd for 29th Oct #TATASTEEL TATA STEEL Ltd for 29th Oct #TATASTEEL
Resistance 183-184 Watching above 184 for upside momentum.
Support area 175 Below 180 gnoring upside momentum for intraday
Watching below 175 for downside movement...
Above 180 ignoring downside move for intraday
Charts for Educational purposes only.
Please follow strict stop loss and risk reward if you follow the level.
Thanks,
V Trade Point

AMZN 2Hour Time frameAMZN 2-Hour Snapshot
Current Price: $238.24 USD
Change: +1.02% from the previous close
Intraday High: Not available
Intraday Low: Not available
🔎 Technical Indicators
Relative Strength Index (RSI): Neutral
Moving Averages:
5-period MA: Not available
10-period MA: Not available
20-period MA: Not available
50-period MA: Not available
📈 Market Sentiment
Pivot Points:
Resistance: Not available
Support: Not available
📅 Outlook
Bullish Scenario: A breakout above the current price could lead to further gains.
Bearish Scenario: A drop below the current price may test support levels.
Overall Bias: Neutral, with mixed signals from moving averages and momentum indicators.

TATASTEEL LTD 240 MINS TIME FRAME - MY VIEW ONLYThe Structure looks good to us, waiting for this instrument to correct and then give us these opportunities as shown on this instrument (Price Chart).
Note: Its my view only and its for educational purpose only. Only who has got knowledge about this strategy, will understand what to be done on this setup. its purely based on my technical analysis only (strategies). we don't focus on the short term moves, we look for only for Bullish or Bearish Impulsive moves on the setups after a good price action is formed as per the strategy. we never get into corrective moves. because it will test our patience and also it will be a bullish or a bearish trap. and try trade the big moves.
We do not get into bullish or bearish traps. We anticipate and get into only big bullish or bearish moves (Impulsive Moves). Just ride the Bullish or Bearish Impulsive Move. Learn & Know the Complete Market Cycle.
Buy Low and Sell High Concept. Buy at Cheaper Price and Sell at Expensive Price.
Please keep your comments useful & respectful.
Keep it simple, keep it Unique.
Thanks for your support
Tradelikemee Academy
Saanjayy K G

Tatasteel on the MoveTatasteel NSE:TATASTEEL on the Move. You can make a safe Target for 160 and exit.

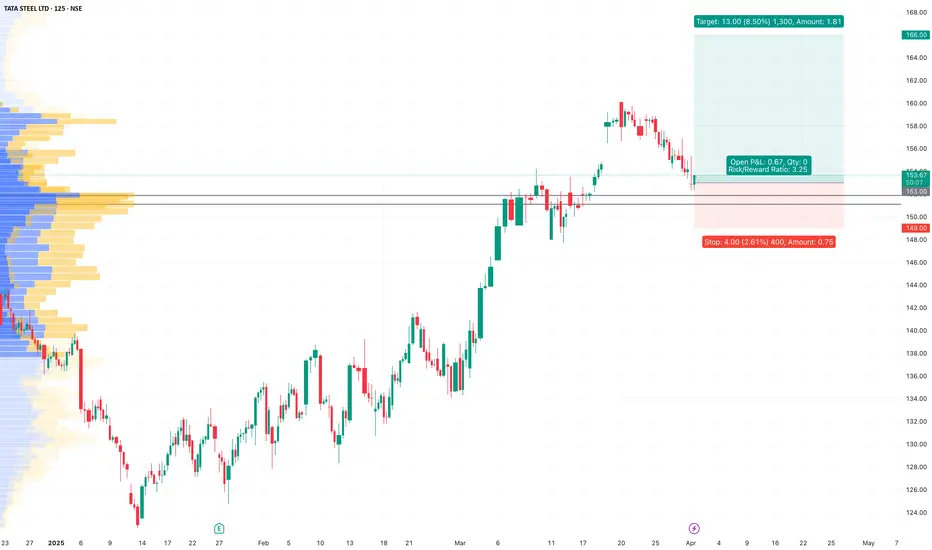
TATASTEEL - Tata Steel LTD (2 hours chart, NSE) - Long PositionTATASTEEL - Tata Steel LTD (2 hours chart, NSE) - Long Position; short-term research idea.
Risk assessment: High {volume & support structure integrity risk}
Risk/Reward ratio ~ 3.25
Current Market Price (CMP) ~ 154
Entry limit ~ 153
1. Target limit ~ 158 (+3.27%; +5 points)
2. Target limit ~ 161 (+5.23%; +8 points)
3. Target limit ~ 166 (+8.50%; +13 points)
Stop order limit ~ 149 (-2.61%; -4 point)
Disclaimer: Investments in securities markets are subject to market risks. All information presented in this group is strictly for reference and personal study purposes only and is not a recommendation and/or a solicitation to act upon under any interpretation of the letter.
LEGEND:
{curly brackets} = observation notes
= important updates
(parentheses) = information details
~ tilde/approximation = variable value
-hyphen = fixed value
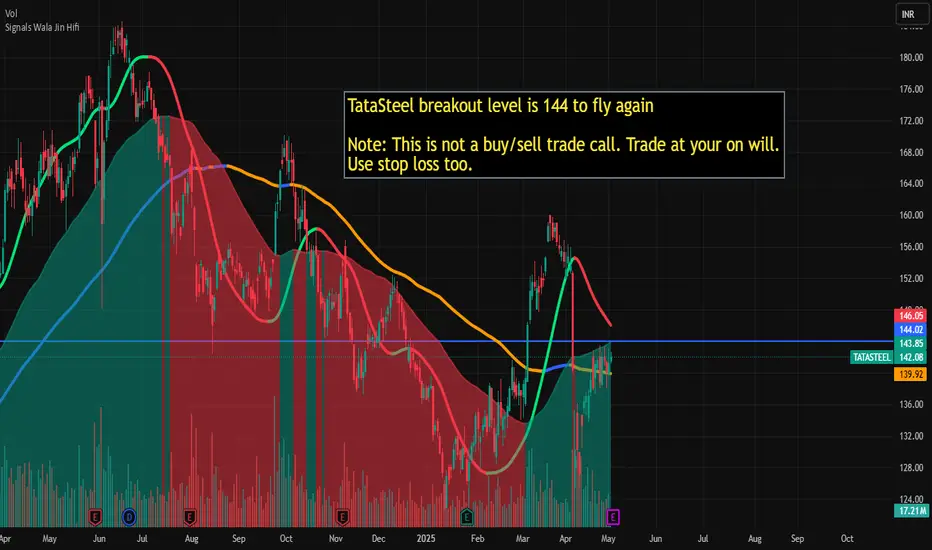
Tata Steel breakout level is 144 for fly againTataSteel breakout level is 144 to fly again
Note: This is not a buy/sell trade call. Trade at your on will. Use stop loss too.
TataSteel , 1WThe Channel Pattern Breakout is looking very Good ,
we can consider this Breakout at this point also because it is at 20 EMA Support
if you are not Confident wait for Proper Retest to enter or if you want to take some risk then You can Enter at this Place .
Follow For More Ideas like this Swing Trade Ideas

balmlawrie in buyfundamentally its in under value also near margin of safty
the zone is retracement demand zone so it may react in this zone
NOTES: WE CANT POST ANY ACCURATE ENTRY ON PUBLICE DUE TO SEBI RULES
telegram.me

Result of TATA STEEL Analysis within a WeekI gave a analyses last week that metal stock may be in green and in those many stock i choose TATA STEEL and gave brief description and now here is the result.
TATA Steel upside?TATA Steel looking good just near 50ema could reach upto 157-160. but,
1. Look out for retest near 200ema
2. Fib - at .55 another pullback is possible
3. Please check other fundamentals and sector analysis

tata steel in buytata steel is pure vaule stock
so current a nifty in side ways upside tata steel will give M pattern @184 from 130 then it will come under book value that mean
72.2 tata steel book value
1st buy zone 130 trg 184
2nd buy zone 70-50 trg 260
margin of safety 35 trg 277

TATA CHEMICAL DIVERGENCE 1 YEAR LOOKOUT CMP :1088
needs monthly closing above 1151 for first confirmation and 1251 final confirmation.
stuck in same range for long time with rsi divergence.
note : its just for educational purpose and not a trading call/tip.

TATASTEELNSE:TATASTEEL
One Can Enter Now ! Or Wait for Retest of the Trendline (BO) Or wait For better R:R ratio
Note :
1.One Can Go long with a Strict SL below the Trendline or Swing Low of Daily Candle.
2. Close, should be good and Clean.
3. R:R ratio should be 1 :2 minimum
4. Plan as per your RISK appetite
Disclaimer : You are responsible for your Profits and loss, Shared for Educational purpose


Tata Steel Ltd Stock Review 2024: Financial Insights & TechnicalTATASTEEL
Financial Insights: Tata Steel Ltd’s Current Market Position
Understanding Tata Steel's financial metrics can help you evaluate the stock’s true value and growth potential. Let’s dive into some key figures:
Market Capitalization: ₹2,00,560 Cr
Tata Steel remains one of the largest companies in India by market cap, showing its dominance in the steel sector.
Current Stock Price: ₹161
As of today, Tata Steel is trading at ₹161, positioning itself in the middle of its 52-week range.
52-Week High / Low: ₹185 / ₹114
The stock has experienced significant volatility over the past year, with a high of ₹185 and a low of ₹114.
Price-to-Earnings (P/E) Ratio: 124
A high P/E ratio suggests that Tata Steel is trading at a premium based on its current earnings, which could either point to growth expectations or an overvalued stock.
Book Value: ₹73.7
This figure represents Tata Steel's per-share value if it were liquidated today.
Dividend Yield: 2.24%
Tata Steel offers a solid dividend yield, making it attractive to investors looking for both growth and income.
Return on Capital Employed (ROCE): 7.02%
ROCE shows how efficiently the company is using its capital to generate profits, and Tata Steel's 7.02% is moderate.
Return on Equity (ROE): 6.55%
ROE reflects the company’s ability to generate profit from shareholder investments, which in this case is slightly below the industry average.
Promoter Holding: 33.2%
The promoters of Tata Steel hold a significant 33.2% stake, reflecting their confidence in the company’s long-term potential.
Pledged Shares: 0.00%
None of the promoter's shares are pledged, which is a sign of financial strength.
Technical Analysis: Key Price Levels to Watch in Tata Steel Ltd
For those employing technical analysis, Tata Steel presents several key price levels to monitor. While these are not buy/sell recommendations, they can help traders and analysts gauge the stock’s momentum.
Price Expectation for Upside:
If Tata Steel’s price breaks above the ₹163 range, it could signal a potential upward movement, driven by renewed market interest.
Support Level:
A crucial support level exists around ₹83, which has historically acted as a base for the stock.
Swing Trading Targets:
Traders could look at ₹212, ₹234, ₹291, and ₹363+ as potential target levels for swing trading based on market momentum and technical signals.
Tata Steel Ltd: Is It a Good Investment for 2024?
Tata Steel offers a mix of opportunities for both long-term investors and short-term traders. Its market cap and dividend yield make it attractive for those looking for stable investments, while its high P/E ratio suggests that future growth expectations are already priced in. From a technical perspective, the stock presents potential upward momentum beyond ₹163, making it interesting for swing traders.
That said, it’s crucial to remain cautious, as the steel industry is sensitive to global economic cycles and commodity price fluctuations. Conduct thorough research and consult financial experts before making any investment decisions.
Conclusion: Tata Steel Ltd – A Stock with Strong Potential but Risks to Consider
Tata Steel Ltd continues to hold a prominent place in the Indian stock market, with solid financial fundamentals and promising technical levels for traders. For investors, the company’s consistent dividends and market dominance are strong positives. However, the high valuation and moderate returns might prompt some caution.
Disclaimer: This blog post is for informational purposes only and does not constitute financial advice. Please consult with a qualified financial advisor before making any investment decisions.

TATA STEEL BULLISH FLAG buy Traders may consider buying Tata Steel if the stock price breaks out above the upper trendline of the flag, with a stop-loss placed below the lower trendline of the flag.

Time to accumulate this stockthis is in good price range. We have a good support around 140 worth taking the risk.

TATASTEELHi guys,
In this chart i Found a Demand Zone in TATASTEEL CHART for Positional entry,
Observed these Levels based on price action and Demand & Supply.
*Don't Take any trades based on this Picture.
... because this chart is for educational purpose only not for Buy or Sell Recommendation..
Thank you

Tata Steel Ltd - Key Levels for BreakoutTata Steel is currently at a critical juncture. Watch for a potential breakout in either direction. Key resistance levels to monitor are at 169.00 and 181.00. A decisive move in either direction could signal the next major trend.

TATASTEEL : Awaiting Breakout Either DirectionIn Box range from few days.
Awaiting Breakout in either direction #BreakoutSoon

BAYERCROP LONGThis stock fundamentally too strong also its agri product
it will go upto 8-9k 6month-1year
if its retrace 5k-4k-3k is entry
no stoploss only for investment
dividend is Rs.100+/year

TATASTEEL Bullish Divergence & Reversal from SupportBullish Divergence in RSI
Reversal from Support
Next earning and revenue report on 31 july
