TradeCityPro | SOL Testing Major Trendline for Next Big Move👋 Welcome to TradeCityPro!
In this analysis, I want to review SOL, one of the most popular cryptocurrencies, ranked 6th on CoinMarketCap with a market cap of $76 billion.
⏳ 4-Hour Timeframe
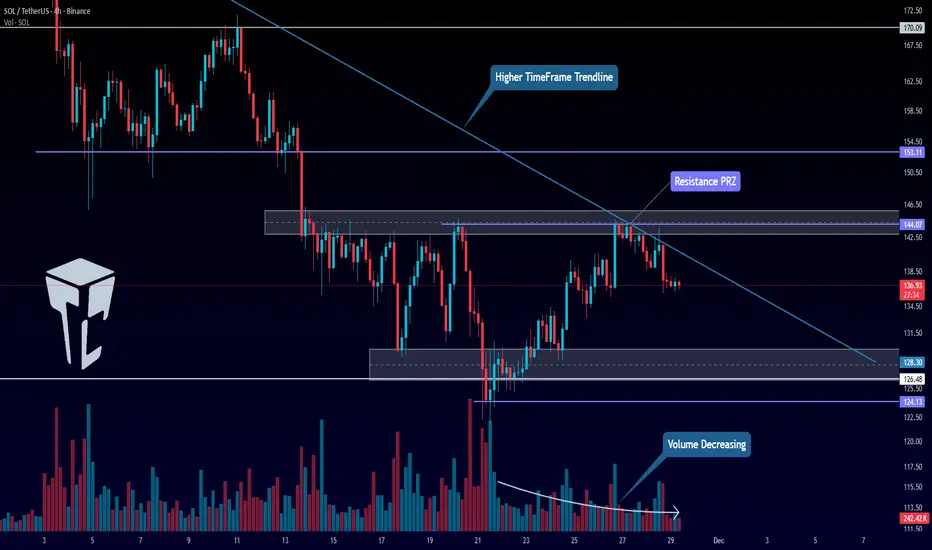
Solana has been respecting a descending trendline coming from higher timeframes. The price has touched this trendline multiple times, and it has interacted with it again recently.
✨ Overall, after completing its previous bearish wave, Solana has formed a range box, and the price has been oscillating between the support and resistance zones I’ve marked for you.
✔️ The top of this box can be identified at 144.07, since the price has reacted to this level twice. However, the entire zone I've highlighted is a significant resistance area.
💡 This resistance overlaps with the descending trendline from the daily timeframe, forming a strong PRZ (Potential Reversal Zone).
💥 On top of that, while Solana was moving from the bottom of the box toward the top, market volume was decreasing, and the size of the bullish candles was very small — both clear signs of weak buying pressure.
📊 Once the price reached the PRZ, sellers entered the market again, and the price is now moving downward along the trendline.
🧩 If this trendline does not break, and the price continues moving downward toward the $126 support, the chances of the support failing increase significantly. In that scenario, a short position can be taken on a break of that support.
📈 However, if the trendline does break, then the 144.07 level becomes the best trigger for trendline breakout confirmation.
⚡️ A stabilization above this zone would give us confirmation of a bullish reversal on Solana and provide a clean setup for opening a long position.
📝 Final Thoughts
Stay calm, trade wisely, and let's capture the market's best opportunities!
This analysis reflects our opinions and is not financial advice.
Share your thoughts in the comments, and don’t forget to share this analysis with your friends! ❤️
TCP
TradeCityPro | Bitcoin Daily Analysis #234👋 Welcome to TradeCityPro!
Let’s move on to the Bitcoin analysis. The market is continuing the upward movement it started earlier.
⏳ 1-Hour Timeframe
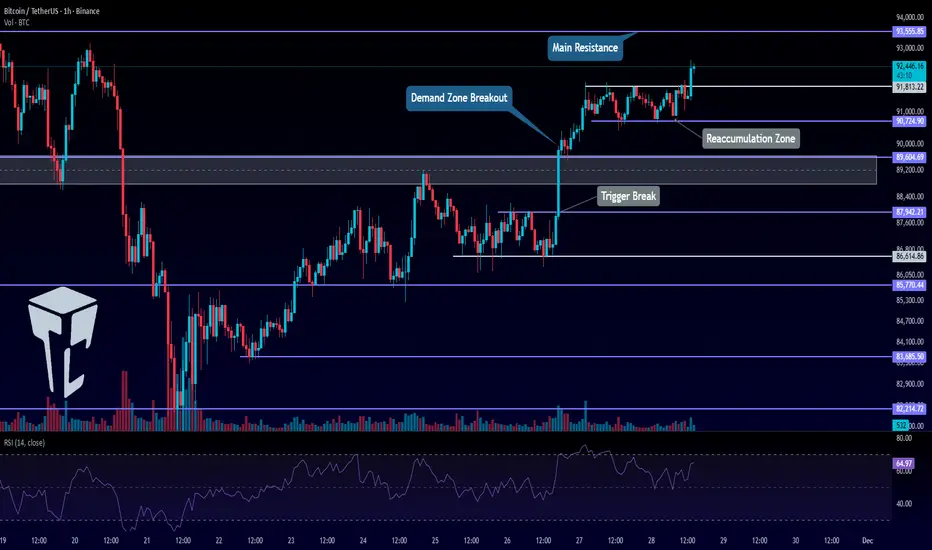
Yesterday, after breaking the resistance zone, Bitcoin entered a small ranging box, and now the price has managed to stabilize above this box.
🔔 This range allowed the price to rest, and with new momentum entering the market, Bitcoin is now ready to move toward the 93,555 level.
💥 The RSI oscillator has formed a new momentum low around the 50 level.
✔️ This shows increased bullish momentum compared to the previous leg, because in the previous leg, RSI’s support was at 21.
✨ If this new RSI low holds, the market’s momentum will remain bullish, allowing the price to continue its upward movement.
📊 The triggers we previously had 87,942, 89,000, and 91,813 all activated and are currently in profit.
The next trigger for Bitcoin is at 93,555.
⭐ When the price reaches 93,555, there is a high probability that the market will begin ranging again or enter a correction.
⚡️ So if I see signs of exhaustion or reversal at that level, I will manage risk and take profits on my positions.
❌ Disclaimer ❌
Trading futures is highly risky and dangerous. If you're not an expert, these triggers may not be suitable for you. You should first learn risk and capital management. You can also use the educational content from this channel.
Finally, these triggers reflect my personal opinions on price action, and the market may move completely against this analysis. So, do your own research before opening any position.
TradeCityPro | Bitcoin Daily Analysis #233👋 Welcome to TradeCity Pro!
Let’s dive into today’s Bitcoin analysis. The market is moving upwards today, and yesterday, the long triggers we discussed were activated.
⏳ 1-Hour Timeframe
In yesterday’s analysis, I mentioned that Bitcoin was sitting at its momentum support zone in RSI. I also pointed out that if the RSI was supported at this level, the bullish momentum would be revived in the market.
⭐ This is exactly what happened. With the RSI support, buying volume entered the market, and after breaking the 87,942 level, we had our first long entry trigger.
✔️ The reason for this early entry, as mentioned in yesterday's analysis, was that we had confirmation of momentum from the RSI. This allowed us to enter the position earlier than waiting for the 89,000 level to break.
💥 The second main trigger for Bitcoin was the break of the 89,000 level, which happened with a strong bullish candle. If you didn’t have a stop buy order, you likely missed the chance to open the position.
💡 Currently, after breaking this level, the price has shown some weakness and reacted to the 91,581 zone, with the RSI moving out of the overbought zone.
📊 The volume during the last few green candles was low, and now, with the red candles, the volume is increasing.
⚖️ If the correction continues and becomes deeper, the price might pull back to the 89,000 zone. However, as long as the price remains above 89,000, I believe the short-term market trend will remain bullish, and a deeper downward leg is not expected on higher cycles.
💫 We can use the 89,000 level as a short trigger for the next bearish wave in the market.
🎲 In this case, the main support zones to watch are 86,614 and 82,214.
📈 For long positions, today, if Bitcoin breaks above 91,581, we can open a position. However, there is a very important resistance at the 93,555 level, which is the main trigger for confirming the bullish trend. It’s better to wait until this level is broken before actively pursuing a long position.
❌ Disclaimer ❌
Trading futures is highly risky and dangerous. If you're not an expert, these triggers may not be suitable for you. You should first learn risk and capital management. You can also use the educational content from this channel.
Finally, these triggers reflect my personal opinions on price action, and the market may move completely against this analysis. So, do your own research before opening any position.

TradeCityPro | QNT Faces Key Resistance, Eyes Potential Reversal👋 Welcome to TradeCity Pro!
Let’s dive into the analysis of the QNT coin, one of the RWA (Real-World Asset) coins with a $25.1 million market cap, currently ranked 65th on CoinMarketCap.
⏳ 4-Hour Timeframe
On the 4-hour timeframe, this coin is currently in a large range box, and it is now near the upper boundary of this box.
⭐ The upper boundary of this box represents a strong resistance zone, and as you can see, the last time the price was rejected from this zone, a bearish move started.
📊 Currently, the price has moved near this zone, and before reaching it, the price started to correct.
💡 As long as the price remains above 81.18, any downward movement can be considered a correction. If the price touches the zone again and breaks it, we can open a long position.
💥 If the price stabilizes below the 81.18 level, and if selling volume increases, we can open a short position. In that case, the price could move toward the 70.62 support level.
📉 The main confirmation for the bearish trend and the start of a new downward wave for this coin will come after the price stabilizes below 70.62.
📝 Final Thoughts
Stay calm, trade wisely, and let's capture the market's best opportunities!
This analysis reflects our opinions and is not financial advice.
Share your thoughts in the comments, and don’t forget to share this analysis with your friends! ❤️

TradeCityPro | Bitcoin Daily Analysis #232👋 Welcome to TradeCityPro!
Let’s dive into the Bitcoin analysis. This week has been a range-bound week for Bitcoin, and this range still continues.
⏳ 1-Hour Timeframe
The market conditions haven’t changed much compared to yesterday. Bitcoin has simply continued its range-bound movement.
⚡️ We had a resistance zone at 89,000, which the price had previously touched. In the subsequent move, the price has not been able to reach this level again, indicating a lack of buying strength.
🧩 Considering the decrease in volume and the weakening of the red candles, the chances of reaching 89,000 in this leg are quite low.
💥 The RSI oscillator has reached the momentum support zone for the price at 41.31.
🎲 If this level is broken, we can say that the bullish momentum will completely disappear, and the market will need to form a new structure.
✅ The loss of bullish momentum does not necessarily mean the end of the uptrend or the beginning of a downtrend. It simply means that the market’s momentum has faded, and we will need to wait and see what happens in the new structure.
💡 If the RSI stabilizes below this level, we can open a short position after breaking 85,770 and a long position after breaking the 89,000 level.
📊 However, if the RSI maintains its momentum and gets supported, we can enter a position earlier with the trigger at 87,942.
✨ The 87,942 trigger is considered risky, so I recommend paying attention to the volume. If the volume confirms the move, you can open the position after the breakout.
❌ Disclaimer ❌
Trading futures is highly risky and dangerous. If you're not an expert, these triggers may not be suitable for you. You should first learn risk and capital management. You can also use the educational content from this channel.
Finally, these triggers reflect my personal opinions on price action, and the market may move completely against this analysis. So, do your own research before opening any position.

TradeCityPro | Ethereum Eyes Key Levels for Trend Reversal👋 Welcome to TradeCityPro!
Let’s dive into the Ethereum analysis, the queen of the market, ranked 2nd on CoinMarketCap with a $351 billion market cap, right after Bitcoin.
📅 Daily Timeframe
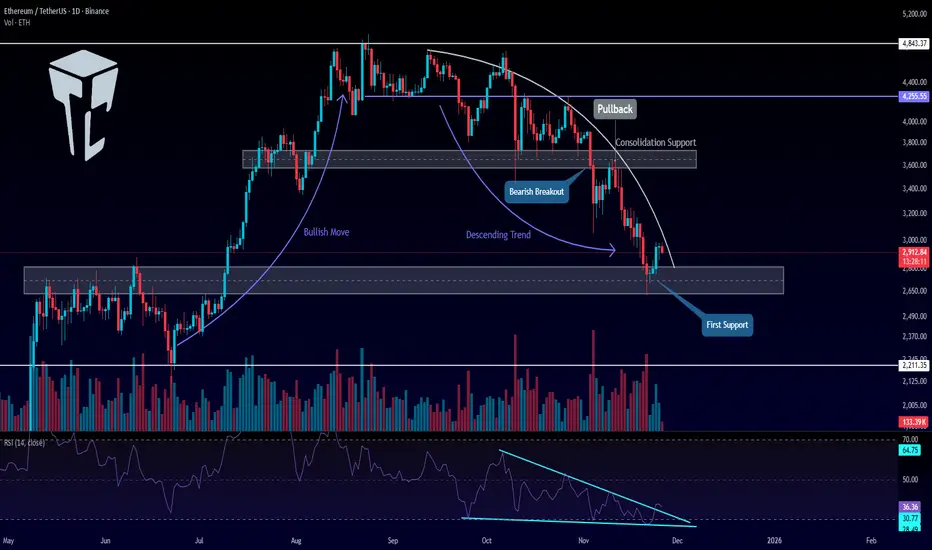
On the daily timeframe, after the upward movement Ethereum made, it reached the 4,843 resistance zone and then entered a consolidation phase.
✅ The bottom of this range was at 3,700, and the middle of the box was at 4,255, which the price reacted to.
🔔 After breaking the lower boundary of the box, the bullish trend Ethereum had came to an end, and a bearish trend with a curved trendline began.
⚖️ After a pullback to the 3,700 zone, a downward move took place, reaching the next support zone at 2,700, and now the price is reacting to the 2,700 zone.
💥 The RSI oscillator formed a descending triangle during this move, which contributed to the increasing bearish momentum in the market.
💡 Now, with the price reaching 2,700, the triangle has broken to the upside, and the bearish momentum has slowed down for now.
🎲 The confirmation of the new bullish momentum will come after breaking the curved trendline and forming a higher high and higher low above the 2,700 level.
📈 The main trigger for Ethereum's bullish trend will be stabilization above 3,700.
⚡️ If the 2,700 level breaks, the next support zone will be at 2,211.
💫 Personally, I’ll try to open a short position on Ethereum if the 2,700 level breaks.
🔼 For a long position, triggers can be found on lower timeframes, but for the main positions, we should wait for the price to form a higher high and higher low.
📝 Final Thoughts
Stay calm, trade wisely, and let's capture the market's best opportunities!
This analysis reflects our opinions and is not financial advice.
Share your thoughts in the comments, and don’t forget to share this analysis with your friends! ❤️
TradeCityPro | Bitcoin Daily Analysis #231👋 Welcome to TradeCity Pro!
Let’s dive into the Bitcoin analysis. The market is currently in an upward correction phase.
⏳ 1-Hour Timeframe
Yesterday, Bitcoin was supported at the 85,770 level and made another upward move.
✨ Currently, the price has reached the 89,000 level and has been rejected from there. This zone is a very strong PRZ (Potential Reversal Zone).
✔️ As long as the price doesn’t break below the 85,770 support, the possibility of breaking the 89,000 resistance still exists. Breaking this level, as mentioned in previous analyses, will be the first sign of a trend reversal for Bitcoin.
📊 The selling volume in the red candles has decreased a bit. Now, if the buying volume increases with the green candles, the likelihood of breaking the resistance increases.
⭐ However, if the price moves downward and breaks the 85,770 support, we can expect Bitcoin to move back toward the 82,214 level.
🧮 Therefore, we can use the break of 85,770 as a trigger for opening a short position.
🎲 For confirmation on higher cycles, the confirmation for a bullish reversal will come after stabilizing above 93,555, and the confirmation for a bearish trend will come after stabilizing below 82,214.
❌ Disclaimer ❌
Trading futures is highly risky and dangerous. If you're not an expert, these triggers may not be suitable for you. You should first learn risk and capital management. You can also use the educational content from this channel.
Finally, these triggers reflect my personal opinions on price action, and the market may move completely against this analysis. So, do your own research before opening any position.

TradeCityPro | XRP Bulls Eyeing Key Support for Surge👋 Welcome to TradeCity Pro!
In this analysis, I want to review the XRP coin, one of the oldest cryptocurrencies, with a $124 billion market cap, currently ranked 4th on CoinMarketCap.
⏳ 4-Hour Timeframe
After the recent market decline, XRP was one of the coins that managed to recover well. It was supported at 1.8733, and with the activation of the 2.0383 trigger, the price made an upward move.
✔️ Currently, the price is at a very important support zone, and as you can see, it is reacting to this level.
💥 The RSI oscillator has moved close to the overbought zone. If it enters this zone, the momentum of this coin will increase significantly, and the price could continue its bullish movement, potentially reaching higher levels.
✨ If the support zone holds, we can open a long position.
For a more accurate trigger, it's better to wait until the price touches this level a few more times and then activate the trigger.
🔔 The next resistance zones for XRP are 2.3404 and 2.5508, which can be used as targets.
The main trigger for confirming the bullish trend on higher cycles will be the break of 2.5508.
🔍 If the price gets rejected from this level and moves back toward 1.8733, we can open a position if volume starts to increase, using a candlestick setup. Otherwise, we can enter with a break of 1.8733.
📝 Final Thoughts
Stay calm, trade wisely, and let's capture the market's best opportunities!
This analysis reflects our opinions and is not financial advice.
Share your thoughts in the comments, and don’t forget to share this analysis with your friends! ❤️

TradeCityPro | Bitcoin Daily Analysis #230👋 Welcome to TradeCity Pro!
Let’s move on to today’s Bitcoin analysis. A new week has finally begun, and Bitcoin may once again start a strong momentum-driven trend.
⏳ 1-Hour Timeframe
Yesterday, Bitcoin continued its corrective upward move and retraced up to the 0.5 Fibonacci level.
✨ This level is extremely important — both in Fibonacci analysis and across many technical styles — and it can determine how the next major price wave forms.
✔️ For now, the price has been rejected from this level and has made a small downward move.
If the bearish movement continues, we can consider opening a short position on Bitcoin.
💥 Breaking 85,209 will be the first confirmation of a bearish trend.
Breaking 82,214 will be the main confirmation that a new downward trend has begun.
📊 If the market continues deeper corrections to the upside, the main resistance zone remains 89,000.
🔔 A stabilization above 89,000 will be the first confirmation of a new bullish trend beginning.
The full confirmation of a bullish reversal will come only after the 93,555 level is broken.
❌ Disclaimer ❌
Trading futures is highly risky and dangerous. If you're not an expert, these triggers may not be suitable for you. You should first learn risk and capital management. You can also use the educational content from this channel.
Finally, these triggers reflect my personal opinions on price action, and the market may move completely against this analysis. So, do your own research before opening any position.

TradeCityPro | BNB Pressure Point: Trendline vs. Market Mood👋 Welcome to TradeCity Pro!
In this analysis, I want to review the BNB coin for you, one of the most popular and well-known cryptocurrency exchanges, whose native token has a $115.97 billion market cap and is currently ranked 5th on CoinMarketCap.
⏳ 4-Hour Timeframe
On the 4-hour timeframe, BNB is in a downtrend, and its latest bearish wave started after breaking below the $900 zone, continuing down to the $808 level.
✨ There is also a curved descending trendline on BNB’s chart, which has now become very steep, and the price has reached this trendline.
⭐ If this trendline breaks, the correction could deepen, allowing the price to move toward higher zones.
But if BNB gets rejected from this trendline, the downward movement will continue.
✔️ The next short trigger we have is the break of the $808 level.
This is a very important support zone, and if it breaks, the price could fall toward the $747 level.
📊 Buying volume has been very low during this corrective phase, which shows the strength of the sellers. Therefore, a rejection from the trendline or a break below $808 can confirm the start of a new bearish wave.
💥 From a momentum perspective, the RSI is also making a small upward correction similar to the price.
The 19.83 level is the key RSI support.
📝 Final Thoughts
Stay calm, trade wisely, and let's capture the market's best opportunities!
This analysis reflects our opinions and is not financial advice.
Share your thoughts in the comments, and don’t forget to share this analysis with your friends! ❤️

TradeCityPro | Bitcoin Daily Analysis #229👋 Welcome to TradeCityPro!
Let’s dive into the Bitcoin analysis. Today, the market has made a deeper upward correction and is moving towards higher resistance levels.
⏳ 1-Hour Timeframe
After the downward move to the 82,214 zone, Bitcoin started a range and correction phase, and yesterday, it ranged between 82,214 and 85,209.
✨ After the price began to correct, a higher low was formed at 83,680, which allowed buyers to show some strength, and now the price has stabilized above 85,209.
✔️ This upward move continued to the 0.382 Fibonacci level, which I consider to be the first resistance level Bitcoin has reacted to.
⭐ If the price starts to drop from here and can stabilize below the 85,209 level, bearish momentum will return to the market, and we can get the first confirmation of a new downward wave.
🧮 The main confirmation for the start of this new wave will come after breaking the 82,214 level. Until then, any short position we open will be an early trigger.
🎲 Overall, Bitcoin has a very large support zone on the weekly timeframe, and this zone is between 75,000 and 90,000, where the price is currently located.
🔭 As long as the price is in this range, all positions are risky. Personally, I will reduce my risk, as traders’ win rates tend to decrease in such range-bound areas.
📊 For long positions, it’s still too early. I will wait until the price stabilizes above 89,604. This will be the first sign of buyer strength. The main confirmation for the bullish trend will come after stabilizing above 93,555.
❌ Disclaimer ❌
Trading futures is highly risky and dangerous. If you're not an expert, these triggers may not be suitable for you. You should first learn risk and capital management. You can also use the educational content from this channel.
Finally, these triggers reflect my personal opinions on price action, and the market may move completely against this analysis. So, do your own research before opening any position.

TradeCityPro | FET: Will It Bounce at Support or Fall Further?👋 Welcome to TradeCityPro!
In this analysis, I want to review the FET coin , one of the crypto projects related to artificial intelligence, with a $635 million market cap, currently ranked 78th on CoinMarketCap.
⏳ 4-Hour Timeframe
On the 4-hour timeframe, this coin had an upward movement and then entered a correction phase, reaching an important PRZ support zone.
💡 The zone the price is currently testing is a very critical support area, which we had already identified in the chart. Additionally, this zone coincides with the golden Fibonacci zone.
✔️ Given the length of time the price has been correcting, we can confirm a trend change sooner and don’t need to wait for the main support at 0.2036 to be broken.
🔔 Currently, the selling volume is increasing, and the price has reached the lower bound of the box between 0.2638 and 0.3306.
🧮 There’s significant bearish momentum entering the market, and it can be said that the only reason some coins like FET are still holding above their support is Bitcoin’s dominance.
⚖️ If the price stabilizes below its support zone, we will confirm the bearish trend and can open a short position. The next support levels are 0.2340 and 0.2036.
💫 However, if the price rises and moves toward the upper bound of the box, breaking 0.3306, we can become optimistic about the coin’s upward movement again.
📝 Final Thoughts
Stay calm, trade wisely, and let's capture the market's best opportunities!
This analysis reflects our opinions and is not financial advice.
Share your thoughts in the comments, and don’t forget to share this analysis with your friends! ❤️

TradeCityPro | Bitcoin Daily Analysis #228👋 Welcome to TradeCity Pro!
Let’s move on to the Bitcoin analysis. After the sharp drop we had throughout the week, the market has finally calmed down today and is moving sideways.
⏳ 1-Hour Timeframe
After the strong downward move earlier this week, the market has made a small correction today.
✔️ This correction came after reaching the 82,214 support level, and as you can see, the buying volume during this correction is extremely low.
✨ This shows that buyers are very weak.
On the other hand, as you can see, the red candles are starting to show increasing volume again, and if this continues, we can open short positions using short triggers from the lower timeframes.
💥 The RSI oscillator bounced from its support yesterday and is now below the 50 level.
A rejection from this zone can introduce new bearish momentum.
🔔 The main short trigger right now is 82,214.
However, this trigger is very risky because it is close to a very strong support zone, and there is a high probability that buyers may attempt to enter the market there.
📈 For long positions, there is currently nothing to discuss, the market needs to form a proper bullish structure first.
Our confirmation for a bullish trend comes only after price stabilizes above 89,000, which is still very far from the current level.
💡 Right now, the price hasn’t even corrected up to the 0.382 retracement of the previous wave.
This alone shows that buyers have not entered the market yet.
So for long setups, we must wait until buyers return, show strength, and take control, and then we follow them.
❌ Disclaimer ❌
Trading futures is highly risky and dangerous. If you're not an expert, these triggers may not be suitable for you. You should first learn risk and capital management. You can also use the educational content from this channel.
Finally, these triggers reflect my personal opinions on price action, and the market may move completely against this analysis. So, do your own research before opening any position.

TradeCityPro | Bitcoin Daily Analysis #227👋 Welcome to TradeCity Pro!
Let’s dive into the Bitcoin analysis. The market is still very bearish and moving down rapidly.
⏳ 1-Hour Timeframe
Yesterday, the market continued its downward movement, and after breaking the 88,825 support, it made a very brief correction before breaking even the 83,333 level.
⭐ The support level we had for the RSI was 21.53. As you can see, RSI reacted to this level, and after its correction, it has now reached this area again.
🧮 From a momentum perspective, the market is highly bearish, and the movement has been very sharp. Volume is fully confirming the downtrend, and I believe after this sharp decline, we could see the start of a correction phase.
💥 We have a very important support zone at 80,000, where the price could move towards and potentially enter a corrective phase. However, in any case, I think the market has made its move, and for the downtrend to remain healthy, a correction is needed.
✅ At the moment, we can’t provide a trigger for a new position since the market has moved so sharply, like a speeding train. It’s better to wait and then hop on once the correction has started.
📊 For long positions, it’s clear that the market is still in a downtrend, and there is no structure supporting a long position. We’ll consider opening a long position only once the trend changes.
❌ Disclaimer ❌
Trading futures is highly risky and dangerous. If you're not an expert, these triggers may not be suitable for you. You should first learn risk and capital management. You can also use the educational content from this channel.
Finally, these triggers reflect my personal opinions on price action, and the market may move completely against this analysis. So, do your own research before opening any position.

TradeCityPro | Bitcoin Daily Analysis #226👋 Welcome to TradeCity Pro!
Let’s dive into today’s Bitcoin analysis. Our new short triggers have activated, and the market is continuing its downward movement.
⏳ 1-Hour Timeframe
After Bitcoin made a fake downward move yesterday, today it formed a lower high below 93,555, and after breaking the 90,489 and 88,825 levels, it is now continuing strongly to the downside.
⭐ A very large amount of selling volume has entered the market, giving full control to the sellers. The downtrend is continuing with strong momentum.
✨ The next support levels are 85,846 and 83,333.If you already have open short positions, you can use these levels for partial profit-taking.
✔️ The RSI oscillator is currently in the oversold zone, around 21.53.Breaking this level could push the bearish move even further.However, if RSI gets supported here, momentum may weaken, and a correction could begin.
💡 If a correction happens, the resistance zones to watch are 88,825 and 90,489.Our main confirmation for a trend reversal will still come after breaking 93,555.
❌ Disclaimer ❌
Trading futures is highly risky and dangerous. If you're not an expert, these triggers may not be suitable for you. You should first learn risk and capital management. You can also use the educational content from this channel.
Finally, these triggers reflect my personal opinions on price action, and the market may move completely against this analysis. So, do your own research before opening any position.

TradeCityPro | Bitcoin Daily Analysis #225👋 Welcome to TradeCity Pro!
Let’s jump into today’s Bitcoin analysis. After the pullback to 93,555, Bitcoin has moved into a ranging phase.
⌛️ 1-Hour Timeframe
Yesterday, after reaching its support zone, Bitcoin made a corrective upward move and pulled back to 93,555.
💡 Right now, after completing that pullback, the price has dropped back down to 90,489 and has shown a reaction to this level.
✔️ As you can see, selling volume has been increasing during this move, and we haven’t seen any significant buying volume enter the market yet.
✨ Today’s trigger for opening a position is the break of 90,489.This is a suitable trigger for a short position, and breaking it could be the start of the next bearish leg.
⭐ If the move toward 90,489 comes with increasing volume, we can even enter earlier using a candle setup, before the full break happens.
📊 For a long position, it’s still too early.We first need to see the price stabilize above 93,555, and only then we can look for long triggers.
❌ Disclaimer ❌
Trading futures is highly risky and dangerous. If you're not an expert, these triggers may not be suitable for you. You should first learn risk and capital management. You can also use the educational content from this channel.
Finally, these triggers reflect my personal opinions on price action, and the market may move completely against this analysis. So, do your own research before opening any position.

TradeCityPro | LDO Support Zone: Is a Trend Reversal Coming?👋 Welcome to TradeCityPro!
In this analysis, I want to review the LDO coin for you, one of the DeFi projects with a $634 million market cap, currently ranked 87th on CoinMarketCap.
⏳ 4-Hour Timeframe
On the 4-hour timeframe, this coin is sitting on a very important support level, which has already been tested twice.
✔️ Overall, a downtrend is visible on the LDO chart, and breaking this support zone could allow the price to continue moving within this bearish structure.
⭐ If this support breaks, we can open a short position.The next support zone the price may head toward is 0.6229.
💥 If the coin gets supported at this level instead, the first long trigger will be the 0.7840 level.A stabilization above this level will be the first sign of bullish momentum returning.
💡 The main trend-reversal triggers are 0.8962 and 1.0209.For spot buying, we can wait for a breakout of these levels.
🛒 However, for spot entries, besides these triggers, I also wait for confirmation from macro indicators such as Others.D and BTC.D.I do not enter based solely on price confirmation.
📝 Final Thoughts
Stay calm, trade wisely, and let's capture the market's best opportunities!
This analysis reflects our opinions and is not financial advice.
Share your thoughts in the comments, and don’t forget to share this analysis with your friends! ❤️

TradeCityPro | Bitcoin Daily Analysis #224👋 Welcome to TradeCityPro!
Let’s dive into the Bitcoin analysis. The market has continued its downward movement and has reached its next support level.
⏳ 1-Hour Timeframe
Yesterday, after breaking the 93,965 zone, Bitcoin started a downward move, which extended to 89,603.
⚡️ The main support zone for the price, in my opinion, is 88,262, which the price hasn't yet reached, and it was supported at 89,603.
✨ Currently, the price is making a bullish correction and has retraced to around the 0.382 Fibonacci level.
✔️ The 91,608 zone is very important, and if the price can stabilize above it, the likelihood of forming a V-pattern increases significantly.
🔔 If the price moves sharply upwards and stabilizes above 95,766, we will get confirmation of the activation of this pattern, but currently, the price is still far from it.
📊 For today’s long position, we can consider entering if the 89,603 level breaks, but with very low risk, as the price has already made its move, and I believe we are in a correction phase now.
🎲 If the upward move continues, I think we could open a long position tomorrow. Otherwise, the next trigger is 95,766.
❌ Disclaimer ❌
Trading futures is highly risky and dangerous. If you're not an expert, these triggers may not be suitable for you. You should first learn risk and capital management. You can also use the educational content from this channel.
Finally, these triggers reflect my personal opinions on price action, and the market may move completely against this analysis. So, do your own research before opening any position.

TradeCityPro | CRV in a Key Zone: Watch for Breakouts or Drops👋 Welcome to TradeCity Pro!
Let’s dive into the CRV coin analysis. It's one of the popular DeFi projects, with a market cap of $608 million, currently ranked 89th on CoinMarketCap.
⏳ 4-Hour Timeframe
On the 4-hour timeframe, this coin is currently sitting on a very important support level and has just bounced up from it.
✔️ In this recent bearish leg, as Bitcoin’s dominance dropped, most altcoins declined less than Bitcoin.
One of these altcoins is CRV, which, as you can see, hasn’t yet lost its support zone.
🔽 For a short position, we can enter if the support level breaks. For an early entry, considering the bearish trend of this coin, we can use momentum triggers like candlestick setups.
🧩 On the other hand, if the price can stabilize above 0.4496, it will be the first sign of a trend reversal to the upside, and we can use this trigger to open a long position.
💡 Personally, I prefer to wait until the price forms a higher high and higher low above 0.4496 before entering. The main confirmation of the trend change will come after breaking 0.5240.
📝 Final Thoughts
Stay calm, trade wisely, and let's capture the market's best opportunities!
This analysis reflects our opinions and is not financial advice.
Share your thoughts in the comments, and don’t forget to share this analysis with your friends! ❤️

TradeCityPro | XRP Shows Potential After Support Bounce👋 Welcome to TradeCity Pro!
Let’s dive into the XRP coin analysis. It’s one of the oldest crypto projects, with a market cap of $136.74 billion, currently ranked 4th on CoinMarketCap.
⏳ 4-Hour Timeframe
On the 4-hour timeframe, this coin is sitting on a very important support level at 2.1843.
✔️ This level can also be viewed as a support zone. Currently, the price has shown a reaction to this zone and is moving upwards with very low volume.
⚡️ The first resistance zone for XRP is at 2.3404. Considering the low buying volume in the recent candles, the probability of a continued bullish move is higher unless the buying volume increases.
📊 If the buying volume starts to increase, we can use the 2.3404 level as a trigger for a long position. The next significant resistance levels for this coin are 2.5508 and 2.6718.
🔔 However, if the volume remains this low, a break below the 2.1843 support could trigger a short position. The next support zone for XRP is at 2.0013.
🛒 For spot purchases or confirmation of a new bullish trend, the trigger we currently have is 2.6718. Personally, for spot buying, I will track this coin after the 2.6718 level.
📝 Final Thoughts
Stay calm, trade wisely, and let's capture the market's best opportunities!
This analysis reflects our opinions and is not financial advice.
Share your thoughts in the comments, and don’t forget to share this analysis with your friends! ❤️

TradeCityPro | Bitcoin Daily Analysis #223👋 Welcome to TradeCity Pro!
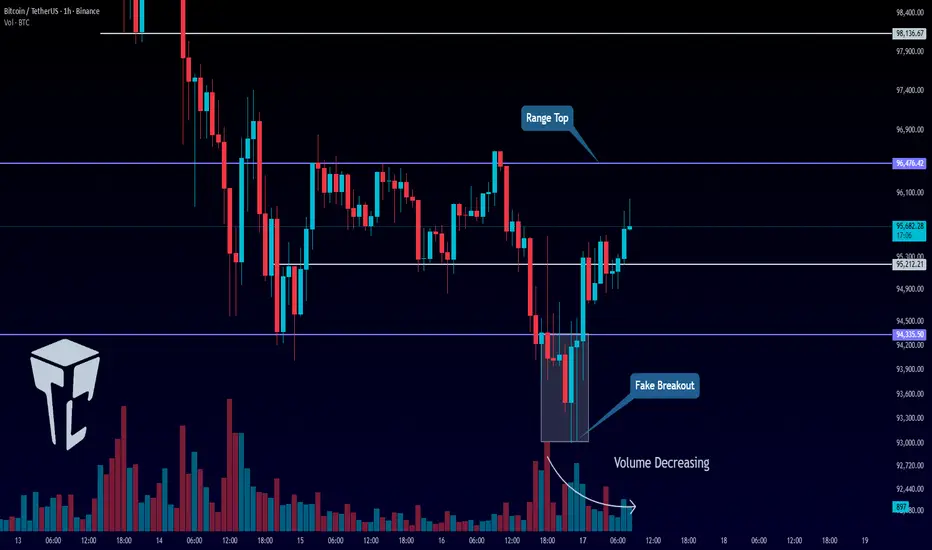
Let’s dive into the Bitcoin analysis. Yesterday, Bitcoin made a fake downward move and is now back in its range box.
⏳ 1-Hour Timeframe
Yesterday, the short triggers we had at 95,212 and 94,335 were activated, and the price moved slightly downward. However, this bearish move turned out to be a fakeout, and the price started moving upwards again.
✅ Currently, the price has moved above 95,212 and managed to stabilize above this level. The next resistance zone for Bitcoin is at 96,476.
⚡️ The 96,476 zone was faked yesterday, and after a candle closed above it, the price moved downward. Now, we need to wait for the price’s next reaction to this level to refine the exact breakout point.
✨ After this encounter, we can open a risky long position if the level breaks on the next attempt. The next target above this level is 98,136.
📊 For a short position, since the price faked the bottom of the range, the chart is a bit messy. I personally prefer to wait for the price to establish more structure and for a new trigger to form. We can then open a new position upon the breakout of the next trigger.
💼 For previously opened short positions, we can move the stop loss above the 96,476 level.
❌ Disclaimer ❌
Trading futures is highly risky and dangerous. If you're not an expert, these triggers may not be suitable for you. You should first learn risk and capital management. You can also use the educational content from this channel.
Finally, these triggers reflect my personal opinions on price action, and the market may move completely against this analysis. So, do your own research before opening any position.
TradeCityPro | Bitcoin Daily Analysis #222👋 Welcome to TradeCity Pro!
Let’s dive into the Bitcoin analysis. Today is Sunday, the last day of the week. Let’s go over the triggers and scenarios for the upcoming week.
⏳ 1-Hour Timeframe
On the 1-hour timeframe, after a bearish leg, Bitcoin has now reached the 94,335 level and formed a range box between 94,335 and 96,476.
📊 Volume has naturally decreased over the past few days due to the weekend and the price correction.
🔭 Today, the market could make a move during the New York session, and we can better assess this by looking at volume trends.
🧮 If, near the New York session or during it, volume starts to increase, we can expect the market to make a move.
📉 For a short position:
The first trigger is at 95,212. The main trigger for the start of a new bearish wave is 94,335.
⚖️ If you already have an open position and your account is in profit, it might be worth taking the risk and entering earlier with the break of 95,212. However, if your account is at a loss, I recommend waiting for the 94,335 trigger to activate.
🚀 For a long position:
It’s better to wait for the current bearish momentum to subside and for the market to become bullish. But, if you want to make an early entry, the 96,476 trigger might be a decent option.
💡 Personally, I will wait for the price to form a higher high and higher low above 96,476 before pursuing a long position.
❌ Disclaimer ❌
Trading futures is highly risky and dangerous. If you're not an expert, these triggers may not be suitable for you. You should first learn risk and capital management. You can also use the educational content from this channel.
Finally, these triggers reflect my personal opinions on price action, and the market may move completely against this analysis. So, do your own research before opening any position.

TradeCityPro | Bitcoin Daily Analysis #221👋 Welcome to TradeCity Pro!
Yesterday, Bitcoin’s bearish movement continued once again, and the price has now reached a very important support level.
⏳ 4-Hour Timeframe
On the 4-hour timeframe, Bitcoin is in its second bearish wave. After correcting up to 10,6644, it started a fresh downward move.
✔️ Yesterday, the price interacted with the 99,827 zone, which overlaps with the 0.5 Fibonacci level. After this zone was broken, the bearish move extended down to 94,355.
⚡️ The 94,355 level overlaps with the 0.786 Fibonacci retracement, and so far, the price has shown a reaction to it and is currently ranging near this support.
💫 If the 94,355 level breaks, we will have confirmation of a continued downtrend, and we can open a short position on the breakout.
💡 For previously opened short positions, you can move your stop-loss above 97,021, and if the price stabilizes above that level, you can take profit and secure your gains.
📊 For long positions, it’s better to wait until bullish momentum returns to the market.
❌ Disclaimer ❌
Trading futures is highly risky and dangerous. If you're not an expert, these triggers may not be suitable for you. You should first learn risk and capital management. You can also use the educational content from this channel.
Finally, these triggers reflect my personal opinions on price action, and the market may move completely against this analysis. So, do your own research before opening any position.
