TradeCityPro | Bitcoin Daily Analysis #195👋 Welcome to TradeCity Pro!
Let’s move on to Bitcoin analysis. Yesterday, price started an upward move, so let’s see what triggers we have today.
⌛️ 1-Hour Timeframe
Yesterday, price found support at our key zone and also activated the 112,420 risk trigger we had identified.
✨ If you opened a position, it’s not a bad time to take profits, since this was a risky setup, and such positions should be managed quickly.
🧮 Currently, a resistance high has formed around 115,698. If this level breaks, price could continue its upward movement.
💫 As long as price stays above 112,420, this trigger remains active and can be used to open positions.
✔️ For shorts, I personally won’t be taking any until price breaks below 107,000 and stabilizes under that zone.
❌ Disclaimer ❌
Trading futures is highly risky and dangerous. If you're not an expert, these triggers may not be suitable for you. You should first learn risk and capital management. You can also use the educational content from this channel.
Finally, these triggers reflect my personal opinions on price action, and the market may move completely against this analysis. So, do your own research before opening any position.
TCP

TradeCityPro | BNB Surges Beyond All-Time Highs👋 Welcome to TradeCity Pro!
In this analysis, I’m going to review BNB, the official token of Binance Exchange, which currently holds the #3 spot on CoinMarketCap with a market capitalization of $188 billion.
⌛️ 4-Hour Timeframe
On the 4-hour chart, after the broad market downturn, this coin managed to recover very well. Supported from the 1100 zone, BNB began to move upward again.
📊 A risky long trigger appeared on the lower timeframes around 1143, and if you entered based on that trigger, your position should now be sitting in good profit.
🎲 BNB has now broken through its all-time high after surpassing 1317, and the next corrective wave could potentially begin from here.
✔️ So far, the volume and momentum have both been strong, and there are no signs of weakness in the trend yet—meaning the upward movement can still continue.
✨ However, if this move turns out to be a fake breakout and the price stabilizes below 1317, BNB could enter a longer corrective phase. In that case, with confirmation of the fake breakout below 1317, a short position could also be considered.
📝 Final Thoughts
Stay calm, trade wisely, and let's capture the market's best opportunities!
This analysis reflects our opinions and is not financial advice.
Share your thoughts in the comments, and don’t forget to share this analysis with your friends! ❤️

TradeCityPro | Bitcoin Daily Analysis #194👋 Welcome to TradeCity Pro!
Let’s analyze Bitcoin today, the market has calmed down a bit, and we can perform some analysis.
⏳ 1-Hour Timeframe
In the 1-hour timeframe, Bitcoin has reached a support level around $109,000 and has shown a reaction to this level.
⭐ After the heavy drop that occurred two days ago, the open interest and market volume have decreased significantly, which clearly indicates that market participants are currently indecisive.
✨ Yesterday, the price reacted to the support zone on Bitcoin, and a significant resistance was created around $112,420, which it has now reached again.
💥 The RSI oscillator has finally moved out of the Oversell zone, and it’s currently below the 50 level.
🧮 Although there’s still fear and a bearish momentum in the market, breaking the $112,420 resistance could be a very risky long trigger.
✔️ Personally, I’m waiting and observing. However, for those who like to open positions every day, breaking this resistance is the only long trigger I can provide.
💡 For a short position, we could enter after the price breaks below the level. I’m passing on this position for now and will wait for a confirmation to search for a short trigger after the price stabilizes below this zone.
❌ Disclaimer ❌
Trading futures is highly risky and dangerous. If you're not an expert, these triggers may not be suitable for you. You should first learn risk and capital management. You can also use the educational content from this channel.
Finally, these triggers reflect my personal opinions on price action, and the market may move completely against this analysis. So, do your own research before opening any position.

TradeCityPro | AVAXUSDT Further Decline or Time to Rise?👋 Welcome to TradeCityPro Channel!
✨ Let’s move on to Avalanche (AVAX) one of the older coins in the market, mostly active in the DeFi ecosystem with its own network and solid utility. It’s often considered a bull-run project due to its long-term relevance and use cases.
🌐 Overview of Bitcoin
Before we begin, let me remind you that we’ve moved the Bitcoin analysis section to a separate daily report at your request,
so we can go into more detail about Bitcoin’s condition, price action, and dominance:
🕧 In the 4-hour timeframe, after the recent market crash, AVAX is trying to build a new structure and stabilize its price action.
🟢 Long Setup:
It’s still too early to go long, but AVAX has shown a partial recovery compared to other coins, and its drop hasn’t been as deep.
For a long position, we should either range here for a while and enter after a confirmed breakout above 23.04,
Or wait for a higher high and higher low formation to confirm a bullish structure before entering.
🔴 Short Setup:
The short scenario is clear if 20.57 breaks with volume, it would signal bearish continuation, and opening a short position would be reasonable.
📝 Final Thoughts
Stay calm, trade wisely, and let's capture the market's best opportunities!
This analysis reflects our opinions and is not financial advice.
Share your thoughts in the comments, and don’t forget to share this analysis with your friends! ❤️
TradeCityPro | SOL: Market Calms After Sharp Move & RSI Support👋 Welcome to TradeCityPro!
Let’s analyze SOL, one of the most popular Ethereum killers with a market cap of $99.9 billion, currently ranking 6th on CoinMarketCap.
⏳ 4-Hour Timeframe
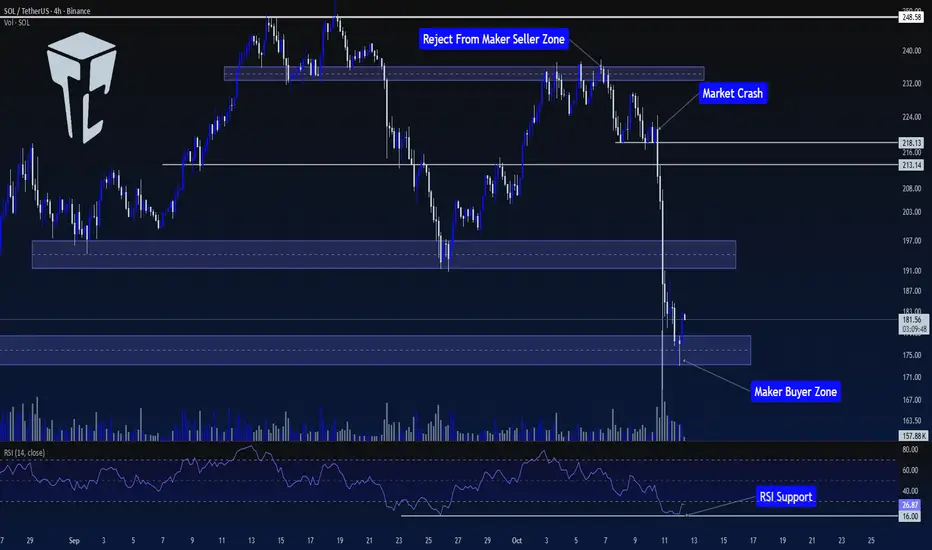
In the previous analysis, we had a Maker Buyer zone around $235. In that analysis, I mentioned that breaking this zone would be an early trigger for breaking $248.58.
🔍 However, the price never managed to sustain above this level, and after getting rejected from this zone, the price entered a corrective phase, forming a support at $218.13.
📊 After the price bounced from $218.13 for the first time, it failed to set a new high in line with previous highs and instead formed a lower high. The price returned to $218.13 again.
✔️ With the breakout of this level, coinciding with news between China and the U.S., the price started a sharp downward move, breaking through the $213.14 support.
✨ Over the course of 2-3 candles, SOL made a sharp move towards the first Maker Buyer zone, breaking it and reaching the second Maker Buyer zone.
💫 Naturally, there was a significant increase in selling volume during this move, and RSI dropped to 16, where it found support.
🧩 Currently, the market seems to have calmed down, with RSI still in the Oversell zone, but volatility has significantly decreased.
💡 Although the market has calmed, I believe the price needs to build a more structured setup before finding valid triggers, and the market conditions are not ideal for opening positions right now.
💥 So, for now, I won’t provide any triggers on this coin and will wait for more structure to form before making a better decision to open a position.
📝 Final Thoughts
Stay calm, trade wisely, and let's capture the market's best opportunities!
This analysis reflects our opinions and is not financial advice.
Share your thoughts in the comments, and don’t forget to share this analysis with your friends! ❤️
YTHUSDT Analysis – The Biggest Market Crash Yet!👋 Welcome to TradeCityPro Channel!
🌐 Overview of Bitcoin
Before we begin, let me remind you that we’ve moved the Bitcoin analysis section to a separate daily report at your request, so we can go into more detail about Bitcoin’s condition, price action, and dominance:
🌙 Last night, the crypto market witnessed a massive liquidation of nearly $19 billion, marking one of the biggest crashes in the history of digital assets.
📈 At this point, trading or buying in these zones isn’t logical it’s better to stay out of the market for a few days, watch the price action, and let volatility settle before making any moves.
🔥 Weekly Time Frame
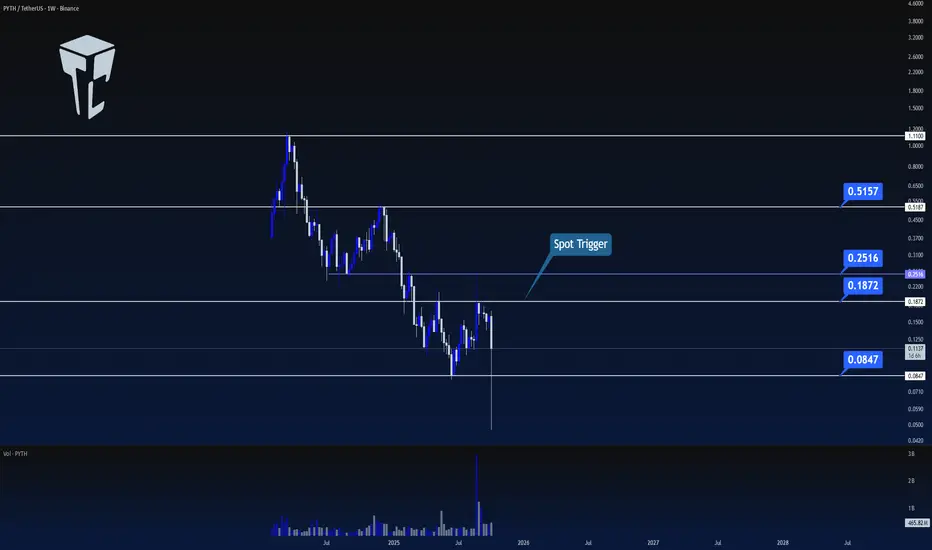
After a 92% drop from its all-time high, PYTH is currently consolidating below the resistance level at $0.1851.
This area is crucial it’s acting as both a psychological and technical barrier where the next trend direction will be defined.
🟢 Spot & Long Entry Setup
⛏ If this weekly candle turns green and we see confirmation, that could become one of the best bullish triggers for accumulation.
However, the main confirmation will be the breakout above $0.1851, which would give us a solid long entry setup.
✍️ Personally, I’m planning to open a long futures position once $0.1851 breaks, and if we later break above $0.2532, I’ll use my futures profits to buy PYTH in spot and hold for a potential longer-term recovery.
📝 Final Thoughts
Stay calm, trade wisely, and let's capture the market's best opportunities!
This analysis reflects our opinions and is not financial advice.
Share your thoughts in the comments, and don’t forget to share this analysis with your friends! ❤️
TradeCityPro | Bitcoin Daily Analysis #193👋 Welcome to TradeCity Pro!
Let’s analyze Bitcoin, yesterday, a phenomenon called a Flash Crash occurred, and the market experienced a massive drop. Let’s review what happened and where the market stands now.
⏳ 4-Hour Timeframe
Before diving into the chart, let’s first understand what happened in the broader market.
🔍 Yesterday, the U.S. restricted the sale of certain computer chips to China,
and in response, China halted exports of five rare elements to the U.S.
📰 Then, the U.S. reimposed heavy tariffs on China, and China raised duties on American ships.
✨ These escalating tensions severely impacted global markets — and we witnessed the largest Flash Crash in Bitcoin’s history.
📉 A total of $19 billion worth of positions were liquidated, marking the highest figure ever recorded in crypto history.
To put that into perspective, during the COVID crash, only about $3 billion was liquidated — a massive difference.
🔔 Interestingly, Bitcoin dropped less compared to most altcoins and managed to recover partially.
However, altcoins like TON, AVAX, ARB, and SUI (each with their own networks) saw brutal crashes, many with wicks of 60–70% downward.
📊 Now, looking at the chart, yesterday, Bitcoin was ranging above the $120,835 zone.
🧮 Once the geopolitical tension began, the price started a strong downward move, breaking below its key support.
🔽 After two large red candles and a close below support, the third candle formed a 12% wick, dropping as low as $102,000.
✔️ Following that, the price quickly recovered and is now consolidating above the $109,000 support zone.
💡 At the moment, in such a highly volatile environment, finding valid triggers and opening new positions isn’t ideal.
🔑 The price action has been driven mostly by news and panic, so it’s best to wait until the market stabilizes and the effects of these developments fade away.
❌ Disclaimer ❌
Trading futures is highly risky and dangerous. If you're not an expert, these triggers may not be suitable for you. You should first learn risk and capital management. You can also use the educational content from this channel.
Finally, these triggers reflect my personal opinions on price action, and the market may move completely against this analysis. So, do your own research before opening any position.

TradeCityPro | ENA: Market Shake-Off and Support Rebuild Zone👋 Welcome to TradeCity Pro!
In this analysis, I’ll review ENA, one of the DeFi projects that currently holds a market cap of $3.02 billion, ranking 36th on CoinMarketCap.
📅 Daily Timeframe
First, let’s take a look at the market as a whole — yesterday, some extremely unusual events occurred, which I’ll explain in detail in Bitcoin’s analysis.
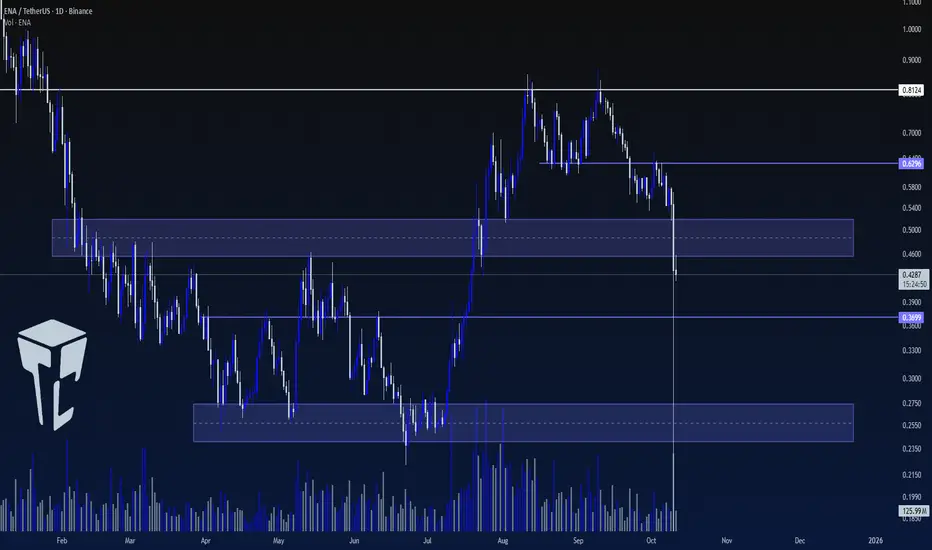
✨ For now, the result of these events has been a sharp market decline, which has also affected this coin. ENA has now stabilized below the $0.5 support zone and printed a very long shadow to much lower levels.
🔍 Currently, the price is far below its last major high at $0.8124 and has formed a lower high at $0.6296.
✔️ There was a support zone around $0.5, but since the price has closed below it, the next key support lies at $0.3699.
📊 The final strong support zone is around $0.25, which is considered ENA’s main support level.
💥 For now, it’s better to stay on the sidelines and wait for the market to build a new structure. The recent move was highly emotional and volatile, making it difficult to accurately interpret the market’s behavior at the moment.
📝 Final Thoughts
Stay calm, trade wisely, and let's capture the market's best opportunities!
This analysis reflects our opinions and is not financial advice.
Share your thoughts in the comments, and don’t forget to share this analysis with your friends! ❤️
TradeCityPro | NEARUSDT Ready for a Spot Buy!👋 Welcome to TradeCityPro Channel!
Let’s take a look at NEAR, which is currently moving nicely within a strong daily box, and it seems like a breakout could happen any moment!
🌐 Overview of Bitcoin
Before we begin, let me remind you that we’ve moved the Bitcoin analysis section to a separate daily report at your request, so we can go into more detail about Bitcoin’s condition, price action, and dominance:
📆 Daily Time Frame
Keep in mind that weekly and daily boxes in crypto charts are very important, because the breakout from these zones usually defines the start of a major trend.
Typically, the target range after a breakout is about the same size as the box itself for example, if the box is 10%, we might expect a similar 10% move after the breakout.
Currently, in the daily time frame, NEAR is moving inside a large box between $1.891 and $3.172, while forming higher lows, which is a bullish sign.
Recently, it also found support at the box midline, which is another strong signal of buyer activity, and the price is following a parabolic curve pattern, showing building momentum.
🚀 Spot & Long Position Setup
If NEAR breaks above $3.172, that’s our main trigger to enter a spot buy and even open a long futures position this breakout could mark the start of a strong bullish leg.
🔻 Short Position Setup
However, if the parabolic curve breaks and the price forms a lower high, then a break below $2.616 in lower time frames could trigger a short position opportunity, signaling a potential pullback phase.
📝 Final Thoughts
Stay calm, trade wisely, and let's capture the market's best opportunities!
This analysis reflects our opinions and is not financial advice.
Share your thoughts in the comments, and don’t forget to share this analysis with your friends! ❤️

TradeCityPro | Bitcoin Daily Analysis #192👋 Welcome to TradeCity Pro!
Let's dive into Bitcoin analysis. Today, Bitcoin is still in a consolidation and range-bound phase. Let’s take a look at the current market conditions.
⏳ 1-Hour Timeframe
In yesterday’s analysis, Bitcoin was in the process of breaking the $120,835 level. I mentioned that I wasn't opening any short positions yet, but a rejection of this downward movement could be a good sign for a potential upward move.
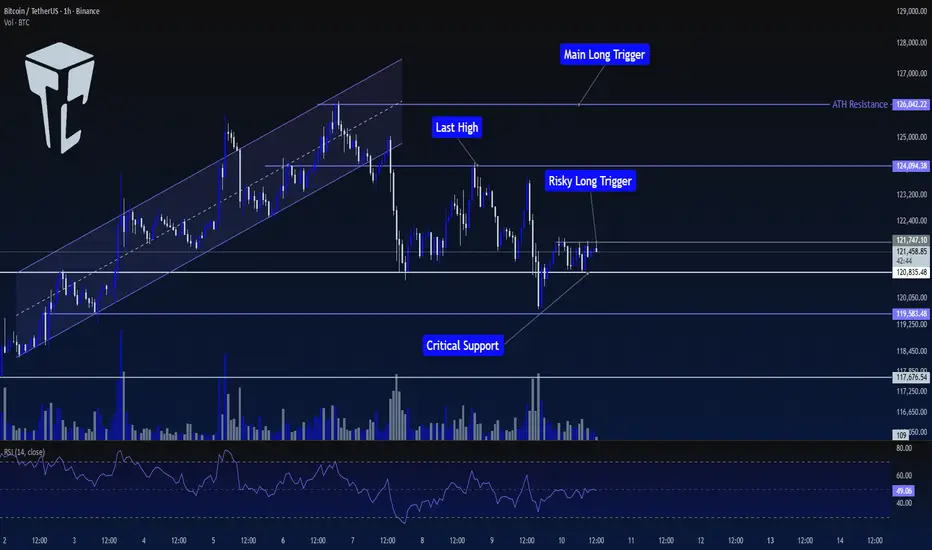
⭐ This scenario played out, and the price has now moved back above $120,835, which gives us an opportunity to look for long triggers.
✔️ One trigger that has formed is $121,747, which can be used as a risky trigger for a long position.
📊 Market volume has decreased slightly, so it’s better to wait for an increase in volume when this level is broken, as that would raise the likelihood of an upward move.
📈 The next reliable long triggers we have are $124,094 and $126,042. These triggers are more reliable for a position, but they are currently farther from the price, so the chance of them activating today is lower.
💥 For short positions, I'm still not focusing on them and prefer to focus on long positions. Therefore, I currently don’t have any short triggers to provide.
❌ Disclaimer ❌
Trading futures is highly risky and dangerous. If you're not an expert, these triggers may not be suitable for you. You should first learn risk and capital management. You can also use the educational content from this channel.
Finally, these triggers reflect my personal opinions on price action, and the market may move completely against this analysis. So, do your own research before opening any position.
TradeCityPro | NEAR: Breakout Opportunity and Potential Uptrend👋 Welcome to TradeCity Pro!
In this analysis, I’ll review NEAR, one of the Layer 1 and AI crypto projects, with a market cap of $3.9 billion, currently ranked 35th on CoinMarketCap.
⏳ 4-Hour Timeframe
This coin is showing an upward trend against Bitcoin and is currently in a very important resistance zone.
✨ Since being supported at the $2.589 level, the price has reacted multiple times to this zone, and it has formed a higher low at $2.832.
📊 At present, the price is engaged with a supply zone, which it has encountered several times, and is now reaching it again with increased buying volume.
🎲 Breaking this resistance zone will initiate a new upward move for this coin. The main trigger for confirming this move is a break at $3.211.
✔️ We can use the $3.211 break as a trigger for a long position on this coin. Additionally, if the RSI enters Overbuy, the upward movement could become much sharper and more volatile.
📝 Final Thoughts
Stay calm, trade wisely, and let's capture the market's best opportunities!
This analysis reflects our opinions and is not financial advice.
Share your thoughts in the comments, and don’t forget to share this analysis with your friends! ❤️

TradeCityPro | ATOMUSDT Ready for a Sharp Drop!👋 Welcome to TradeCityPro Channel!
Let’s analyze ATOM (Cosmos) — one of the older and more established coins in the market. Personally, I’ve been holding and staking this one for quite a while.
🌐 Overview of Bitcoin
Before we begin, let me remind you that we’ve moved the Bitcoin analysis section to a separate daily report at your request, so we can go into more detail about Bitcoin’s condition, price action, and dominance:
📊 Higher Time Frames
On the higher time frames, ATOM has been ranging for a long period of time and interestingly, it has even formed a smaller range inside its main range.
Currently, it’s oscillating near the bottom support of that larger range, showing weakness.
🕓 4H Time Frame
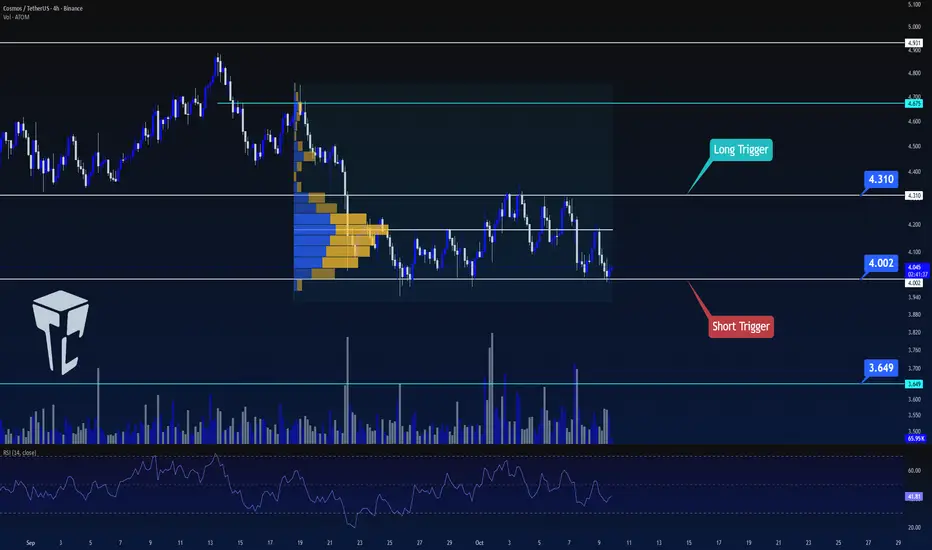
In the 4-hour chart, the price remains stuck inside a range between $4.002 and $4.310.
However, this time it has been rejected from the midline, which increases the likelihood of losing the lower support.
📉 Short Position Setup
If the price breaks below $4.002 with increasing volume and momentum, opening a short position would be completely logical and I’ll personally be taking that short setup as well.
📈 Long Position Setup
For a long position, patience is key.
Other coins like MNT, HYPE, and AVAX currently show stronger bullish potential, but if ATOM breaks above $4.310 and starts forming higher highs and higher lows, we can then begin to shift our bias to bullish.
📝 Final Thoughts
Stay calm, trade wisely, and let's capture the market's best opportunities!
This analysis reflects our opinions and is not financial advice.
Share your thoughts in the comments, and don’t forget to share this analysis with your friends! ❤️
TradeCityPro | Bitcoin Daily Analysis #191👋 Welcome to TradeCity Pro!
Let’s get into Bitcoin analysis. The market is still in a ranging phase, so let’s take a look at today’s triggers together.
⌛️ 1-Hour Timeframe
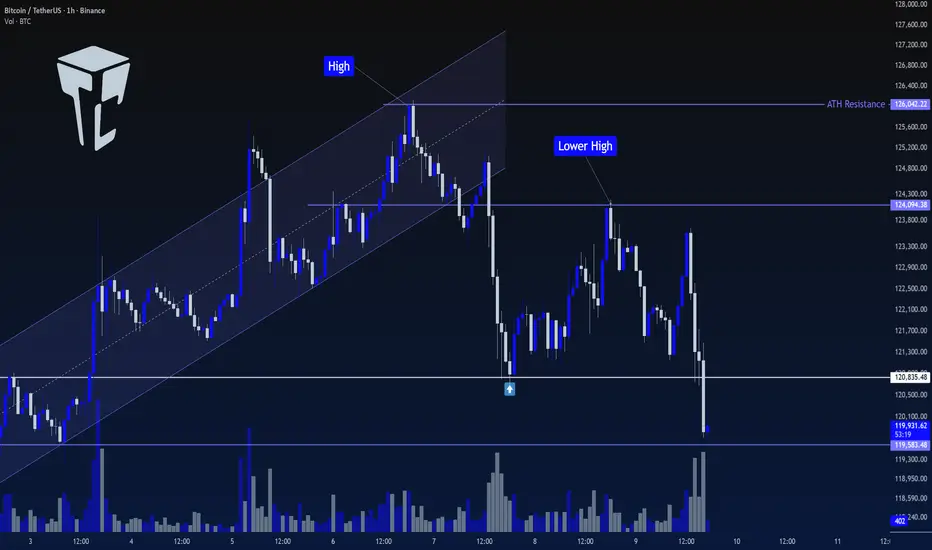
In this timeframe, Bitcoin is still consolidating and has formed a new range high around 124,094.
✔️ Right now, the price is near the bottom of the range box it has created and is on the verge of breaking below it.
✨ If the bottom of the box breaks, price could move toward lower levels.
📊 If selling volume continues to increase, the downward move could extend further, and Bitcoin may correct to even deeper zones.
🎲 However, if this move turns out to be a fake breakdown, and we see reversal structures such as a V-pattern, we could look for a long trigger.
🔑 I still don’t see Bitcoin as being in a downtrend. In my view, every correction the market makes is still healthy and supports the continuation of the broader bullish structure, helping maintain the strength of upcoming legs.
⭐ For now, since momentum has turned bearish on the lower cycles, I don’t have any new triggers to give based on my strategy. In this phase of the market, I prefer to wait until price builds more structure.
❌ Disclaimer ❌
Trading futures is highly risky and dangerous. If you're not an expert, these triggers may not be suitable for you. You should first learn risk and capital management. You can also use the educational content from this channel.
Finally, these triggers reflect my personal opinions on price action, and the market may move completely against this analysis. So, do your own research before opening any position.
TradeCityPro | UNI: Key Levels and Bullish Continuation Setup👋 Welcome to TradeCity Pro!
In this analysis, I’m going to review UNI, one of the most popular DEX projects within the Ethereum ecosystem, with a market cap of $4.93 billion, ranking 28th on CoinMarketCap.
📅 Daily Timeframe
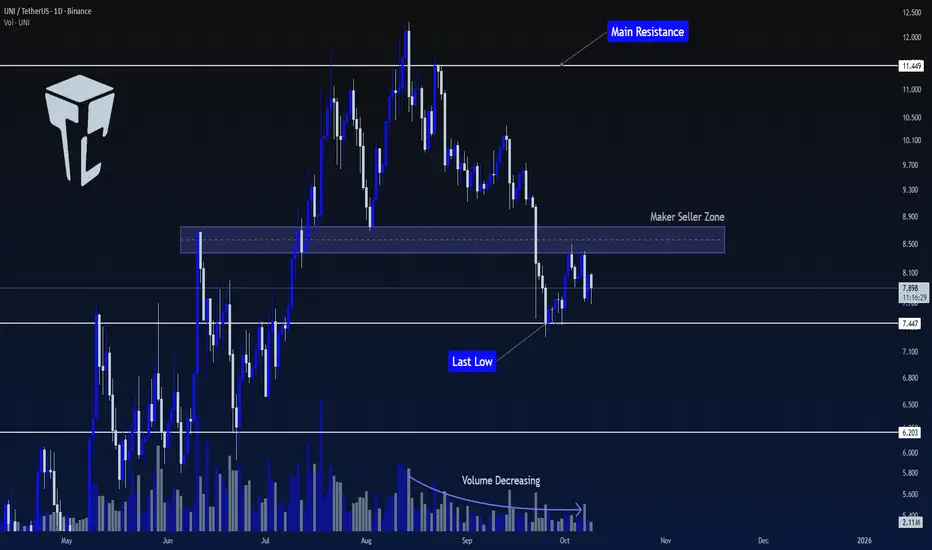
This coin has shown a strong upward move reaching 11.449 and then started a correction. After the failure at this level, a downward move began.
🧩 An important support zone around $8.5 has formed, which after breaking, is now acting as resistance.
✅ During this downward movement, the volume has been decreasing. Despite having two down legs so far, it can be said that the overall trend for this coin is still bullish.
📊 For a long position, the first trigger we have is the break of the Maker Seller level. Breaking this level will remove a lot of selling pressure, which could cause a sharp upward move in price.
🛒 The spot trigger for UNI is at 11.449. I recommend opening a long position after breaking the level, and using the profits from that position to buy this coin when the spot trigger is activated.
💥 For a short position, the trigger is 7.447. If the price ranges a bit longer in this area and then breaks the low, it would make a great position. However, if the price breaks the level right now, it would be a risky trigger.
📝 Final Thoughts
Stay calm, trade wisely, and let's capture the market's best opportunities!
This analysis reflects our opinions and is not financial advice.
Share your thoughts in the comments, and don’t forget to share this analysis with your friends! ❤️
TradeCityPro | LTCUSDT The Best Trade Setup of the Week!👋 Welcome to TradeCityPro Channel!
Let’s move on to the analysis of the market veteran — Litecoin (LTC) — one of the oldest coins in the crypto market, which right now looks like it could offer a great trading opportunity.
🌐 Overview of Bitcoin
Before starting the analysis, let me remind you that we’ve moved the Bitcoin analysis section to a separate daily report based on your requests, so we can go into more detail about Bitcoin’s condition, price action, and dominance:
🕓 4H Time Frame
After forming higher lows inside the $101.87–$107.14 accumulation box, Litecoin finally broke through resistance and experienced a sharp upward move.
Then, after reaching the $122.74 resistance, the price got rejected and is currently testing the $115.67 support where it might consolidate for a while.
🚀 Long Position Setup:
If the price breaks the $122.74 trigger, we can easily open a long position.
In general, as long as the price stays above $115.67, long positions remain valid.
🔻 Short Position Setup:
For a short position, we first need to see a lower high form within the current range and some signs of seller pressure.
Only then, with a confirmed breakdown below $115.67, could we consider opening a risky short position.
📝 Final Thoughts
Stay calm, trade wisely, and let's capture the market's best opportunities!
This analysis reflects our opinions and is not financial advice.
Share your thoughts in the comments, and don’t forget to share this analysis with your friends! ❤️

TradeCityPro | Bitcoin Daily Analysis #190👋 Welcome to TradeCity Pro!
Let’s dive into today’s Bitcoin analysis. The market, after experiencing a decline, is now ready to resume its primary bullish trend.
⏳ 1-Hour Timeframe
Yesterday, after Bitcoin confirmed a break below the channel, it retested the channel and activated the trigger at 123493, leading to a brief bearish movement.
📊 The first support zone was 122574, but the price didn't react to it, resulting in a break below. The next key support zone was 120835, where the price reacted and formed a low.
✨ After the price found support at 120835, a peak formed at 122084, creating a compression between 120835 and 122084.
📈 Currently, after breaking above the compression range, a bullish movement has started, and the price has reached back above 123491.
⚡️ The good thing about the correction to 120835 is that many long positions that hadn’t taken profit were now closed, reducing selling pressure in the market. This provides Bitcoin a chance to continue its bullish trend with a more structured approach.
🚀 However, if the price fails to break the previous high of 126042, a lower high would form, which is a sign of weakness in the bullish trend.
🎲 If that happens, and if the price stabilizes below 120835, we’ll get confirmation of a bearish shift in this timeframe. But for now, this hasn’t happened, and the market momentum remains bullish.
🔍 For a new position, if you haven’t opened a position after breaking 122084, there is no valid trigger at the moment, and we should wait for the market to create a proper structure for entry. Otherwise, the only trigger we have right now is breaking 126042.
🔽 For a short position, I am waiting for the trend change scenario to unfold before considering any short triggers.
❌ Disclaimer ❌
Trading futures is highly risky and dangerous. If you're not an expert, these triggers may not be suitable for you. You should first learn risk and capital management. You can also use the educational content from this channel.
Finally, these triggers reflect my personal opinions on price action, and the market may move completely against this analysis. So, do your own research before opening any position.

TradeCityPro | AVAX: Testing Key Support and Resistance Zones👋 Welcome to TradeCity Pro!
In this analysis, I will review AVAX, one of the Layer 1 and RWA coins with a market cap of $11.98 billion, ranked 16th on CoinMarketCap.
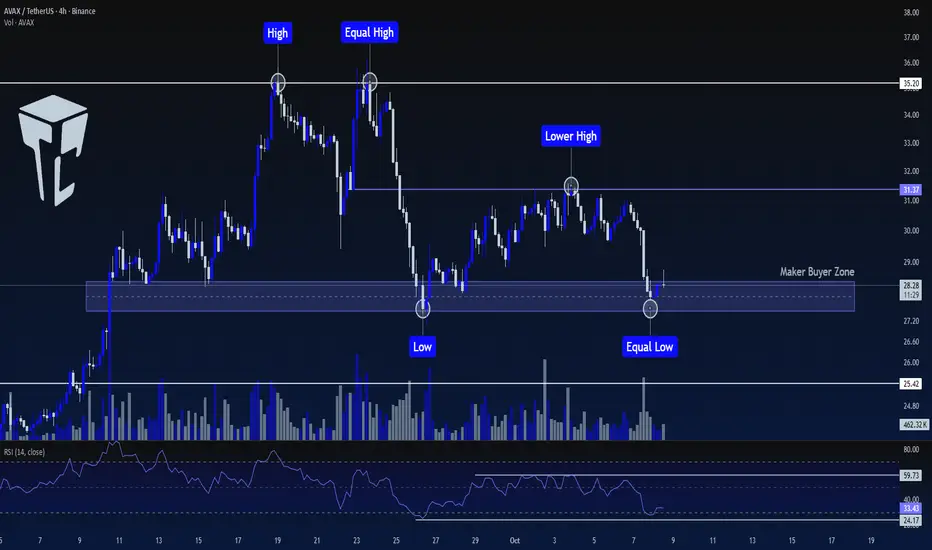
⏳ 4-Hour Timeframe
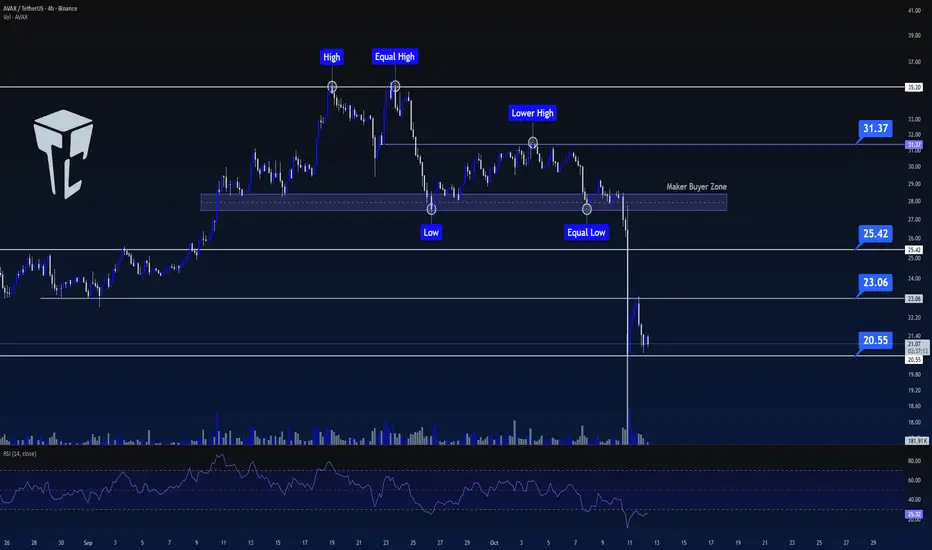
On the 4-hour timeframe, AVAX has a strong Maker Buyer zone that has been tested multiple times and provided support.
⭐ On the other hand, after creating two equal peaks at 35.20, the next peak was lower, at 31.37.
✅ This indicates that the sellers' strength in the market is greater than the buyers' strength, but buyers also have a significant support level, which has been effective so far in preventing further price decline.
🧩 Since Bitcoin's trend is entirely bullish, and there’s a high chance of Bitcoin's dominance decreasing, altcoins may experience an upward move. So, I am inclined to open a long position on this coin.
📊 The first trigger for a long position is the break of 31.37. The main trigger to start the coin's primary trend will be 35.20.
💥 If you believe the market will move downward and are looking for a short position, breaking the support level I marked could lead to a price decline towards 25.42.
📝 Final Thoughts
Stay calm, trade wisely, and let's capture the market's best opportunities!
This analysis reflects our opinions and is not financial advice.
Share your thoughts in the comments, and don’t forget to share this analysis with your friends! ❤️
TradeCityPro | Bitcoin Daily Analysis #189👋 Welcome to TradeCity Pro!
Let’s move on to the Bitcoin analysis. Yesterday, after setting a new ATH, Bitcoin began its correction — let’s review the market together.
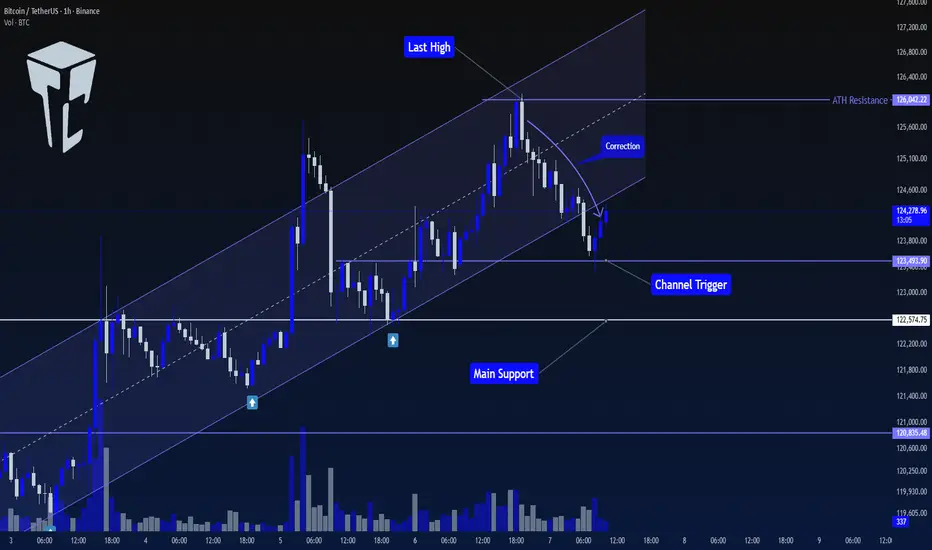
⏳ 1-Hour Timeframe
On the 1-hour timeframe, Bitcoin had been moving inside an ascending channel that had provided multiple supports. However, after being rejected from 126042, the price experienced a downward move and broke the channel to the downside.
⭐ The channel breakout trigger is at 123493, where the price has already reacted once, and it’s now moving slightly upward with very low volume.
📊 If this low-volume bullish movement continues, the likelihood of trigger activation will increase, and in that case, the price could move toward 122574.
🔍 For now, none of these triggers are suitable for short positions, as the market still looks too bullish to consider shorting.
✨ For long positions, the current trigger is 126042. However, if the market consolidates longer and forms a new structure, we might find an opportunity to enter earlier.
❌ Disclaimer ❌
Trading futures is highly risky and dangerous. If you're not an expert, these triggers may not be suitable for you. You should first learn risk and capital management. You can also use the educational content from this channel.
Finally, these triggers reflect my personal opinions on price action, and the market may move completely against this analysis. So, do your own research before opening any position.
TradeCityPro | PENDLE: Near Breakout From Descending Trendline👋 Welcome to TradeCity Pro!
In this analysis, I want to review the PENDLE coin for you — one of the projects in the Ethereum ecosystem, currently ranked 93rd on CoinMarketCap with a market cap of $858.76 million.
📅 Daily Timeframe
On the daily timeframe, this coin has formed two trendlines. The main trendline is the long-term ascending trendline that the price has respected for a long time, while the second is a continuation descending trendline — if broken, the previous bullish move can resume.
✨ Since the overall trend is bullish, the continuation trendline is currently more important for us, because breaking it would confirm the continuation of the uptrend.
🔍 This trendline formed after the price reached the 5.732 level and made a fake breakout.
📊 The breakout trigger for this trendline is currently at 5.344. Breaking this level can provide an opportunity to open a long position on PENDLE.
🛒 For spot purchases, this same 5.344 trigger can be used, but the 5.732 level would be a much safer confirmation for a spot entry.
✅ The main confirmation of bullish continuation in higher cycles will come after breaking 6.857.
🎲 It’s important to note that any bullish breakout must be accompanied by an increase in volume, otherwise the move could easily turn out to be fake.
⚡️ If the ascending trendline breaks, the trigger for this breakdown is at 4.431. Breaking this level is not an ideal short trigger, but if the price stabilizes below it, you can consider activating your stop-loss in case you’ve already bought the coin in spot.
🧩 The next support levels in case of further decline are 3.741 and 3.017.The momentum trigger on the RSI is at 39.16.
📝 Final Thoughts
Stay calm, trade wisely, and let's capture the market's best opportunities!
This analysis reflects our opinions and is not financial advice.
Share your thoughts in the comments, and don’t forget to share this analysis with your friends! ❤️

TradeCityPro | Bitcoin Daily Analysis #188👋 Welcome to TradeCity Pro!
Let’s move on to the Bitcoin analysis. Today, after pulling back to its previous resistance, Bitcoin is ready to start its next move.
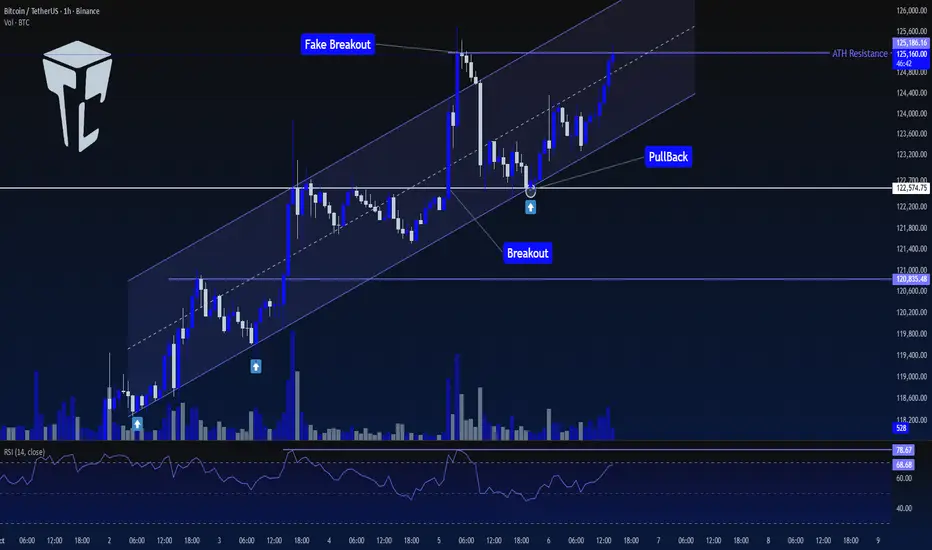
⏳ 1-Hour Timeframe
On the 1-hour timeframe, Bitcoin continues its upward trend. Yesterday, after a pullback to the 122574 area and support from the channel’s bottom, it is once again ready to begin its next leg upward.
✨ The top formed at 125186 is Bitcoin’s new ATH resistance, and breaking this level would lead to further bullish continuation.
✅ Today, if this level breaks, we can have a long position on Bitcoin. If you already have an open position, there’s no need to re-enter at this point — it’s better to look for opportunities in other coins.
🎲 Since Bitcoin’s dominance trend is generally declining, if the next bullish leg begins, altcoins could also become attractive options. Therefore, it’s best to hold one position on Bitcoin and another on selected altcoins.
❌ Disclaimer ❌
Trading futures is highly risky and dangerous. If you're not an expert, these triggers may not be suitable for you. You should first learn risk and capital management. You can also use the educational content from this channel.
Finally, these triggers reflect my personal opinions on price action, and the market may move completely against this analysis. So, do your own research before opening any position.
TradeCityPro | SUI: Approaching Key Breakout From Channel👋 Welcome to TradeCity Pro!
In this analysis, I want to review the SUI coin for you, one of the coins that gained significant attention in 2024 and currently ranks 14th on CoinMarketCap with a market cap of $13.22 billion.
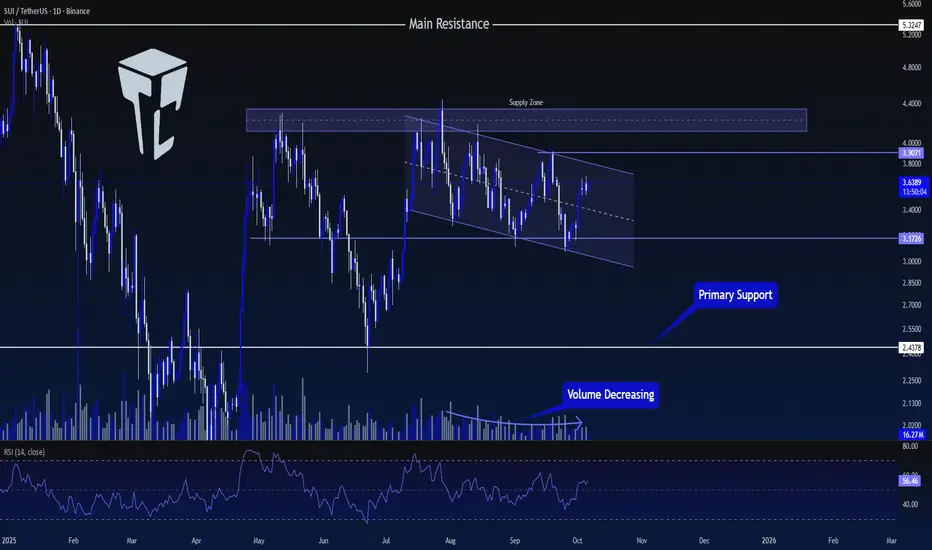
📅 Daily Timeframe
On the daily timeframe, this coin has formed a supply zone near $4, and for the past few months, the price has been struggling with it.
⭐ At the moment, after the latest rejection from this zone, a descending channel has formed, guiding the price slowly downward.
✅ The support level that the price has recently built is 3.1726, which has been tested twice, and now the price is moving toward the top of the channel.
🎲 If the channel breaks to the upside, we can consider opening a long position. The main bullish confirmation will come after breaking the upper resistance zone, but an early long position can be opened upon the breakout of 3.9071.
🔍 If the downward movement resumes and 3.1726 breaks, the move could extend to the next support area at 2.4378.
📝 Final Thoughts
Stay calm, trade wisely, and let's capture the market's best opportunities!
This analysis reflects our opinions and is not financial advice.
Share your thoughts in the comments, and don’t forget to share this analysis with your friends! ❤️
TradeCityPro | PEPEUSDT a trigger ready for buying👋 Welcome to TradeCityPro Channel!
Let’s move on to the analysis of PEPEUSDT a trigger ready for buying.
We’re analyzing the most popular meme coin in the current market PEPE, which lately has been taking steps to increase its value and move beyond being just an online joke.
🌐 Overview of Bitcoin
Before starting the analysis, let me remind you that we moved the Bitcoin analysis section to a separate daily report at your request, so we can discuss Bitcoin’s condition, price action, and dominance in more detail
📊 Weekly Timeframe
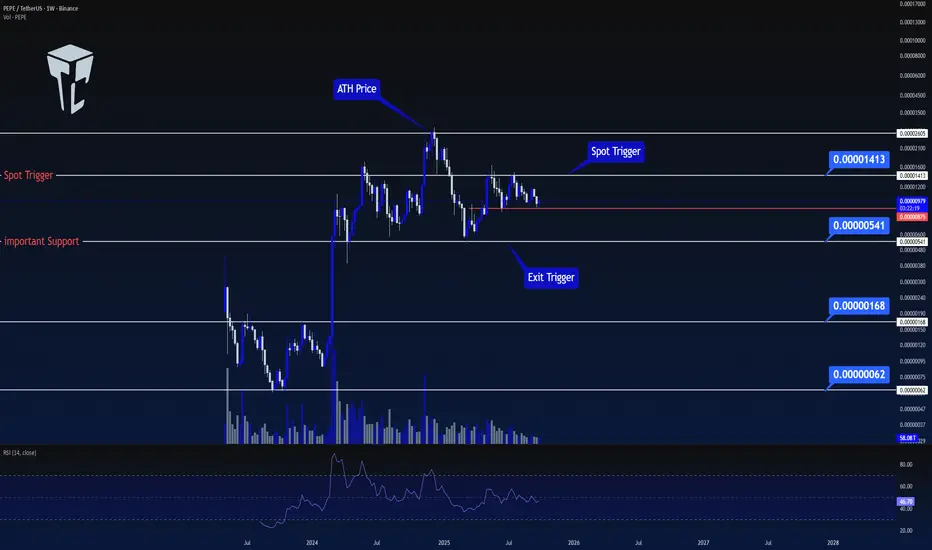
After breaking the 0.00000168 level, PEPE experienced a strong upward rally and recorded a new ATH at 0.00002605. Currently, the price is holding around the 0.00000875 support.
If you entered from lower levels, it’s a good time to take profits and secure gains.
If your entry was around the current area, the active stop-loss should be set below 0.00000541
🕐 Next Entry Plan
For re-entry, patience is required. Wait and observe the chart in weekly and daily timeframes we might see a fake breakout around this support.
However, the main trigger for a new entry will be a confirmed breakout above 0.00001413, ideally with strong volume to confirm the move.
📝 Final Thoughts
Stay calm, trade wisely, and let's capture the market's best opportunities!
This analysis reflects our opinions and is not financial advice.
Share your thoughts in the comments, and don’t forget to share this analysis with your friends! ❤️
TradeCityPro | Bitcoin Daily Analysis #187👋 Welcome to TradeCity Pro!
Let’s go over Bitcoin’s analysis — today, Bitcoin has recorded a new ATH. Let’s review the market conditions together.
📅 Daily Timeframe
In the daily timeframe, Bitcoin is moving inside an ascending channel with a steady upward slope.
⭐ After a corrective move from the top of the box, the price made a fake breakdown of the channel’s bottom and then, with the bullish momentum that followed, moved upward and managed to set a new ATH.
✔️ During the correction, the volume was decreasing, but after the price was supported at the key support zone and the fake breakdown occurred, buying volume entered the market.
✨ The main confirmation of the bullish continuation could be taken after breaking above 117056. Currently, the next confirmation trigger is a price stabilization above 123433.
💥 In my opinion, since RSI is getting rejected from the 70 level and the price has reached a strong resistance zone, there’s a high chance that the market will range below this resistance for a few days to test it.
🧩 At the moment, the main RSI resistance level seems to be 75.38 — if this level breaks, the main market momentum could start, leading to a sharp move upward.
📊 It’s completely normal for the trend to show weakness after reaching an ATH, because this level is Bitcoin’s largest supply zone. These wicks hitting the resistance zone don’t necessarily mean trend weakness — it’s typical for the price to form such candles when testing its all-time high.
🔑 What really matters is how the price reacts in the next few attempts at this zone, which will tell us whether we have an actual trend weakness or not.
💫 Right now, the most important support Bitcoin has built is around 107000. If a bearish move begins, the first confirmation of a downtrend will be breaking this area. However, the main confirmation of a full bearish reversal would be the break of 100961.
🎲 Overall, since the price is currently at the top of the market, finding precise triggers on Bitcoin is difficult. But considering Bitcoin dominance has the potential to drop, altcoins could provide excellent trading setups in the coming days if that dominance decline begins.
❌ Disclaimer ❌
Trading futures is highly risky and dangerous. If you're not an expert, these triggers may not be suitable for you. You should first learn risk and capital management. You can also use the educational content from this channel.
Finally, these triggers reflect my personal opinions on price action, and the market may move completely against this analysis. So, do your own research before opening any position.
