Plan for 13h January 2026 Nifty future and banknifty future analysis and intraday plan.
Quarterly results-
This video is for information/education purpose only. you are 100% responsible for any actions you take by reading/viewing this post.
please consult your financial advisor before taking any action.
----Vinaykumar hiremath, CMT
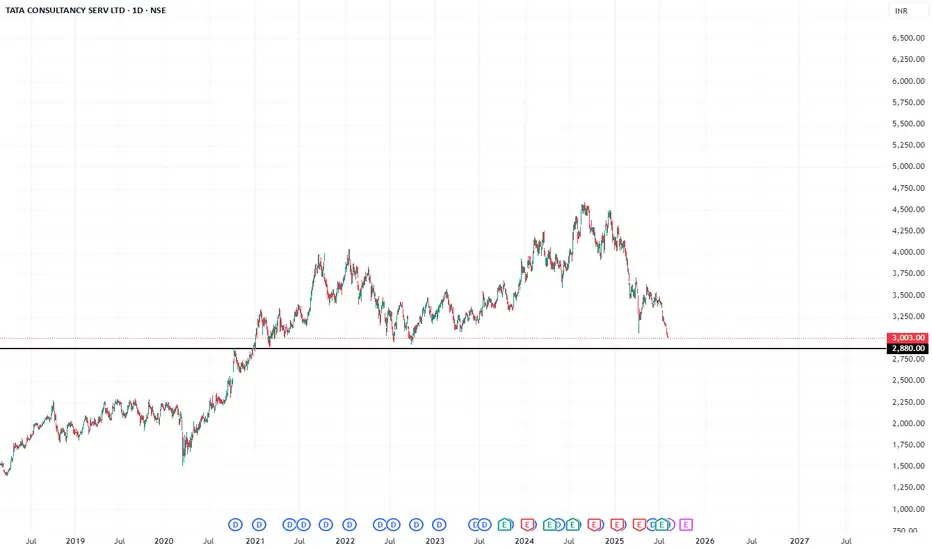
TCS

Review and plan for 19th December 2025 Nifty future and banknifty future analysis and intraday plan.
Tcs-analysed.
This video is for information/education purpose only. you are 100% responsible for any actions you take by reading/viewing this post.
please consult your financial advisor before taking any action.
----Vinaykumar hiremath, CMT

TCS: SMA 200 for long positionHello traders,
The stock we are going to watch is $NSE:TCS. This stock is related to IT sector. This stock is mostly moving in an upward direction. Currently, it is taking some additional support of SMA200 in 4h time frame. This stock can shoot upwards at anytime.
If you're a option trader, consider buying the premium which is having the liquidity. Consider exiting near 4100 to protect your profits.
Thanks & regards,
Alpha Trading Station

TCS Hourly Trend AnalysisAs per technical study and price patterns and timing methods, I expect TCS to take a strong bull move towards the resistance of 3273. Increasing volume supports this bull trend till November 17, 2025.
There may be a possibility of profit booking post Nov 17.
This is my personal view based on my analysis. Traders are suggested to conduct own technical studies for entries and exits with proper risk management.

TCS - H1 - Triangle Breakout (19.10.2025)📊 Setup Overview:
TCS is showing a Triangle Breakout formation on the H1 chart. Price has been consolidating within converging trendlines, and a cloud crossover hints at a possible momentum shift. This setup could lead to a directional breakout opportunity for short-term traders.
📈 Trade Plan:
Bias: Bearish below the breakout zone
Sell Entry Zone: Below 2950 (after candle close confirmation)
1st Target: 2877 ✅
2nd Target: 2814 🎯
Resistance Zone: 3010 – 3030
🧩 Technical Confluence:
1.Price rejected from upper trendline multiple times
2.Ichimoku Cloud crossover signals short-term weakness
3.Lower highs formation confirms loss of bullish momentum
4.Volume profile shows high interest near 2900, indicating potential liquidity zone
#TCS #NSE #StockMarketIndia #TechnicalAnalysis #TriangleBreakout #Ichimoku #PriceAction #SwingTrading #StocksToWatch #IndianStocks #Nifty50 #TradingView #ChartsDontLie #Kabhi_Ta_Trading #BearishSetup
💡 Fundamental View:
TCS, India’s leading IT services giant, remains fundamentally strong with consistent revenue from global clients and robust digital transformation projects.
However, recent IT sector consolidation and global tech budget tightening could create short-term selling pressure. The stock’s medium-term outlook remains positive, but near-term corrections may occur before a fresh rally.
⚠️ Disclaimer:
This analysis is for educational and informational purposes only and should not be considered as financial advice. Always use proper risk management and confirm setups with your own analysis before trading or investing.
💬 Support the Analysis:
If this chart helped you — LIKE 👍, COMMENT 💬 your views, and FOLLOW ✅ for daily market insights, chart patterns, and trade setups!

Review and plan for 10th October 2025Nifty future and banknifty future analysis and intraday plan.
Quarterly results.
This video is for information/education purpose only. you are 100% responsible for any actions you take by reading/viewing this post.
please consult your financial advisor before taking any action.
----Vinaykumar hiremath, CMT

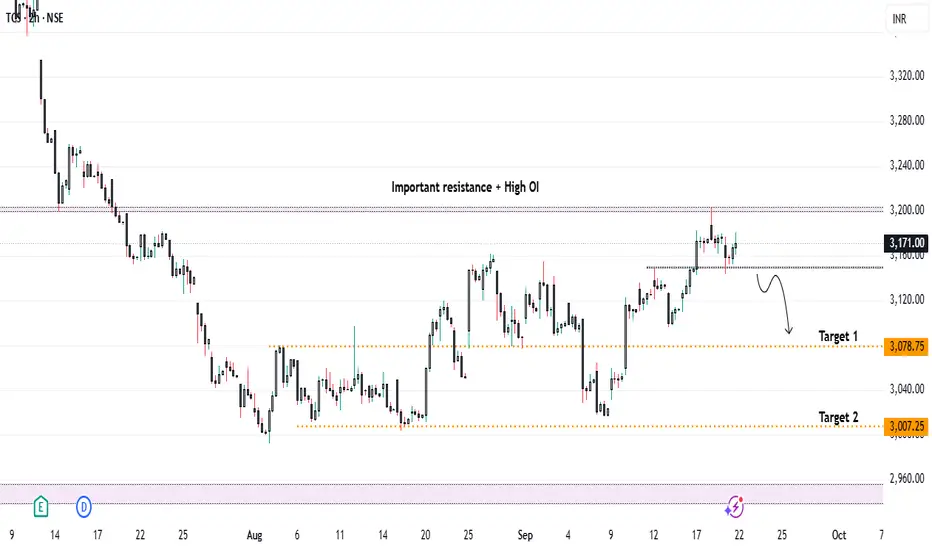
TCS Under Pressure – Will Visa Heat Trigger ₹3000 Levels..?Currently, TCS is trading near the crucial resistance zone of ₹3200, which also carries high open interest. From a technical perspective, if the stock breaks and closes below the short-term support of ₹3150, we can look for a short entry on retest, with targets:
* 🎯 Target 1: ₹3080
* 🎯 Target 2: ₹3000
📰 Fundamental / News Catalyst
The recent US H-1B visa policy update imposing a $100,000 fee on new petitions triggered a knee-jerk reaction in IT stocks:
* U.S.-listed Indian IT firms saw an immediate 2-5% decline.
* Analysts expect the impact on TCS to be limited, since a large part of its U.S. workforce is locally hired and renewals/existing visas are exempt.
* Worst-case estimates suggest a 3-5% downside in the short term, but not a structural collapse for large, diversified players like TCS.
📊 Impact Outlook on TCS
Short Term (days–weeks):
* Investor sentiment may turn negative, causing selling pressure.
* Margin compression possible due to new visa costs.
* Analysts could revise earnings growth expectations lower.
* Offsetting factors: Renewals exempt, TCS has a solid U.S. local workforce, and offshore flexibility.
Medium Term (months):
* New contracts may factor in higher costs.
* Shift to offshore delivery could reduce higher-margin onsite revenues.
* More local U.S. hiring may raise costs.
* Offsetting factors: TCS’s scale allows cost absorption; some costs may be passed to clients.
Long Term (year+):
* Delivery model may shift further to offshore/local U.S. hiring.
* Competitive pressure if peers adapt faster in the U.S. market.
* Margins could be under pressure.
*Offsetting factors: Strong global brand, diversified business, investments in AI & automation can offset long-term risks.
🔎 Scenarios for Share Price
* Mild Reaction: 3-5% decline → cautious investors, limited disruption.
* Moderate Reaction: 8-12% decline → project delays, client pushback, stricter visa rules.
* Severe Reaction: 15-20%+ decline → contract losses, earnings downgrades, tighter U.S. policy.
✅ Conclusion
* 📌 Technicals: Watch ₹3150 for breakdown confirmation; short entries possible below this with ₹3080 / ₹3000 as downside targets.
* 📌 Fundamentals: News-driven weakness is likely, but structural risk to TCS remains limited vs smaller IT peers.
* 📌 Strategy: Short-term bearish setup aligns with both technical chart structure and negative sentiment from visa policy changes.
📌 Sentiment: Bearish (Short Term)
Plan for 21st August and analysis of important setups. Nifty future and banknifty future analysis and intraday plan.
This video is for information/education purpose only. you are 100% responsible for any actions you take by reading/viewing this post.
please consult your financial advisor before taking any action.
----Vinaykumar hiremath, CMT

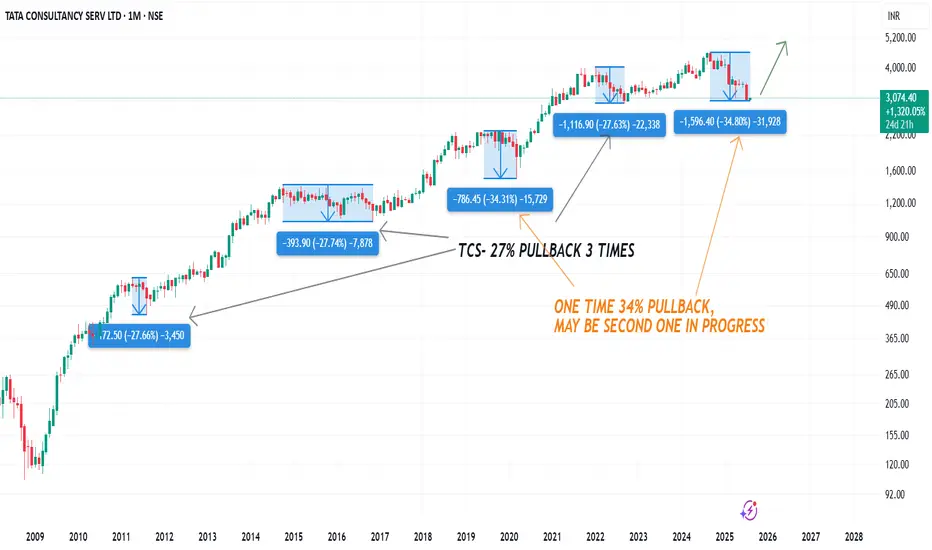
TCS Chart Analysis: Key Trends and Predictions for August 2025**TCS Historical Pullbacks Analysis and Outlook**
Tata Consultancy Services (TCS) has exhibited a remarkable long-term uptrend, punctuated by a series of significant corrections. Your chart annotation highlights a compelling technical pattern: TCS has experienced three major pullbacks of approximately **27%** each over the past decade. These deep corrections have historically been followed by periods of robust recovery and new highs.
Interestingly, your chart also marks two exceptional occasions where the stock witnessed even deeper corrections, around **34%**, the most recent of which may still be in progress. The ability of TCS to consistently bounce back after such steep declines testifies to its underlying strength, market leadership, and the confidence of long-term investors.
**Key Insights From the Chart:**
- **Three 27% Pullbacks:** Marked by distinct blue boxes, each of these corrections provided attractive accumulation opportunities, and each was followed by renewed bullish momentum.
- **Rare 34% Corrections:** These are far less frequent, indicating abnormal market stress or broader corrections, but also highlight zones of potential capitulation and renewed accumulation.
- **Current Status:** The latest price action suggests another 34% pullback may be underway or nearing completion, as marked in orange annotation.
**Strategic Takeaway:**
Given TCS’s proven track record of recovery after such corrections, investors may view these deep pullbacks as strategic buying opportunities for the long term. Patience and discipline are critical, as the stock often rewards those who accumulate during periods of pessimism.
**Conclusion:**
TCS remains a robust large-cap IT pick. Historical patterns suggest that major corrections—while unnerving—tend to precede strong rallies. Investors should watch for signs of stabilization and reversal to position themselves for the next phase of growth, always aligning choices with personal risk tolerance.
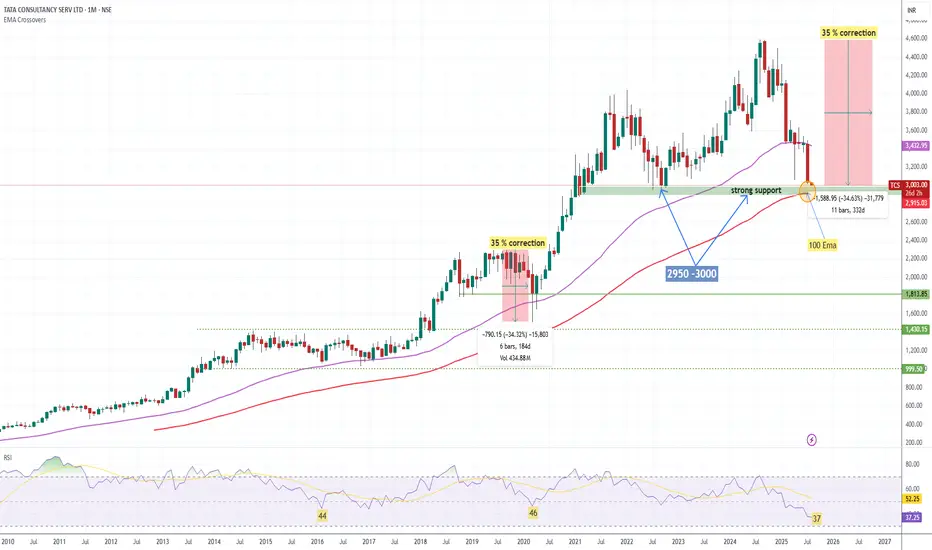
"TCS Takes a COVID-Style Dive Again – Is It Time to Buy?"Price Action History:
During the COVID crash, TCS fell nearly 35% from its top, eventually taking support at the 100 EMA on the monthly chart and staging a strong bounce.
In 2022 (June,july,Sep,Oct), around 3000 zone was tested multiple times, followed by a significant rally.
📊 Current Scenario:
Once again, TCS is trading near the ₹2950–₹3000 zone, which coincides with the 100-month EMA – a historically proven support level.
Price action suggests we are at a critical inflection point similar to past major bottoms.
✅ Key Technical Levels:
Support Zone: ₹2950–₹3000 (100 EMA Monthly+ 2022 support level)
Immediate Resistance: ₹3300–₹3400
Upside Potential: A bounce similar to COVID & 2022 patterns could trigger a strong upside move.
Trading Strategy:
if you are short term trader Keep a strict stop-loss below ₹2900 (monthly close basis) or 100 monthly EMA
Position sizing is key – don’t over-leverage.
🔎 Conclusion:
For long term trader This zone has historically acted as a strong accumulation area for long-term investors. If history repeats, this could be a high probability buying opportunity for swing and positional traders.
Fundamental Factor
Net Profit (Q1 FY26) ₹12,760 cr (+6% YoY)
Revenue Growth +1.3% YoY (−3.1% in CC)
Operating Margin 24.5% (↑30 bps QoQ)
Trailing P/E 22× (vs 5‑yr average ~24‑26×)
Dividend Yield 2.0%
ROE /ROCE 52%/64%
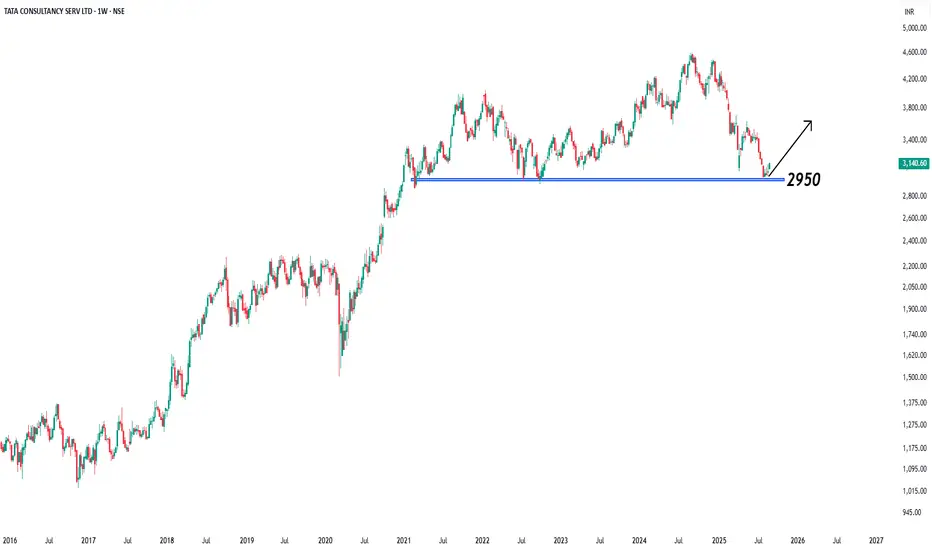
TCS Near Major Support !
TCS is approaching a critical multi-month support zone between ₹2,880–₹2,860. This level has previously acted as a reliable demand zone in June and July. A retest and breakdown below ₹2,875 may open the gates for further downside toward ₹2,810.
However, a bounce from this support — backed by volume and a strong daily close — could push the stock back to the ₹3,040–₹3,080 resistance range.
🔻 TCS – Approaching Major Support (Daily)
CMP: ₹2,890 (as of Aug 2, 2025)
Support Zone: ₹2,880 – ₹2,860
📌 Key Price Levels:
Major Support: ₹2,880 – ₹2,860
Resistance (Bounce Zone): ₹2,920
Breakdown Trigger: Below ₹2,860
Target (if breakdown): ₹2,810
Target (if bounce): ₹2,940 → ₹2,975
Stop Loss (Bounce Trade): ₹2,855
🧠 Setup Explanation:
TCS is nearing a multi-week demand zone around ₹2,880, previously tested in June and early July. Watch for price action confirmation — either a bounce with volume or a clean break below ₹2,860, which may invite further downside.
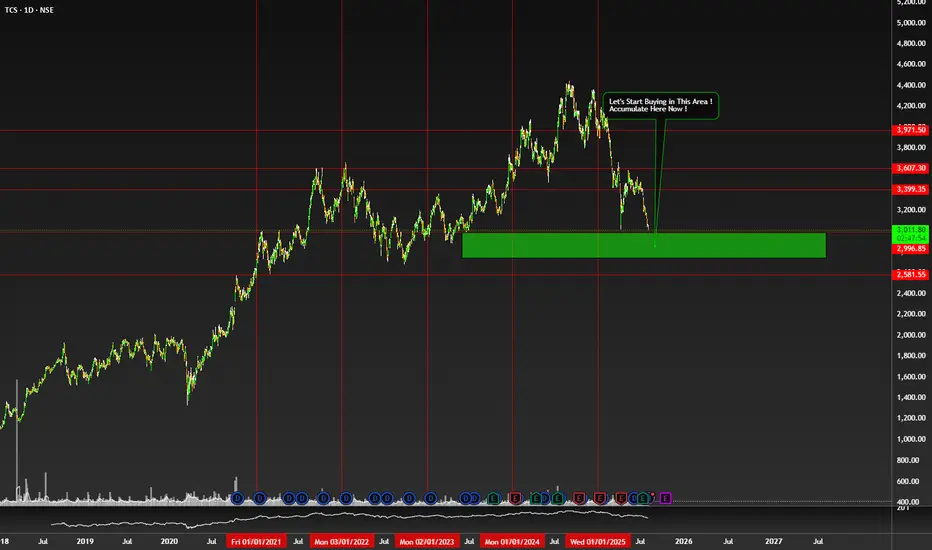
Time To Accumulate $NSE:TCS NSE:TCS
My Trade Opinion
Let's Accumulate here in Green area.
Best time to Buy here.
Don't Buy if Some One Think IT will Dead in india. :D
Future is at Some Time Ahead.
Don't Listen Just Observe it.
Company is Going to Aggressively Progress in Future.
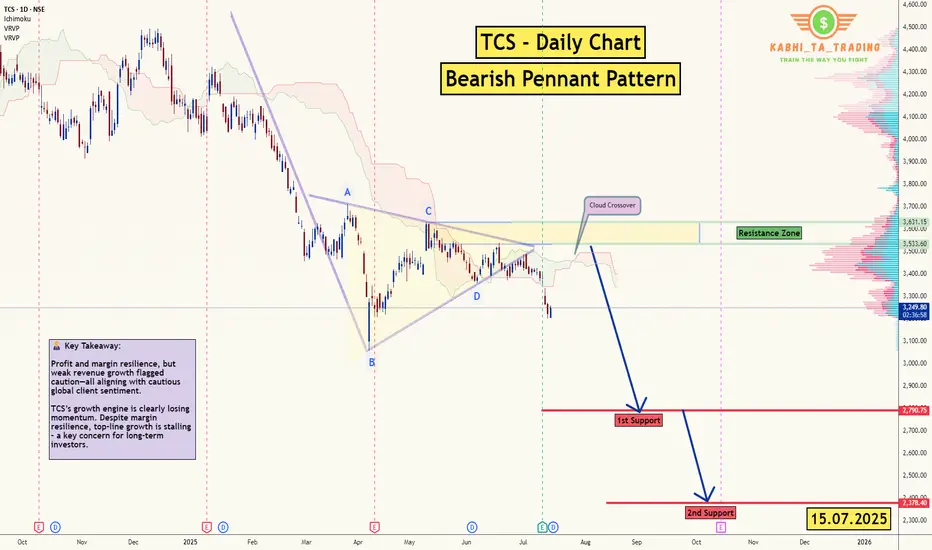
TCS - D1 - Bearish Pennant 🧾 1. 📊 Q1 FY26 Earnings Summary
i. Revenue: ₹63,437 cr (~US $7.4 bn), up just 1.3% YoY, missing expectations of ~₹64,667 cr
ii. Profit/margin held up; revenue disappointed.
📌 Key Takeaway: Profit and margin resilience, but weak revenue growth flagged caution—all aligning with cautious global client sentiment.
🔮 2. Upcoming Events & Catalysts :
Ex‑Dividend Date: Record date July 16, for interim dividend of ₹11/share.
Macro Cues: U.S. tariff developments, global IT spend trends, and sector peers (HCL, Infosys) Q2 reports. Reflation in IT services could shift sentiment.
TCS Investor Engagements: Gen‑AI STEM program (Jul 9); presence at global fintech & life‑sciences events through Sep (SIBOS, COBA) .
📆 3. Catalysts Ahead :
Global IT Budget Trends (esp. U.S. and Europe) → direction for next‑quarter bookings.
Peer Q2 Results (HCL, Infosys) → could provide broader sector cues.
New Deal Wins from BFSI/USD clients → margin & growth potential.
Macro Developments: Trade policies, Fed signals, and inflation data.
Thank you.
TCS is into Bearish zone, Could drop to 2800TCS is entered into Bearish zone on Monthly Chart and It could drop tp 2800 and below levels.
Note: This is not a buy/sell trade call. Trade at your own will and analysis. Use stop loss too.

Tata Consumer Products Ltd a bearish harmonic Gartley pattern Tata Consumer Products Ltd has formed a **bearish harmonic Gartley pattern, completing at point D near the 1.395 Fibonacci extension—typically a reversal zone. RSI is near overbought, suggesting caution. Based on this technical setup, the stock may face **selling pressure**, making it a sell recommendation with a target of ₹1,040 and a stop loss at ₹1,135. If the price breaks above ₹1,135 with strong volume, trend bias can shift bullish, but currently, it's best viewed with a short-term bearish outlook.
for educational purposes only

11 April Nifty50 trading zone update 22918 above positive trade veiw
22828 below nigetive trade view
22788 strong support
22988 strong resistance

11 April Nifty50 trading zone #Nifty50
99% working trading plan
👉Gap up open 22660 above & 15m hold after positive trade target 22818, 23118
👉Gap up open 22660 below 15 m not break upside after nigetive trade target 22492
👉Gap down open 22492 above 15m hold after positive trade target 22658, 22810 , 23118
👉Gap down open 22492 below 15 m not break upside after nigetive trade target 22372
💫big gapdown open 22372 above hold 1st positive trade view
💫big Gapup opening 22818 below nigetive trade view
📌For education purpose I'm not responsible your trade
More education following me

tcsclassical double bottom formation in tcs
breakout and retest done
if any kind of bullishness shown on lower time frame. make good entry

Tcs Short Daily time frameTCS Short in Daily time frame if the market is continuing sell trend, but expecting certain conditions has to be met which is been mentioned in the chart

TCS Analysis - Multi-Year Deal with Air France-KLMTrend: TCS is in a strong uptrend within an ascending channel since 2021, signaling steady growth potential.
Technical Signals:
EMA Support : Price bounced above key EMAs (20/50/100/200), showing strong support.
Volume Surge : High buying volume after the Air France-KLM deal indicates increased investor confidence.
RSI : Above 50, supporting bullish momentum.
Levels to Watch:
Support : ₹3,995.45 – Reliable base.
Immediate Resistance : ₹4,411.25
Final Target : ₹4,587.95 – Top of the channel.
Trade Setup:
Entry: On pullbacks or above ₹4,217.30.
Stop Loss : Below ₹3,995.45.
Target : ₹4,411.25 - ₹4,587.95.

TCS POSITIONAL LONG TRADE
Here is the valid Source and its Destination which has violated its opposite Supply;
This is the Demand & Supply Equilibrium Curve according to the Fresh Demand and Supply available.
We have further sub-divided the Curve into 5 areas; considering we as traders are supposed to buy low and sell high where is high and how low can it get; these areas give us an understanding about the Price position as per the Curve.
Price has come into the Demand making Lower Lows and then after reacting to the Weekly Demand Price has violated a previous High; which shows a possibility of Buyers upping their game vs the available sellers.
Finally we have a Demand formed in 45 mins which is the first Demand formed after Price has reacted to the Weekly Demand and we have a Buying momentum confirmation hence this is a Buy Trade favourable reward to risk ratio

TCS
NSE:TCS
One Can Enter Now !
Or Wait for Retest of the Trendline (BO) !
Or wait For better R:R ratio !
Note :
1.One Can Go long with a Strict SL below the Trendline or Swing Low.
2. R:R ratio should be 1 :2 minimum
3. Plan as per your RISK appetite and Money Management.
Disclaimer : You are responsible for your Profits and loss, Shared for Educational purpose
