#CARBORUNIV CARBORUNIV #trading #candlesticks #invest #money #it#CARBORUNIV
NSE:CARBORUNIV
Carborundum Universal Ltd.
NSE:CARBORUNIV
NSE:CARBORUNIV
CMP: 910.70
Target: >1200
Time Frame: < 3 months
SL: 807
RR Ratio: > 3
INVEST & HOLD
Factors:
BULLISH WEDGE BREAKOUT
Trend Following
Rising Volume with rising Prices.
Flag pattern breakout.
Pennant Pattern Breakout with Bullish Candle.
Retest Successful.
Higher Highs & Higher Lows.
Broken above RESISTANCE levels
Trading at SUPPORT levels
Earnings are strong.
Bullish Wedge Breakout
Risk Return Ratio is healthy.
And
Rising from Double Bottom Pattern to Flag Pattern forming.
If you like my work KINDLY LIKE SHARE & FOLLOW this page for free Stock Recommendations.
With 💚 from Rachit Sethia
TCS

#SALZERELEC #NIFTY #BANKNIFTY #MUHURATTRADING #MUHURAT #RELIANCESalzer Electronics Ltd.
NSE:SALZERELEC
NSE:SALZERELEC
CMP: 180.55
Target 1: 210
Time frame: <2months
Factors:
BULLISH WEDGE BREAKOUT
Trend Following
Rising Volume with rising Prices.
Flag pattern breakout.
Pennant Pattern Breakout with Bullish Candle.
Retest Successful.
Higher Highs & Higher Lows.
Broken above RESISTANCE levels
Trading at SUPPORT levels
Earnings are strong.
Bullish Wedge Breakout
Risk Return Ratio is healthy.
And
Rising from Double Bottom Pattern to Flag Pattern forming.
If you like my work KINDLY LIKE SHARE & FOLLOW this page for free Stock Recommendations.
With 💚 from Rachit Sethia

#SKFINDIA #NIFTY #BANKNIFTY #Iot #IT #NFT #ML #muhurattradingSKF India Ltd.
NSE:SKFINDIA
NSE:SKFINDIA
CMP: 3519
Target 1: 3800+
Target 2: 4500+
Time frame: <6months
Factors:
BULLISH WEDGE BREAKOUT
Trend Following
Rising Volume with rising Prices.
Flag pattern breakout.
Pennant Pattern Breakout with Bullish Candle.
Retest Successful.
Higher Highs & Higher Lows.
Broken above RESISTANCE levels
Trading at SUPPORT levels
Earnings are strong.
Bullish Wedge Breakout
Risk Return Ratio is healthy.
And
Rising from Double Bottom Pattern to Flag Pattern forming.
If you like my work KINDLY LIKE SHARE & FOLLOW this page for free Stock Recommendations.
With 💚 from Rachit Sethia

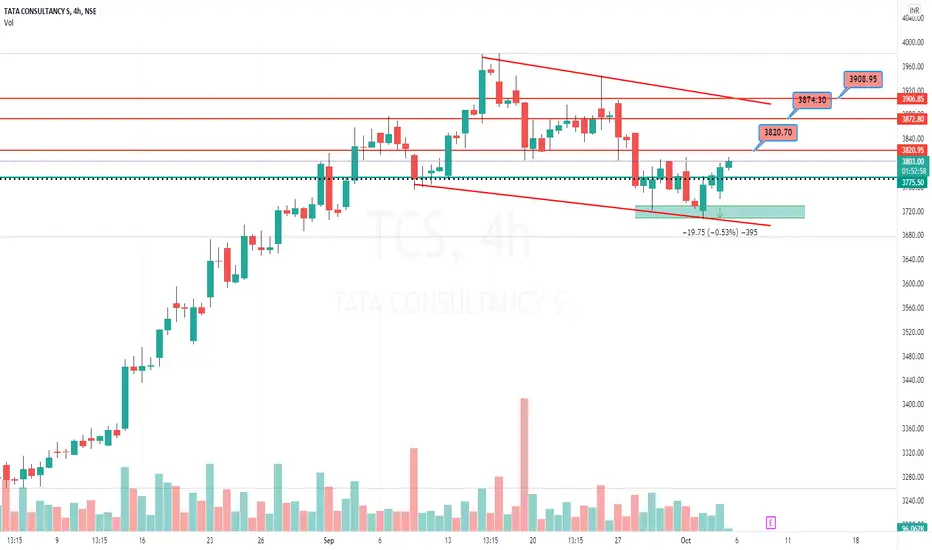
Tcs Looking Very Strong Near Day Support Zone 3390 - 3350 Tcs Looking Very Strong Near Day Support Zone 3390 - 3350
Strong Reversal Seen In Tcs After Retest Previous Breakout
Tcs Big Buying Opportunity Cmp 3490 - 3500 Spot
Stop Loss Below 3350
Target 3900 4200 4500 +++


TCS entering in accumulation zoneCurrent price swing of TCS has already retraced 61.8% Fibonacci levels. Also RSI is near 30 indicating oversold position. Start accumulating it at the range 3360-3400.

TCS ReversalThe stock has reached lower trendline and may undergo a reversal rally. Trade is supported by brokerage calls and Supports Nearby.
Risk Reward Ratio - 3:1
SL is placed below support zone & the lower trendline. The target is placed near swing high.

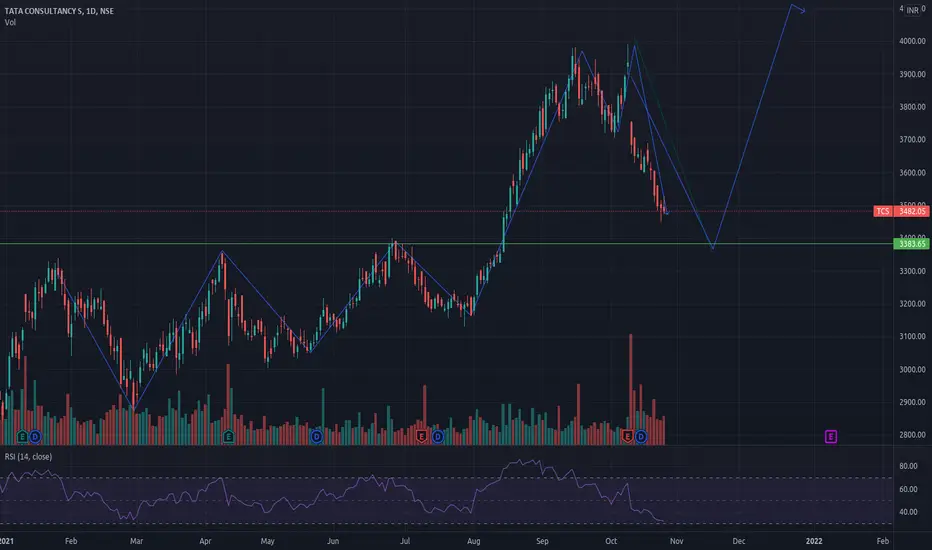
TCSit will till starting of nov
then the correction will be over around 3400
then an upward trend may start which may take it 4000+

Nifty, Banknifty, Top Stocks Analysis with imp leves!Despite testing 18k levels, Nifty tumbled 100+ points from its highs. TCS was an easy scapegoat, but there were more reasons!

Falling ChannelStock Analysis: TCS has formed falling channel it is good buy now with below demand level as stop loss for the target given on the chart.
lets' see
Happy Investing!
Nifty, Banknifty, Top Stocks Analysis with imp leves!Here is my daily market analysis on Nifty, Banknifty and the top stocks. This is likely to be my last daily analysis here as I might be exploring livestreams later.

TCS Daily TimeframeSNIPER STRATEGY
This magical strategy works like a clock on almost any charts
Although I have to say it can’t predict pullbacks, so I do not suggest this strategy for leverage trading.
It will not give you the whole wave like any other strategy out there but it will give you huge part of the wave.
The best timeframe for this strategy is Daily, Weekly and Monthly however it can work any timeframe above three minutes.
Start believing in this strategy because it will reward believers with huge profit.
There is a lot more about this strategy.
It can predict and also it can give you almost exact buy or sell time on the spot.
I am developing it even more so stay tuned and start to follow me for more signals and forecasts.

Buy above TechmIT sector moves very positively towards upside. Techm also looks bullish, if it break previous high upside move will be very quick and nice return for swing traders. Take a chance and keep looking.


TCS 1DTCS
TCS is ready for retest if d
fall down at 3450 we take positional also Short term for 1-2 months
target will be 3700


TCS, 1D TimeframeTCS has just given breakout of trendline in 1D time frame. But we should be cautious also as it is on the R2 of Pivot Points. One can go long as soon as it crosses the R2.

TCS - Ascending triangle Breakoutzone !!!TCS - Ascending triangle Breakout. Long term investment candidate !!!

TCS looks good On 2H chartNSE:TCS
TCS on 2H chart showing good breakout to consolidation area of 3155-3240. And it may show good up move from here. One can consider this counter for swing trade. TCS now has a strong support of 3150 while next resistance area is of 3380-3400
hari om
shree ram
ambdnya


TCSTcs tooked support as per price action, one can go long at current level or in dips with mentioned key levels in chart
Disclaimer
I am not sebi registered analyst
My studies are Educational purpose only
Please consult with your Financial advisor before trading or investing
