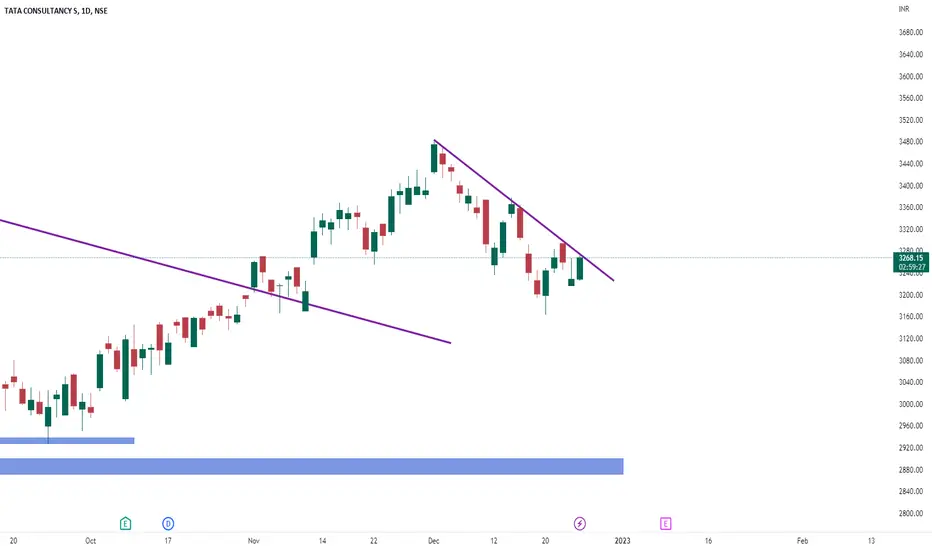
TCS Hey traders this is the day chart of TCS in which Resistance zone is 3490 If it sustain above this level then It can be bullish or if reject from here then we can short with small stoploss
And strong support zone is 2900
TCS

VEDL breakout incoming🚀VEDL looking ready for huge breakout📈
need to close 1d candle above 330 to confirm breakout✅
target would be next resistence at 430🎯

WORST IS OVER FOR INDIAN IT SECTOR As we can see that given chart the IT sector as form very good base , with bull sash candlestick pattern on last month low with fibonacci retracemet also at that same level suggest how important that level is for price.
Bull sash is very pwerful bottom forming candlestick pattern with high success rate.
As last week was bearish but this week price gapup plus give closing above previous week high.
I suggest to buy top it sectors stock with IT Bees as it is good to accumlate the stock for longterm perspective

TCS - Great short at 3430 It will give slight breakout of trendline and fall from the previous supply zone
Goes ex dividend at same time
Follows Trendline
Overbought on RSI
Slowing volumes on uptick
Matches Global Weak outlook
SL 3449 (-19)
Tgt 3200 (+230)
Caution : FNO can cause heavy losses on bad position sizing. Do your own research before taking trades. Not a registered analyst.

PNBHOUSING ready for continuation📈Buy after it breaks from consolidation range
target is next resistence at 675🎯

TCS- Long Term Positional TradTCS showing good strength in a bearish market, and it takes reversal from a support level. so the probability is high to keep the momentum upward when the market is steady or on an upside trend.
Entry Level:- Above @3325
Stop Level:- Below @ 3210
Target:- 1:1 or 1:2

TCSTCS is ma king a good bullish pattern if this stocks gives breakout in upper side then expect a good upper side movement lets see how this stock react this trendline we have to wait for the breakout
BTCUSD range trading 1h timeframe (NEW)Bitcoins is about to retest resistance again. We expect that it will breakout this time. Targets are shown on the chart.
How to trade: enter long position only when/if it breaks out the resistance.
If it gets rejected you can buy at the support (red line) and place the stop loss.

#CARBORUNIV #ORIENTABRA #WENDT #GRINDWELL #HEG #WHIRLPOOL #TWL #CARBORUNIV
NSE:CARBORUNIV
CMP: 885
TP: 1050
SL: 828
TF: <6m
RR > 2.8 times
Return 18%
Factors:
BULLISH WEDGE BREAKOUT
Trend Following
Rising Volume with rising Prices.
Flag pattern breakout.
Pennant Pattern Breakout with Bullish Candle.
Retest Successful.
Higher Highs & Higher Lows.
Broken above RESISTANCE levels
Trading at SUPPORT levels
Earnings are strong.
Bullish Wedge Breakout
Risk Return Ratio is healthy.
And
Rising from Double Bottom Pattern to Flag Pattern forming.
If you like my work KINDLY LIKE SHARE & FOLLOW this page for free Stock Recommendations.
With 💚 from Rachit Sethia

HnS in TCSTCS and all other IT Stocks looking weak, keep TCS on radar for selling, sell after breaking the neckline.

OGN ANALYSIS
#OGN UPDATE.
#OGN ids currently trading in a rising wedge and on losing the support OGN might test the previous support on daily,keep eyes as the move could be sharp.


#MtarTech #MINDTREE #LTI #LTTS #INFY #TCS #CNXIT #WIPRO #COFORGE#MTARTECH
NSE: MTARTECH
CMP: 1737.80
TARGET: 2200
SL: 1550
RR: >2.5 times
Return > 26%
Timeframe: <6M
CAN BREAK ALL-TIME HIGH IN FUTURE
Factors:
BULLISH WEDGE BREAKOUT
Trend Following
Rising Volume with rising Prices.
Flag pattern breakout.
Pennant Pattern Breakout with Bullish Candle.
Retest Successful.
Higher Highs & Higher Lows.
Broken above RESISTANCE levels
Trading at SUPPORT levels
Earnings are strong.
Bullish Wedge Breakout
Risk Return Ratio is healthy.
And
Rising from Double Bottom Pattern to Flag Pattern forming.
If you like my work KINDLY LIKE SHARE & FOLLOW this page for free Stock Recommendations.
With 💚 from Rachit Sethia

TCS broke the resistanceTCS Broke the resistance 3400
Though it is in overbought zone still wait for confirmation as all IT stock will move soon

TCSIn previous chart we have bullish and also we have a bullish on this chart I'm going to buy for swing trade if price cross 3272

TCS - Short Term viewTCS is currently travelling in the upward channel. It may go up until it breaks the bolded trendline. In case it breaks, it may come down ~ 3280 - 3300 by end of this expiry
Incidentally, 38% of retracement from Jan 22 fall comes arond 3358. Closing above may lead to ~3500 which is at 50%.

Trendline Breakout in TCSTcs and entire IT sector under selling pressure
Because of Fii selling it stocks
Now fii buying IT stocks
Tcs currently breaking trendline
Good above 3250 for target of 3500
3800

TCSTcs makes bottom now it can go up or consolidate here the trendline can be magnetic line if market goes bullish then highly possibilities to go up......

TCS BULLISH Pinbar at breakoutTCS very bullish at CMP 3217, SL 3160, Targets- 3400, 3500, 3700
TCS just broke out of a year long downtrend, and with less than a 3% risk, one can aim for amazing returns.
This idea is based on the pinbar on the last trading day and for a better trade, advisable condition would be a breakout above 3275 with an SL of previous swing.

#TCS Weekly Major Support & Resistance Levels.Providing Weekly Support and Resistance levels for next coming week based on Central Pivot Range and its major support & resistance levels of week, where price can take support and face resistance. Three black lines indicating weekly Central Pivot Range. Previous week high & low also performs as a major support and resistance levels. Can take long & short positions according to how price perfoms at particular given support & resistance levels.


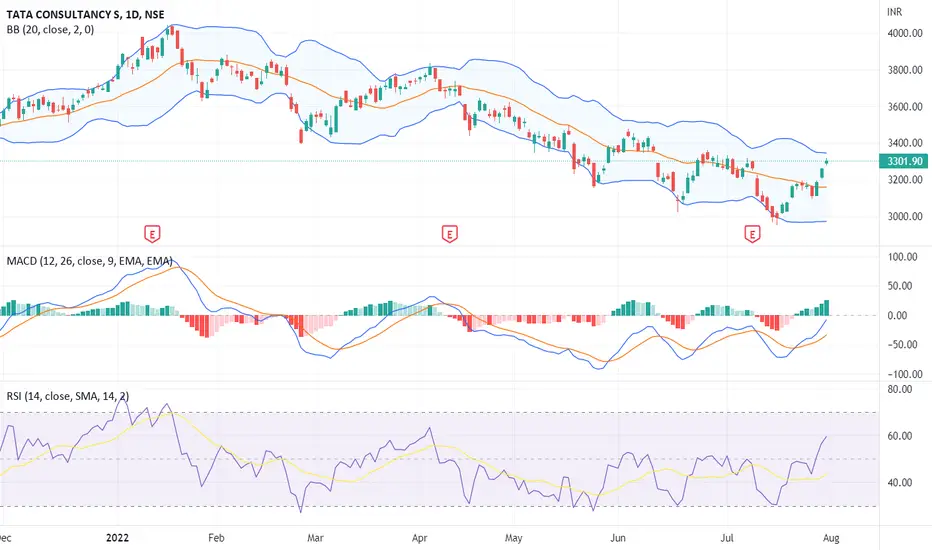
TCS - INDICATOR ANALYSIS📊 Script: TCS
📊 Nifty50 Stock: YES & Nifty IT
📊 Sector: Information Technology Services.
This stock pick is according to my study. I have use 4 indicator that is
BOLLINGER BAND
MACD
RSI
DOUBLE MOVING AVERAGE
📈 Stock is trading near at upper band of BB.
📈 There is MACD crossover.
📈 RSI is around 59.
📈 There is crossover of double moving average.
🟢 Target 🎯🏆 - 3498
⚠️ Stoploss ☠️🚫 - 3231
⚠️ Important: Always maintain your Risk & Reward Ratio.
✅Like and follow to never miss a new idea!✅
Disclaimer: I am not SEBI Registered Advisor. My posts are purely for training and educational purposes.
TCS ( 1H Time Frame )We Have A Breakout in TCS - 1 Hrs Time Frame
Good Stock For Long Term
• Good Results
• Fundamental Strong
• Also Give Dividends
20% Discount From All Time High.
Can Hold For Long Term..
