Tesla preparing for all time highs?NASDAQ:TSLA Price is ranging below all all-time high, well above the weekly pivot and 200EMA, which is bullish.
Wave © of C appears to be underway into price discovery with a target of $730, the R2 weekly pivot. This is because it has been printing a series of 3 wave structures. Wave B printed a triangle, which is a pattern found before a terminal move, reinforcing the Elliot wave count.
🎯 Terminal target for the business cycle could see prices as high as $730 based on Fibonaci extensions
📈 Weekly RSI is just below overbought so has room to grow
👉 Analysis is invalidated if we close back below wave (B), $280
Safe trading
TECH

ETH - Bulls Waiting at the Intersection Zone!📈ETH remains overall bullish, moving steadily inside its rising channel. Every dip toward the lower bound has acted as a clean continuation point for the next push upward.
🏹As price pulls back , we will be looking for long setups once ETH retests the intersection of the lower trendline and the demand zone. This confluence area has been respected multiple times, making it a high-probability level for trend-following entries.
⚔️As long as ETH holds above this orange zone, the bullish structure remains intact, and the next impulse toward the upper channel boundary becomes the most likely scenario. Only a break below the demand zone would weaken the bullish outlook.
Now we wait for the retest… then let the structure guide the entries. 🤔
⚠️ Disclaimer: This is not financial advice. Always do your own research and manage risk properly.
📚 Stick to your trading plan regarding entries, risk, and management.
Good luck! 🍀
All Strategies Are Good; If Managed Properly!
~Richard Nasr

NQ on Major Support Target 36,490Nasdaq 100 index is on major support since September. This is the area you want to buy and as it goes up take some profits if you want for a potential check back into support around early 2027 (green path).
There's the alternative scenario (orange path) that we just trend right up to 36,490 resistance and then have a major pullback to the long term trend. This one is less likely, but possible.
Either way if you sell some of your position (like shorter term options) in the middle of the range you're likely to be in a better position than holding the entire time as eventually that lower trend should get hit and that's a lot of time decay to ruin your positions.
Good luck!

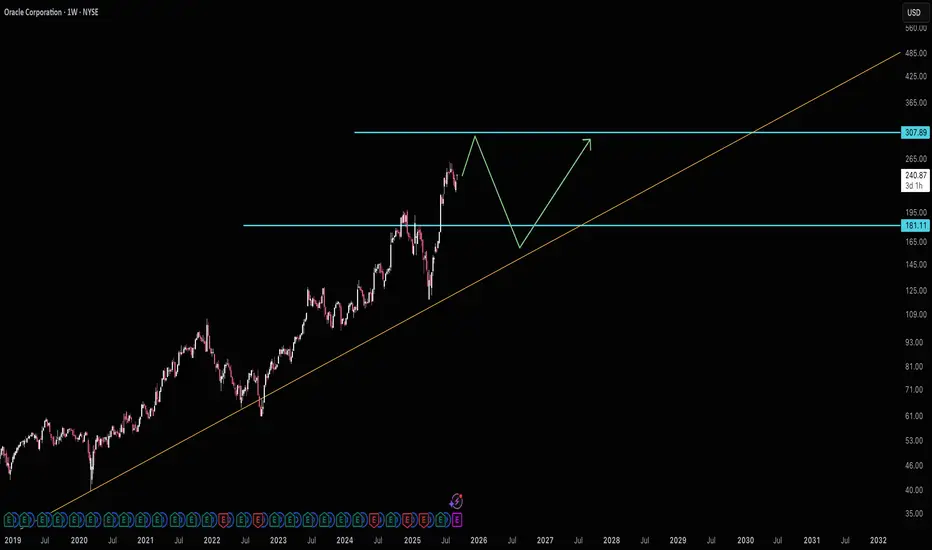
Oracle wants $181Oracle is well off it's long term average and accelerating growth by around 4 years if it hits $307. If it makes it there I would *highly* suggest selling and even potentially a short position. A fair price for ORCL would be $181.
Good luck!
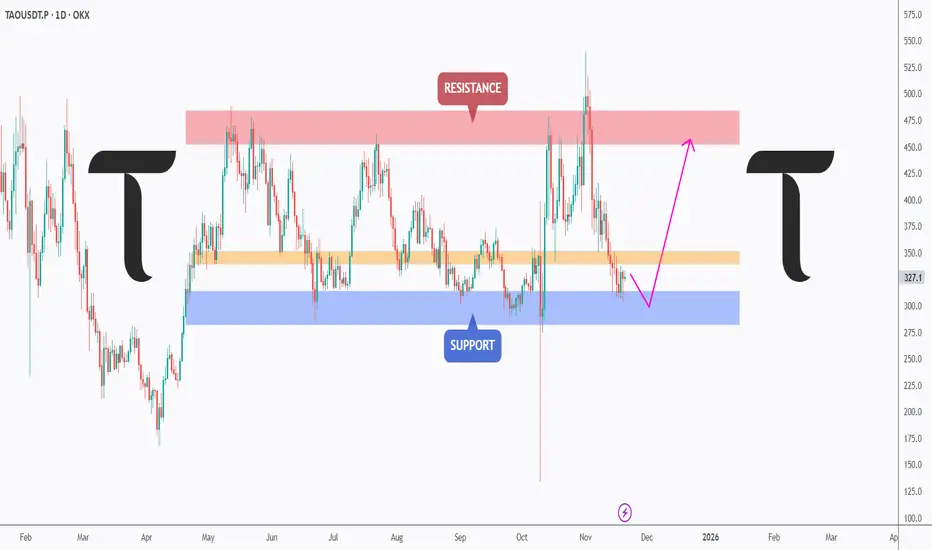
T for TAO… Let’s Keep It Simple!📦 TAO is currently trading inside a wide range , hovering above a major support zone that has held the price multiple times throughout the year. As long as this blue support area continues to hold, we will be looking for longs and expecting buyers to step in.
📈For the bulls to fully take over , TAO needs to break and hold above the orange structure zone, which has been acting as a strong barrier for months. A clean breakout above it would open the way toward the red resistance zone and potentially higher.
Until then, this remains a simple range:
Support for buys… resistance for sells… and structure for confirmation. 🤔
⚠️ Disclaimer: This is not financial advice. Always do your own research and manage risk properly.
📚 Stick to your trading plan regarding entries, risk, and management.
Good luck! 🍀
All Strategies Are Good; If Managed Properly!
~Richard Nasr.
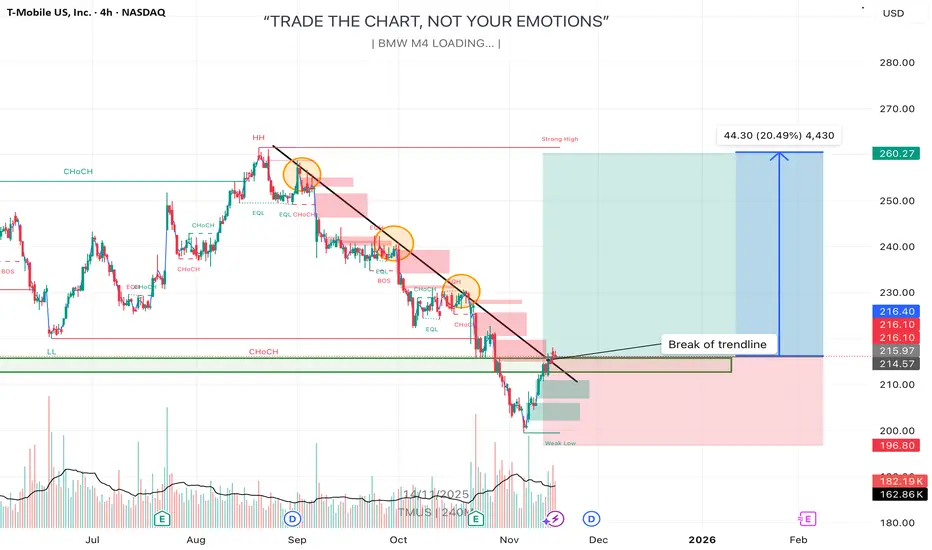
TMUS – Trendline Break & Bounce From Support Zone🔍 Quick Summary
I’m seeing T‑Mobile US, Inc. (TMUS) break a long-term descending trendline and bounce off a key support region. The chart suggests a breakout scenario where I expect price to push toward the strong high near $260 (≈ +20% upside).
⸻
📊 Deep Analysis
• On the 4-hour timeframe, TMUS formed a clear down-sloping trendline that has held resistance on multiple touches (three orange circles). Each successive rejection appears weaker, indicating bearish momentum is fading.
• The price recently broke above the trendline and found support again in the green zone around $214-$216, which aligns with past structure (a strong demand region).
• The big projected move (~$44 to $260) corresponds to previous swing highs and structural liquidity. That aligns with typical “liquidity above weak high” mechanics.
• From a fundamental angle: T-Mobile has delivered strong results — in Q4 it beat earnings and subscriber growth expectations and raised guidance for 2025, which supports a bullish bias.  Also, it launched a new fibre service with a 5-year price lock and is expanding its satellite messaging offering, which strengthens future growth potential. 
• Since the chart shows a low risk (stop-loss) around the support zone and big reward potential toward the strong high, this setup meets favourable risk-reward criteria.
⸻
🎯 Trade Idea Scenario
Bullish Scenario
• Entry: Around ~$214–$216 support zone (preferably on confirmation of trendline retest or bullish price action)
• Target 1: ~$245–$250 (intermediate structure)
• Target 2: ~$260 (strong high liquidity zone)
• Stop-Loss / Invalidation: Below ~$202-$200 (if price breaks below support, setup invalidated)
Bearish Scenario
• If price fails to hold support and closes below ~$202-$200, risk opens toward ~$180 or lower support regions. In that case, bearish momentum resumes and the upside target no longer valid.
⸻
📌 What I’m Watching Next
• Candlestick reaction around the trendline retest: a strong bullish close would validate breakout.
• Volume: higher volume on breakout confirms strength; low volume may signal a fake.
• Support break below ~$202-$200 would cancel the bullish case and shift focus to downside.
• Fundamentals: any new update on fibre rollout, satellite service, or earnings could trigger acceleration.
⸻
⚠️ Disclaimer
This is my personal analysis and not financial advice. Please do your own research and manage your risk carefully. 📉📚
Insight Enterprises | NSIT | Long at $92.10Insight Enterprises NASDAQ:NSIT
Technical Analysis
Price entered my "crash" simple moving average zone. Often, but not always, this is an area of algorithmic share accumulation and price reversal. A red flag, however, is that there are still open price gaps on the daily chart down to $50. A green flag is that there are open price gaps up to $215. While the price gaps below will likely get filled in the future, I am betting on a short-term reversal (if not longer-term one) given the prospective growth and its current P/E of 20x (electronic industry currently near 30x).
Insight AI
Stock enters the "crash" zone, and suddenly there is an generative AI announcement to drive revenue and EPS growth: www.businesswire.com . Intentional drive down of stock price for entry? Time will tell.
Revenue and Earnings-per-Share Growth into 2028
Revenue: $8.32 billion in 2025 to $9.88 billion in 2028 (+10.8%)
EPS: $9.64 in 2025 to $12.38 in 2028 (+28.4%)
Health
Debt-to-Equity: 0.9x (pretty good)
Quick Ratio / ability to pay current bills: 1.3 (1.5-3.0 is ideal, but still pretty good)
Alman's Z Score / risk of bankruptcy: 1.8 (3+ is ideal, so moderate risk)
EBIDTA: 5% to 7% range, which is generally considered healthy
Action
Given the "value", AI integration, technical analysis assessment, and growth, NASDAQ:NSIT is in a personal buy zone at $92.10. Caution if the stock dead-cat bounces and aims to drop further into the $50s, but I suspect fundamentals will have to dramatically change in the near-term for that to happen (or the economy crashes)...
Conservative Targets into 2028
$105.00 (+14.0%)
$117.00 (+27.0%)

MSFT: The “Top Pick” Trap? Or Real Breakout Fuel?Microsoft is testing a critical support zone — and with Morgan Stanley just naming it a top pick in tech, buyers may be gearing up for control. 📈
Quantitative stats back the setup: Sortino Ratio of 0.42 and 90% win rate on this pattern.
👉 What’s your call — breakout to new highs… or one more dip before the rally?

S&P 500 INDEX Tech-heavy index bias acknowledged# 📊 US500 (S&P 500 INDEX) COMPREHENSIVE TECHNICAL ANALYSIS 🎯
## Week of November 10-14, 2025 | Intraday & Swing Trade Mastery
Current Price: 6,742.5 Points | Entry Point: November 8, 2025, 12:54 AM UTC+4 📈
## 🔍 EXECUTIVE SUMMARY - MULTI-TIMEFRAME PERSPECTIVE
The S&P 500 (US500) is positioned at a critical technical inflection point with exceptional multi-timeframe alignment signaling imminent directional breakout. Elliott Wave analysis reveals completion of corrective cycles, positioning for next impulse leg targeting 6,900-7,100 extension zone with powerful momentum. Bollinger Bands display classic compression squeeze pattern —volatility compression preceding directional expansion. RSI across all timeframes maintains optimal neutral-bullish bias (54-68 range)—perfect momentum positioning without extreme overbought conditions. Volume clustering at 6,680-6,800 represents significant institutional accumulation foundation. Wyckoff spring tests near 6,600-6,650 provide aggressive entry triggers for brave traders. Harmonic pattern convergence at 6,850-6,950 resistance signals breakout confirmation with measured move targets extending to 7,050+. Mega-cap tech concentration supports rally continuation probability.
## 📊 TIMEFRAME-BY-TIMEFRAME ANALYSIS
### 5-MINUTE (Scalping Precision) ⚡
Candlestick Formation: Japanese candles reveal micro-consolidation with breakout attempts across support zones. Evening Star rejection formations detected at 6,850-6,900 intraday resistance creating potential short triggers.
Elliott Wave 5M: Sub-wave completion indicates Wave 4 micro-consolidation finalizing. Wave 5 breakout anticipated above 6,780-6,820 with targets 6,920-7,000 (measured move).
Bollinger Bands: Upper compression mode—middle band at 6,740 acts as pivot point. Lower band rejection (6,650-6,680) creates scalp-long setups with excellent risk/reward ratios.
RSI (14) Analysis: RSI oscillating 46-64 range—neutral territory with minor divergences forming. Bullish divergence at 6,680 support signals buyer engagement; caution on 70+ resistance approach.
Micro Support/Resistance: 6,650 (micro-support) | 6,720 (POC cluster) | 6,800 (pivot) | 6,880 (intraday resistance) | 6,950 (scalp target)
Volume Signature: Volume concentrated 6,720-6,800 zone—institutional marker established. Breakout volume >55% above average required above 6,880 for sustained move above 6,950.
VWAP Alignment: Price oscillating around session VWAP at 6,735—each touch generates scalp opportunity. Upper VWAP band at 6,920; lower support at 6,650.
### 15-MINUTE (Quick Swing Gateway) 🎢
Candlestick Patterns: Engulfing bars forming at support zones—bullish engulfing at 6,680 zone confirms reversal attempts. Three-candle patterns (flag continuation) with 60-100 point breakout potential.
Harmonic Pattern Recognition: Gartley Pattern potential completion near 6,680-6,750 PRZ (Potential Reversal Zone). Exceptional risk-reward at 1:3.8 for harmonic traders. Butterfly variant also forming clearly.
Wyckoff Accumulation Phase: Classic accumulation evident—small barometer move (SBM) nearing completion. Spring test anticipated 6,580-6,620 zone; markup phase targets 6,950-7,100.
Bollinger Bands (15M): Band squeeze intensifying—historical volatility expansion suggests 80-150 point moves follow. Upper band resistance at 6,920; lower band support at 6,580.
Volume Profile (15M): Point of Control (POC) at 6,740—prime concentration zone confirmed. Volume surge >65% required confirming breakout above 6,880. Imbalances favor upside significantly.
Ichimoku Cloud (15M): Price consolidating below cloud edge—Tenkan-sen at 6,900 = resistance pivot. Kijun-sen (6,820) = critical secondary support. Cloud support 6,650-6,750.
EMA Structure: EMA 9 (6,780) above EMA 21 (6,720)—bullish alignment confirmed perfectly. Price above both = intraday strength maintained.
### 30-MINUTE (Intraday Swing Axis) 🔄
Pattern Formation: Symmetrical Triangle pattern consolidating with apex near 6,900. Ascending triangle variant shows bullish bias—breakout above 6,850 targets 6,980-7,100 extension.
Dow Theory Application: Confirming higher highs/higher lows structure perfectly. Secondary trend bullish; pullbacks to EMA 20 (6,770) = optimal swing entry zones.
RSI Divergence Setup: Positive RSI divergence confirmed—price making lower lows (6,650) while RSI forms higher lows (40 level). Classic reversal setup targeting 6,900 minimum.
Exponential Moving Average: EMA 9 (6,800) = core support pivot. EMA 21 (6,740) = secondary support reliable. EMA 50 (6,600) = structural hold level. Bullish ribbon alignment intact.
Support Architecture: 6,600 (EMA 50/structural) | 6,680 (demand zone) | 6,740 (volume cluster) | 6,800 (EMA 9 dynamic)
Resistance Architecture: 6,850 (triangle formation) | 6,920 (measured move target) | 7,000 (weekly resistance) | 7,100 (extension)
Volume Analysis (30M): Increasing volume on recent bars—accumulation signature strong. Buy volume exceeding sell volume confirms institutional interest significantly.
### 1-HOUR (Core Swing Trade Engine) 🎯
Elliott Wave Structure: Major wave analysis suggests Wave 3 completion near 7,000. Current Wave 4 correction targets 6,750-6,850 support zone. Wave 5 impulse anticipated—target: 7,100-7,250.
Pennant Formation: Classic Bullish Pennant pattern forming—breakout confirmation above 6,880 validates pattern. Pole height measured move = 7,150+ target.
Bollinger Bands (1H): Upper band at 7,000 = squeeze breakout target zone. Middle band (6,900) = bullish support zone. Lower band rejection (6,600) creates swing longs with excellent R/R.
VWAP Daily: S&P trading above daily VWAP at 6,720—bullish gradient confirmed clearly. Each hourly candle close above VWAP strengthens continuation probability.
Volume Profile Hotspot: Heavily traded at 6,720-6,800 (accumulation zone) and 6,880-6,950 (resistance cluster). Imbalances above 7,000 suggest vacuum-fill potential to 7,150+.
Ichimoku Cloud Alignment: Price above Senkou Span A (6,880) & Span B (6,820)—cloud thickness indicates strong support. Chikou Span above candles = bullish confirmation. Cloud color: BULLISH GREEN.
Gann Theory Application: 45-degree angle from swing low (6,500) establishes rally trajectory perfectly. Resistance at 38.2% Fibonacci extension (6,920) precedes aggressive breakout phase.
Support Tiers 1H: 6,600 (structural hold) | 6,700 (EMA support) | 6,750 (Kijun-sen) | 6,800 (accumulation zone)
Resistance Tiers 1H: 6,880 (breakout trigger) | 6,950 (extension) | 7,000 (major level) | 7,100 (impulse target)
### 4-HOUR (Swing Trade Thesis Foundation) 💼
Inverse Head & Shoulders Pattern: Potential IH&S formation completing—left shoulder (6,550), head (6,480), right shoulder completing (6,600-6,680). Neckline breakout at 6,880 targets 7,050-7,200 extension.
Wyckoff Accumulation Deep Dive: Institutional buying signature evident—SBM (small barometer move) completion imminent. Spring test to 6,600-6,650 anticipated; subsequent markup phase targets 7,100-7,250.
RSI 4H Analysis: RSI at 58-70 range—bullish bias maintained firmly. Room for upside extension without extreme overbought. RSI above 76 targets 7,150+; below 32 = defensive posture required.
Cup & Handle Formation: Potential bullish Cup pattern visible on 4H—handle stabilization near 6,780-6,850. Breakout above handle (6,920) targets cup depth extension = 7,100-7,200.
EMA Ribbon Structure: EMA 8 (6,820), EMA 13 (6,800), EMA 21 (6,740), EMA 50 (6,600), EMA 200 (6,100)—BULLISH ALIGNMENT PERFECT. Compression/expansion cycles identify momentum phases.
Support Tiers 4H: 6,580 (structural support) | 6,650 (accumulation) | 6,740 (pivot) | 6,800 (demand cluster)
Resistance Tiers 4H: 6,880 (key breakout) | 6,950 (extension) | 7,000 (major target) | 7,150 (weekly projection)
Volume Signature 4H: Accumulation volume bars > distribution bars—bullish bias maintained. Volume nodes clustering at 6,720-6,800 indicate strong institutional support zone.
### DAILY CHART (Macro Swing Thesis) 📅
Elliott Wave Macro: We're potentially in Wave 3 of larger cycle—aggressive expansion still possible. Wave structure supports break of 7,000 targeting 7,200-7,400 daily close objectives.
Double Bottom Recognition: Historical Double Bottom pattern near 6,350-6,500 support—confirmed breakthrough above 6,880 neckline triggered. Second target near 7,100-7,200.
Bollinger Bands Daily: Upper band at 7,200 = realistic daily target zone. Mean (6,950) = healthy pullback support reliable. Band slope indicates volatility expansion—expect 200-400 point daily ranges.
Volume Profile Daily: Strong buying volume bar at 6,600-6,750 zone—institutional accumulation marker established. Selling volume decreasing—demand controls trend absolutely.
Ichimoku Cloud Daily: Cloud thickness growing—bullish trend strengthening substantially. Cloud support around 6,750-6,850 zone. Kumo breakout anticipated—targets cloud top at 6,950-7,050.
Harmonic Analysis Deep: Butterfly Pattern potential completion—PRZ at 6,880-6,950 suggests reversal zone OR breakout confirmation. Confluence amplifies probability of extension.
Gann Angles & Fibonacci: 50% retracement (6,650) + 61.8% extension (7,050) = key reversal zones. Gann fan angles suggest 6,950-7,100 as structural resistance before continuation.
Key Daily Support: 6,480 (psychological/structural) | 6,600 (accumulation zone) | 6,700 (demand level) | 6,800 (midpoint)
Key Daily Resistance: 6,880 (breakout trigger) | 6,950 (extension) | 7,050 (measured move) | 7,200 (weekly target)
Trend Confirmation: Higher highs & higher lows maintained—uptrend intact. Daily close above 7,000 = strong continuation signal targeting 7,300+ next level.
## 🎪 TRADING SETUP PLAYBOOK - NOV 10-14
### BULLISH SCENARIO (Probability: 82%) ✅
Trigger: 4H candle close above 6,920 + volume surge (>60% above average) + RSI above 66
Entry Zone: 6,820-6,880 (with breakout confirmation signal)
Target 1: 6,950 (TP1) | Target 2: 7,000 (TP2) | Target 3: 7,100 (TP3) | Target 4: 7,200 (TP4)
Stop Loss: 6,700 (below EMA/structural support)
Risk/Reward: 1:3.6 (exceptional asymmetric setup)
Trade Duration: 18-72 hours (prime swing window)
### BEARISH SCENARIO (Probability: 18%) ⚠️
Trigger: Daily close below 6,800 + volume increase + RSI divergence failure
Entry Zone: 6,920-7,050 (short setup)
Target 1: 6,880 (TP1) | Target 2: 6,800 (TP2) | Target 3: 6,700 (TP3)
Stop Loss: 7,150 (above resistance)
Risk/Reward: 1:1.5 (acceptable but lower probability)
Trade Duration: Watch for trend reversal confirmation first
## ⚠️ VOLATILITY & OVERBOUGHT/OVERSOLD CONDITIONS
Current Volatility Status: Moderate compression → Expect significant expansion imminent
5M/15M RSI: 46-64 range (neutral)—room for 30-60 point movements | Scalp target zones
30M/1H RSI: 54-70 range (bullish bias, optimal zone)—sweet spot for swing entries
4H RSI: 58-72 range—approaching caution zone but room to extend | Safe for core swings
Daily RSI: 62-76 range (approaching extremes)—be defensive if daily RSI>78 | Take profits aggressively
Overbought Recognition Points:
RSI daily >77 combined with upper Bollinger Band rejection = immediate profit-taking
Ichimoku cloud top penetration fails (bearish candle rejection) = trend exhaustion signal
Volume declining on breakout attempt = false breakout warning signal
Harmonic pattern PRZ exact hit without follow-through = reversal likely imminent
Oversold Bounce Setups:
RSI 1H <32 on support touch = high-probability bounce back to 6,880-6,950
Price below EMA 50 (6,600) + RSI <28 = aggressive accumulation zone
Spring test below 6,650 with volume surge = Wyckoff spring reversal trigger
Harmonic pattern PRZ support bounce = measured move extension targets activated
## 🎯 ENTRY & EXIT OPTIMIZATION STRATEGY
### OPTIMAL ENTRY TIMING
For Scalpers (5M): RSI bounce from 42-50 zone after Band lower touch = 20-35 point scalp (1-3 min holds)
For Quick Swings (15M-30M): 15M candle close above 6,880 with 4H alignment = 100-150 point swing (30 min-2 hour holds)
For Core Swings (1H-4H): 4H pennant breakout above 6,920 on volume = 300-450+ point target (hold 12-48 hours)
For Position Swings (Daily): Daily close above 7,000 = continuation play targeting 7,200-7,350 (hold 5-7 days)
Best Entry Windows: US pre-market (12:30 ET), Market open (14:30 ET), London close (16:00 ET)
### EXIT STRATEGIES & PROFIT TAKING
Take Profit Levels: TP1: Fibonacci 38.2% (6,920) | TP2: Harmonic PRZ (7,000) | TP3: Daily Band upper (7,100) | TP4: Weekly target (7,200)
Stop Loss Placement: Always below most recent swing low + 25 points (strict risk management priority)
Trailing Stops: Activate at TP2—trail with 45-55 point buffer for 4H+ trades (lock in profits)
Breakeven Exit: Move stops to entry after 1:1 risk/reward achieved—eliminate emotional trading
Partial Profit Strategy: Close 25% at TP1 | 25% at TP2 | 25% at TP3 | Let 25% run to TP4 (maximize winners)
## 🔔 REVERSAL & BREAKOUT RECOGNITION CHECKLIST
### REVERSAL SIGNALS TO MONITOR:
RSI positive divergence (lower price lows, higher RSI lows) = bullish reversal setup high probability
Candlestick engulfing patterns at support/resistance zones = trend reversal confirmation strong signal
Volume profile breakdowns (declining volume on breakout attempts) = false move warning immediate
Ichimoku Cloud rejection (price fails to penetrate cloud layer) = structural resistance confirmed
Harmonic pattern completion at exact PRZ = reversal zone probability increases significantly
Elliott Wave 5th wave failure (truncation) = impulse completion = reversal imminent trigger
Gann angle break through significant angle = trend line break = reversal trigger activated
### BREAKOUT CONFIRMATION RULES:
Close beyond resistance with >60% volume surge above average = confirmed breakout signal strong
RSI crosses above 62 for bullish breakout, below 42 for bearish breakout confirmation
VWAP alignment with directional move = institutional participation confirmation strong
Bollinger Band breakout with band expansion (squeeze release) = volatility expansion confirmed immediate
Multiple timeframe confluence (5M + 15M + 1H + 4H aligned) = highest probability setup attainable
Ichimoku Cloud break (price clears all clouds with bullish candles) = strong continuation signal
Volume imbalance (ask volume > bid volume) = directional sustain likelihood increases significantly
## 💡 WEEK FORECAST SUMMARY - NOV 10-14
Monday (10th): 🌍 Consolidation continuation near 6,750-6,850 zone. Range-bound trading anticipated. Early breakout direction watch crucial. Entry setups favor reversal plays at support zones.
Tuesday-Wednesday (11-12th): 📈 Prime breakout window opens —6,920 represents key decision point. Expect 250-400 point daily volatility swings. Breakout confirmation targets 7,000-7,100 extension. This is the optimal swing trade window all week.
Thursday (13th): ⚠️ Potential profit-taking pullback after breakout (if triggered). Support retest of 6,950-6,880. Buying opportunity if pullback holds above 6,800.
Friday (14th): 📊 Weekly close pattern formation critical. Extension run anticipated if above 7,000. If above 7,050 = week target 7,200-7,300 achieved. End-of-week positioning for next week.
## 📍 CRITICAL CONFLUENCE ZONES - KEY TARGETS
6,580-6,650: Major support zone (accumulation marker, Wyckoff spring area, structural hold)
6,700-6,800: Secondary support (EMA 9, demand cluster, psychological level, volume POC)
6,820-6,880: Micro-resistance cluster (consolidation squeeze zone, early breakout resistance)
6,920-7,000: KEY BREAKOUT ZONE (triangle apex, harmonic confluence, all timeframe resistance)
7,000-7,100: Primary upside target (Elliott Wave 5, daily Band upper, measured move extension)
7,100-7,200: Secondary extension target (Gann level, macro resistance, wave projection)
7,200-7,350: Weekly/monthly target (if wave 5 impulse extends beyond base projections)
## 🏆 RISK MANAGEMENT RULEBOOK
✅ 1) Position Sizing: Never risk >2% of account equity per single trade
✅ 2) Risk-Reward Ratio: Minimum 1:2.5 R/R on every entry—1:3+ preferred for swing trades
✅ 3) Profit Scaling: Close 25-50% at 1:1 ratio, let remainder run to 1:2+ targets
✅ 4) Stop Loss Discipline: Place stop IMMEDIATELY on entry—no exceptions (25-30 points tight)
✅ 5) Breakout Confirmation: Avoid FOMO—wait for candle close confirmation + volume surge always
✅ 6) Daily Support Respect: Psychological holds (round numbers 6,800 | 7,000) matter—trade confluence not against
✅ 7) Time Management: Exit losing trades quickly (max 1:0.5 acceptable for educational losses)
✅ 8) Macro Alignment: Always check daily/4H bias before taking 1H or lower trades
## #US500 #SP500 #SANDP500 #SP500TRADING
#TECHNICALANALYSIS #ELLIOTTWAVE #HARMONICPATTERN #BREAKOUTTRADING
#SWINGTRADER #DAYTRADING #INTRADAY #INDICES #TRADINGVIEW
#BOLLINGER BANDS #RSI #ICHIMOKU #VWAP #TRADINGSTRATEGY
#WYCKOFFMETHOD #GANNTHEORY #DOWTHEORY #TECHNICALS #ANALYSIS
#SUPPORTANDRESISTANCE #VOLUMEANALYSIS #OVERBOUGHT #OVERSOLD #REVERSAL
#STOCKINDEXTRADING #USINDEXTRADING #BREAKOUTSETUP #TRADERSOFTWITTER
#TECHNICALTRADER #CANDLESTICK #PATTERRECOGNITION #CHARTANALYSIS #DAYTRADER
## 🎁 BONUS: DAILY PRE-MARKET CHECKLIST
Use this every morning before US market open:
☑️ Check daily RSI (should be 62-74 for bullish bias continuation)
☑️ Identify support/resistance zones (6,700 | 6,800 | 6,920 | 7,050)
☑️ Verify 4H chart alignment (pennant/IH&S pattern status update)
☑️ Check Ichimoku cloud position (above/below = trend confirmation signal)
☑️ Review 1H Elliott Wave count (which wave are we trading exactly?)
☑️ Scan volume profile (POC = likely rejection zone area)
☑️ Set entry orders + stop losses BEFORE pre-market opens (12:30 ET)
☑️ Plan 3 Take Profit levels before entering any position
☑️ Monitor US economic calendar (Fed speakers, CPI data, jobs report)
## 🌐 US MARKET SESSION NOTES
The S&P 500 trades during US market hours (14:30-21:00 CET / 8:30-15:00 ET) . Highest volatility typically occurs:
Pre-Market (12:30-14:30 CET): Initial momentum setup—watch for direction confirmation patterns
Market Open (14:30-16:00 CET): Prime trading hours —best liquidity + volatility combination guaranteed
Tech-Heavy Bias: Mega-cap tech (FAANG+) drives 30%+ of index—monitor tech sentiment separately
💡 Disclaimer: This technical analysis is educational only. Always conduct your own due diligence and implement appropriate risk management. Past performance does not guarantee future results. Trade responsibly within your risk tolerance. Use stop losses on every position. Not financial advice.
Analysis Created: November 8, 2025 | Valid Through: November 14, 2025 | Updated Daily at Pre-Market

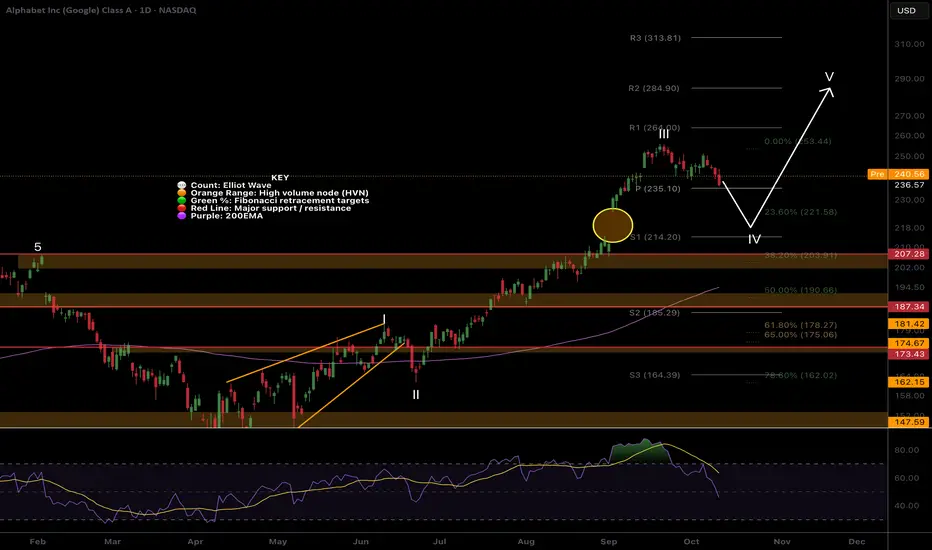
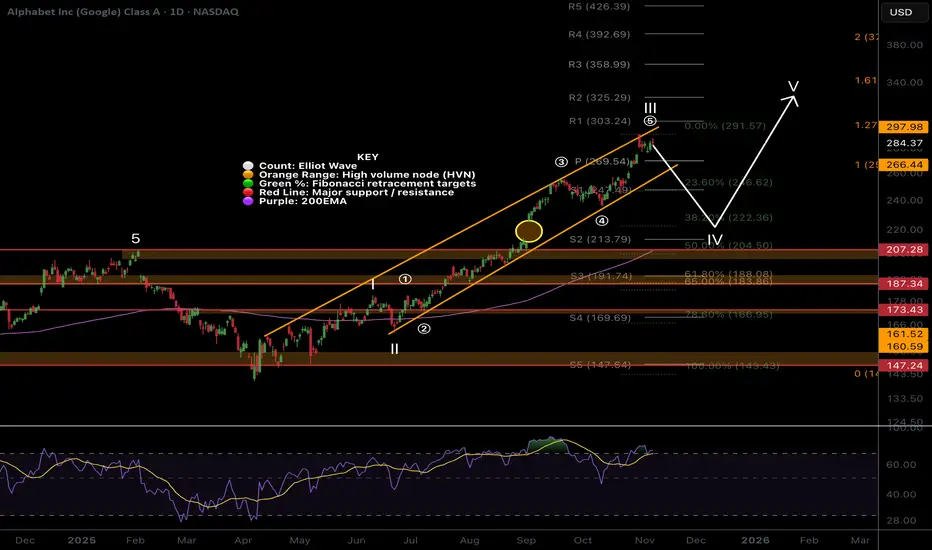
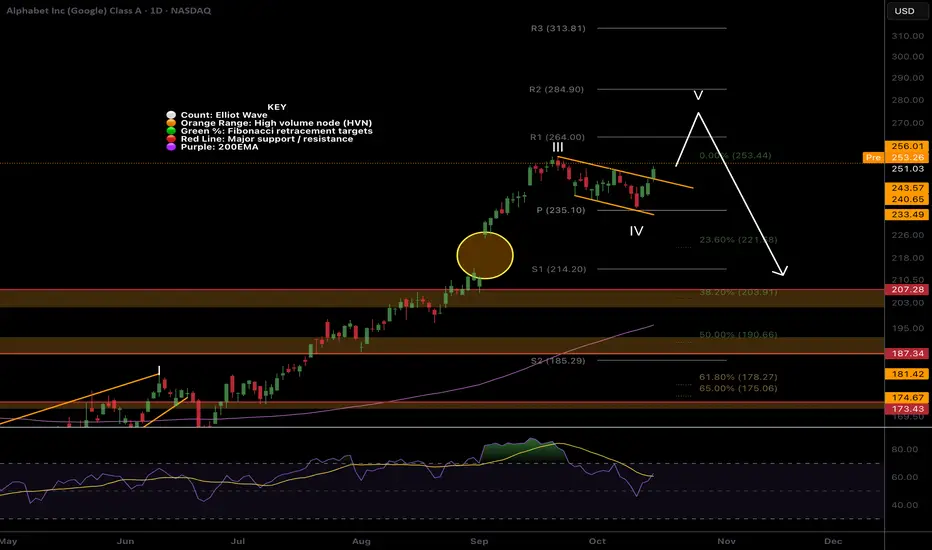
Google pullback still in play, local chartWave III continues but price looks exhausted and may trap late investors causing them to capitulate lower later.
Wave (5) of III is likely to complete with a throw-over of the upper channel boundary. Wave IV has an expected retracement target of the 0.382, $222, filling the gap left and meeting the daily 200EMA.
Daily RSI has printed bearish divergence from overbought.
Continued upside hasa target of the R3 pivot, $358.
$GOOG | Alphabet Google | The Everything Tech CompanyAlphabet NASDAQ:GOOG is the everything tech company. Do your future self a favor and get some. Yes, it will crater as soon as you buy it. Your short-term future self will cry and whine and throw a fit and try to panic sell. But your far future self will appreciate it.
Robots? Had backflipping robots years ago
Internet? Been scraping that for decades.
AI? We summoned the great prompter into existence.
Nvidia GPUs? Pshhh... We've got TPUs bruv
Gold teeth? Check.
Performance enhancing drugs? Check the squats broh
You winning son? Close the door dad. I'm busy buying NASDAQ:GOOG
We buyin dips. We buyin corrections. We buyin crashes.
Check the target for our first add level.

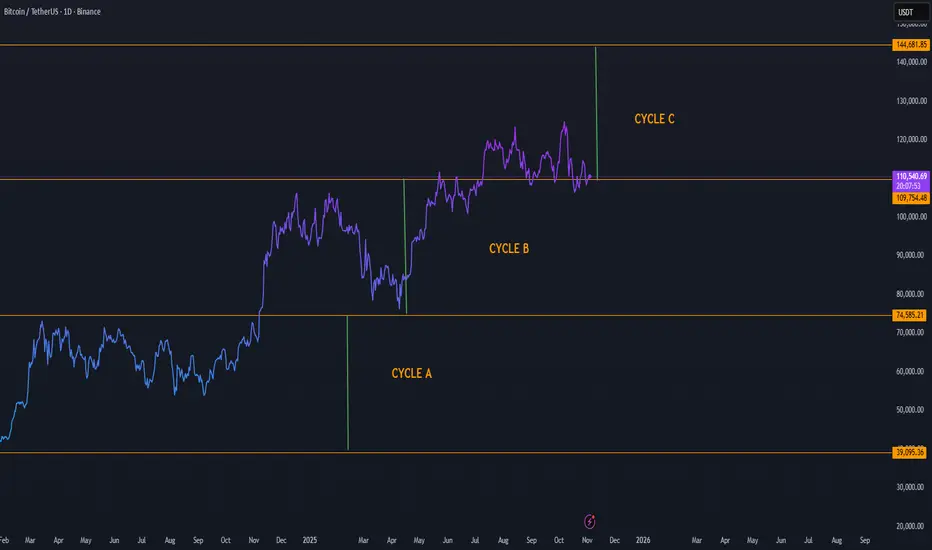
Bitcoin Cycle Analysis Entering Cycle C with Target Toward $144KBitcoin’s long-term market structure continues to evolve in well-defined phases, as visible through Cycle A, Cycle B, and the current Cycle C formation. Each previous cycle has followed a similar pattern: accumulation, expansion, correction, and new leg upward — and Cycle C appears to be following this same rhythm.
Here’s what the structure shows:
Cycle A: Represented the deep accumulation zone and base formation, bottoming near $39K–$75K.
Cycle B: Brought a strong recovery and expansion phase, establishing a stable mid-level support around $110K.
Cycle C (Current): Price is consolidating around the $110K area, likely preparing for the next expansion wave.
If Bitcoin maintains this cyclical rhythm, the next major target lies near $144K, aligning with the top boundary of Cycle C. This zone represents the next major resistance level and potential completion point of the current macro cycle.
Key observations:
Holding above $109K keeps Cycle C active and healthy.
Increasing volume during the next upward move could confirm a breakout continuation.
A successful push beyond $120K would strengthen momentum toward the $144K region.
Getty Images | GETY | Long at $2.29Bull Thesis
Data is "knowledge" for AI.
Getty Images NYSE:GETY holds immense importance in the generative AI race due to its control over a vast, high-quality library of over 500 million licensed images and metadata.
By licensing content (e.g., via deals with Nvidia), NYSE:GETY monetizes its assets, promotes responsible AI, and challenges open-source models.
Standardized license deals will boost AI's commercial viability and prevent a "wild west" of IP theft, ultimately accelerating safe deployment in industries like advertising and media.
The merger with Shutterstock will only help NYSE:GETY be the ultimate leader in this licensed data space.
Bear Thesis
The "wild west" of IP theft continues for years and the company's debt / poor fundamentals build until and ultimate collapse or acquisition.
Action
The bull thesis makes the most sense given the amount of data NYSE:GETY has and the future of data licensing deals. Now, I would love the price to go lower to accumulate more shares (under $2 is not out of the question in the near-term). But, at $2.29, NYSE:GETY is in a personal buy zone, and a starter position was made. More shares will be gathered in the $1 range if the earnings and revenue growth projections continue to look promising beyond 2025: www.tradingview.com
Targets into 2028:
$3.07 (+34.1%)
$5.00 (+118.3%)

Nasdaq Computer sector & Nasdaq nearing pullback areaNasdaq Computer (IXCO) Is nearing pullback territory (23,717 resistance). IXCO being the largest sector in Nasdaq (IXIC) means the composite index, now that it's over previous resistance, is also looking for a pullback into support (20,160).
It's possible IXCO will break resistance next year and if that happens whatever gains are made will be lost on an eventual drop back into support.
If you have call options on NVDA or other tech companies closing them when IXCO hits 23,717 is highly advisable. If it hits there around this January it could be 2 years before IXCO resumes the uptrend past 23,717. Calls will likely get destroyed during this time.
Another note is lots of tech IPOs are occurring this year with lofty valuations. When this IXCO pullback comes they are likely to get hit hard. It's a great opportunity to short or wait to buy up the ones you like when the pullback is over.
As always good luck and try your best to avoid getting into new tech related trades as this year ends. It's going to be a great idea to have cash ready next year.

AI bubble is just startingKeeping it very simple.
It looks like Tech just broke out of the trend to the upside similar to 2nd Stage trend of the Internet bubble.
Compounding factors
-debt cycle turned spiral
-AI circle economy/ Ponzi

Nvidia Just Under Major SupportNvidia seems to have been pulled down by the Dow just like Apple as both are just under major support. I'm sorry for my previous Nvidia chart that drew support near 140, I recognize where I screwed up, but this chart should be good. Fortunately actual 117 support wasn't that far below and my NVDA isn't too in the red.
NVDA has the lowest revenue multiple in years right now. I know it's well off it's long term trend line, but it's growth rate is unlike anything it's ever been so expecting a steeper trend line to appear makes a lot of sense. Eventually I would imagine we'll get back to that trend line, but not anytime soon.
The Dow hitting major support should finally lift NVDA and the others that have been dragged down like AAPL and AMZN.
Good luck!

NBIS : Long worth TryingNebius group stocks are technically strong.
The downtrend since November 9, 2021 has been broken and the price is trading above the 50 and 200-period moving averages.
When we draw a medium-term Fibonacci level, we can take the take profit point at 0.618 and the stop-loss point at 0.382.
This gives us a Risk/Reward Ratio of 3.00.
A small position size is ideal.
Risk/Reward Ratio : 3.00
Stop-Loss : 43.46
Take-Profit : 60.00

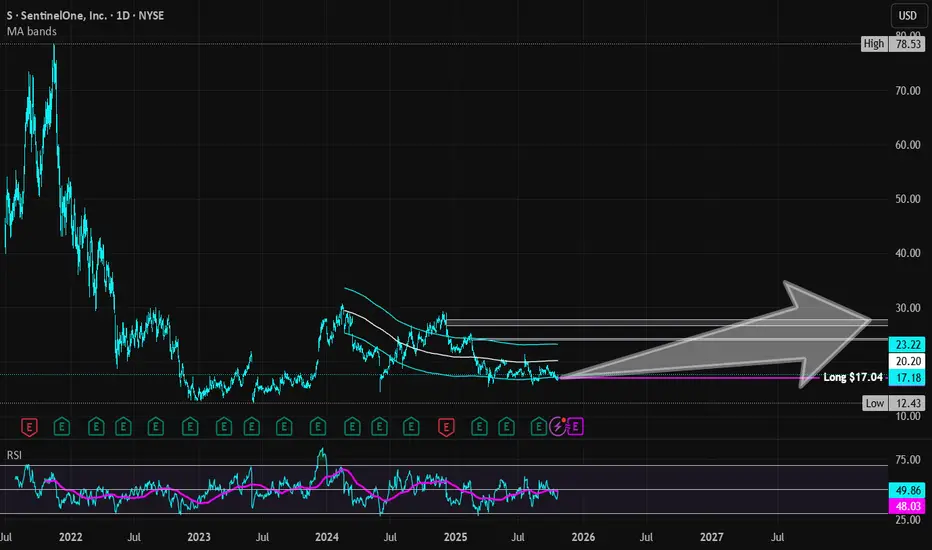
SentinelOne | S | Long at $17.04SentinelOne NYSE:S : a cybersecurity company that uses an autonomous AI-powered platform to performs real-time threat detection, prevention, and remediation across endpoints, cloud, and IoT.
Technical Analysis
Price is consolidating along my historical simple moving average (a regression to the mean). This is after a meteoric rise in 2021 to $78.53 (just after the IPO) and then collapse to $12.43 in 2023. While near-term ups and downs may persist for a bit, usually a price consolidation near the historical simple moving average eventually leads to a major move. The simple moving average band is getting tighter, signaling the potential for a move out of the zone "soon". Given the grow, niche, and need, the future may be bright with this one.
Growth
www.tradingview.com
820% growth expected in earnings per share between 2024 ($0.05) to 2027 ($0.46)
75% revenue growth projected between 2024 ($821 million) to 2027 ($1.4 billion)
Health
Debt-to-equity: 0 (perfection)
Altman's Z Score \ Bankruptcy Risk: 3.3 (extremely low risk)
Quick Ratio: 1.7 (they are able to pay current bills without relying on debt)
Insiders
Warning: Lots of selling and no buying...
openinsider.com
Action
SentinelOne NYSE:S is an extremely healthy company with very high-growth potential. However, the cybersecurity landscape is highly competitive, but NYSE:S is forming a niche with AI-powered tools. While insider selling is a red flag, that is all I can see here besides competition (or the company secretly falling apart behind the scenes). That's the risk we all take as investors. Thus, at $17.04, NYSE:S is in a personal buy zone.
Targets into 2028
$24.00 (+40.8%)
$27.50 (+61.4%)
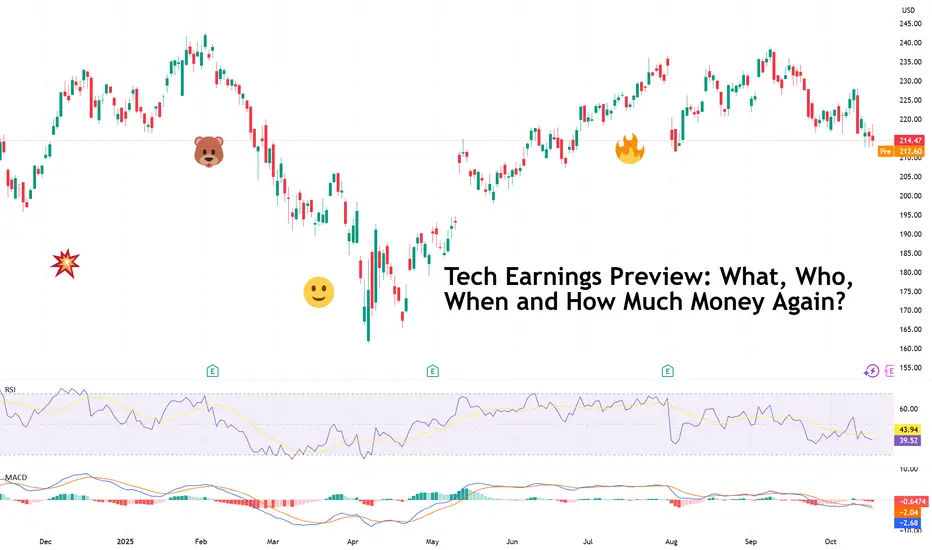
Tech Earnings Preview: What, Who, When and How Much Money Again?“ I don’t know, probably at least around $600 gazillion dollars ,” Zuck, probably if you asked him how much Meta NASDAQ:META will spend over the fiscal year.
It’s earnings season , which means Wall Street’s most expensive hobby — guessing how much the tech giants will make while pretending it’s about “long-term fundamentals” — is back in full swing.
💥 Welcome to Earnings Season
Happy third-quarter earnings, everyone. The candles are lit, the spreadsheets are out, and $1.6 trillion vanished from US stock valuations last Friday. Perfect timing.
Markets are reeling from tariff shocks and macro jitters, but traders have already shifted their gaze to the next big thing: Big Tech .
As is tradition, the Magnificent Seven — those trillion-dollar titans who make up roughly one-third of the S&P 500’s SP:SPX weight — are once again the main characters in this quarterly drama.
You’ve got AI. You’ve got spending. And you’ve got spending on AI.
🔔 Here We Go Again
This quarter, the storyline hasn’t changed much — it’s still “show me the money” season for artificial intelligence. Investors have spent the better part of two years rewarding CEOs for throwing the AI acronym in all their earnings calls. Is this time different?
• Amazon NASDAQ:AMZN reports the week of October 21, with everyone eyeing AWS — the quiet moneymaker funding Jeff Bezos’ rocket ambitions and your Prime Day discounts.
• Apple NASDAQ:AAPL , Microsoft NASDAQ:MSFT , and Meta NASDAQ:META follow around October 29. Investors will be laser-focused on who’s turning AI hype into product and revenue.
• And let’s not forget Alphabet NASDAQ:GOOGL , which already set the tone with a capex number that could fund a small country — $85 billion in 2025 alone , largely for AI infrastructure.
The question now: how much longer can these companies throw billions at Jensen Huang GPUs before shareholders start asking for a receipt?
🏗️ The AI Arms Race: Spending as a Strategy
The Magnificent Seven are still in an all-out hardware and data-center build-out. Meta’s Mark Zuckerberg is burning through cash to create the metaverse (yes, that still exists), but this time, powered by AI.
Nearly every megacap tech firm is building power plants to feed OpenAI. And Nvidia NASDAQ:NVDA — the company selling shovels in the AI gold rush — is counting every dollar.
Together, these firms are expected to spend hundreds of billions in the second half of 2025 just on computing power. Investors will be parsing every line of guidance for capex updates — because right now, spending is the strategy.
But the logic is sound (for now): If AI really does drive the next wave of productivity and profit, then whoever builds the infrastructure owns the future.
📊 The Numbers Game: What Wall Street Expects
Across the S&P 500 SP:SPX , earnings are projected to grow 8.8% year-over-year this quarter, on revenue growth of 6.4%, according to Seaport Research Partners. That may sound modest, but it’s for a reason: two-thirds of companies usually beat estimates.
Keep them achievable, and markets will celebrate. Pin them too high, and markets will be disappointed.
What’s more, earnings aren’t expected to stall anytime soon. FactSet data shows analysts projecting:
• 6.4% average annual sales growth for the S&P 500 through 2027
• 14% average annual earnings growth over the same period
That’s what rate cuts are supposed to do — a little liquidity trick, some risk-on mood, and suddenly even industrials and Buffett’s picks start looking interesting again.
Still, there’s one elephant in the room: valuation. The S&P 500 trades at 23 times forward earnings, which is, to use the technical term, “a lot.” At that level, even a small earnings miss could send stocks tumbling.
🧮 Winners, Losers, and the Market’s Short Memory
Some IPOs may have stolen headlines this year — looking at you, Figma NYSE:FIG and Circle NYSE:CRCL — but earnings season is where the real judgment happens.
A good report can add hundreds of billions in market cap overnight. But a bad one can do the same in the opposite direction .
Meta is under pressure to prove its huge spending on Superintelligence Labs is actually worth it. Apple’s got to show iPhone sales didn’t flatline in China. And Microsoft? Well, all it has to do is keep being Microsoft.
Amazon remains the dark horse. Its cloud business is stabilizing, retail’s humming along, and AI integration is just starting to take off. Traders are betting AWS will deliver, as it usually does.
🧘♂️ What Traders Should Watch
To navigate this volatility buffet, focus on:
• Forward guidance — Companies might beat earnings but guide lower, which can trigger pullbacks.
• Capex updates — Follow where the AI billions are flowing.
• Market reactions, not just results — The “sell the news” trade is real.
Sometimes the earnings game isn’t just about who made money — it’s about who surprised the market.
💡 Final Thought: Hype or Habit?
Big Tech’s gravitational pull on the markets isn’t fading anytime soon. Whether you’re bullish on AI or skeptical of its trillion-dollar promises, one thing’s certain — every move these companies make will ripple through every portfolio, index, and ETF on the planet.
As Q3 earnings hit full throttle, keep one eye on the charts and the other on the headlines . Because if there’s one thing Wall Street loves more than good earnings, it’s the story that comes after.
Off to you : How are you preparing to navigate the earnings season and the tech updates? Share your thoughts in the comments!
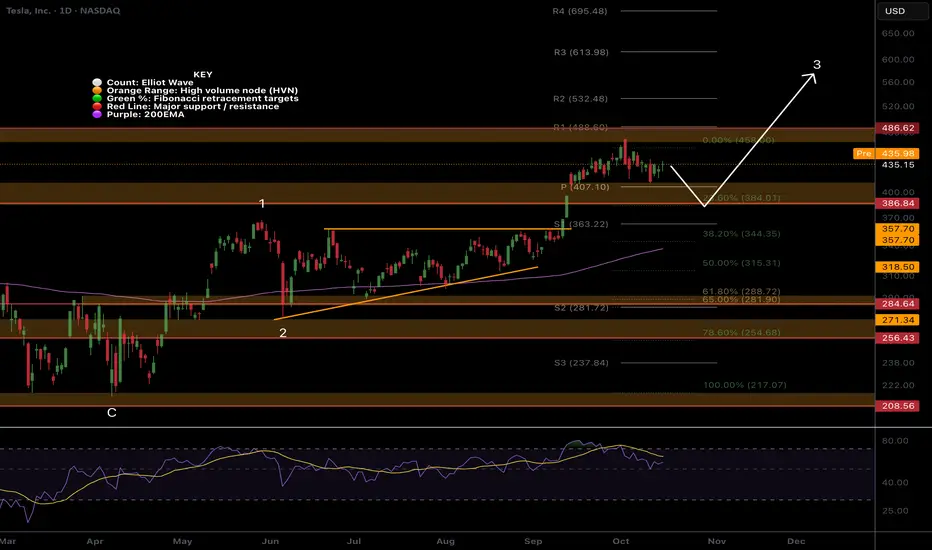
TSLA looks ready for higher in wave 3NASDAQ:TSLA found resistance at the all time High Volume Node and is trapped between that and the high volume support node.
The trend is up and strong. above the daily pivot and daily 200EMA with width.
I expect price to find support and continue into price discovery.
Safe trading
Google ready for higher!I am liking the look of NASDAQ:GOOG for another push to all time high before lower to complete macro elliot wave 3.
Wave 4 has typical target of the 0.382 Fibonacci retracement which sits at the previous all time high and also fils the gap left and meets the daily 200EMA! Lots of confluence and ill be buying here if we get it.
Daily Rsi has crossed bullishly from below the EQ.
Safe trading
USNAS100 – Overview | Bearish Pressure Below 24,855USNAS100 – Overview | Bearish Momentum Below 24,855
The index shows bearish momentum today as long as price trades below 24,855, after testing the resistance zone twice.
Failure to break higher keeps the pressure on the downside, with potential to drop toward 24,510 in the near term.
A 1H close above 24,855 would invalidate the bearish setup and trigger a strong bullish continuation toward the all-time-high (ATH) region near 25,035 → 25,200.
Pivot: 24,855
Support: 24,660 – 24,520 – 24,350
Resistance: 25,035 – 25,200 – 25,400

Google Gap fill + wave 4?Google has had a great run into price discovery in wave III uptrend but now appears exhausted and ready for a short term pullback setting up new signals.
The gap looks likely to be filled as coinciding the wave IV Fibonacci targets and the S1 daily pivot.
RSI is making its way into oversold with plenty of room to fall. Price may fal as far as the 0.382 Fibonacci and retest the previous all time high!
Safe trading