18 Times, +2000%, 5800 Days - All About NASDAQ100 Corrections!Hi, all!
I need to repost some of my recent ideas on TradingView due to issues with the platform's moderation. Let's start! The most up-to-date post is coming right away - one that serves as a timely reminder during these interesting times: never forget history.
From November 2008 to February 2025, the Nasdaq 100 (NDX) index has grown by over 2000%! Yes, that’s a 20x increase! This tech giant, made up of the 100 leading technology stocks, has shown impressive strength.
For comparison, the S&P 500 has risen about 820% in the same period. A great performance but Nasdaq 100 leaves it far behind.
Has this been a straight-line rise? Not really. Looking back, it may seem like the perfect investment. But the road was not smooth. Nasdaq 100’s success came with painful drops, investor panic, and moments when it felt like the market would never recover.
From the outside, everything looks great. But would you sit through a 30% drop, while the news is screaming about the "end of the world"?
So, I decided to analyze every correction of 10% or more since the market bottom in 2008.
- How long do corrections and recoveries last?
- How often do they happen?
- What should investors know?
- Can this help you in any way?
DATA ANALYSIS - 18 corrections in Nasdaq 100 (2008–2025), -10% or more.
Retracement Stats:
- Average drop: -15%
- Median drop: -13%
- Biggest drop: -37.72%
- Smallest drop: -10%
Correction Length (17 completed corrections): How many days does a correction last from the peak to the bottom?
- Average: 60 days
- Median: 35 days
- Longest: 325 days
- Shortest: 14 days
Recovery Time: From bottom back to new highs.
- Average: 165 days (~5.5 months)
- Median: 119 days (~4 months)
- Longest: 752 days (over 2 years)
- Shortest: 42 days (~1.5 months)
Correction Frequency
If we take a rough estimate, in 5800 days, there were 18 corrections, which means a correction happens every 322 days (~10.5 months) on average.
Total Time Spent in Corrections vs. Rising Markets
- Corrections lasted 1016 days
- Recoveries lasted 2801 days
- Total time spent in "work mode": 3817 days
- Total "smooth uptrend" days: 1983 days (~5.4 years)
Basically, like a hardworking employee – the market spends more time struggling than rising!
What Can Investors Learn from This?
1. Accept Volatility
Knowing that market swings are normal, investors can keep a long-term perspective and avoid panic-selling during downturns.
2. Nasdaq 100 Has Always Recovered
In the long run, Nasdaq 100 has always bounced back to new highs. Each recovery has been different, but so far, making new all-time highs has never been a problem.
3. Make Better Decisions
Understanding psychological biases helps investors make rational choices and manage risks better.
4. Market Drops = Opportunities, Not Threats
Most big market rallies started when most investors were too scared to buy.
"A simple rule dictates my buying: Be fearful when others are greedy, and be greedy when others are fearful." – Warren Buffett
Market drops always feel unique and scary but history shows they follow repeating patterns. And those who keep their emotions in check have the best opportunities.
"The time to buy is when there's blood in the streets." – Baron Rothschild
Final Thoughts: Is the current retracement a buying opportunity? No one knows for sure but history suggests - stay calm!
So, that's all. Like & Boost if you find this useful! 🚀
Have great day,
Vaido
💬 Before you leave... What’s your take on the current Nasdaq 100 correction? Drop your thoughts in the comments 👇
TECH

$SUI: SUI Blockchain’s Token – Poised for Growth or Overhyped?(1/9)
Good morning, crypto enthusiasts! ☀️ CRYPTOCAP:SUI : SUI Blockchain’s Token – Poised for Growth or Overhyped?
With SUI at $2.70 , is this Layer 1 blockchain’s token set to dominate the crypto market or just another flash in the pan? Let’s dive into the digital realm and find out! 🔍
(2/9) – PRICE PERFORMANCE 📊
• Current Price: $ 2.70 as of Mar 7, 2025 💰
• Historical Context: Launched May 3, 2023, with significant growth in 2024 📏
• Sector Trend: Blockchain gaming and NFTs driving demand 🌟
It’s a hot commodity in the crypto space! ⚙️
(3/9) – MARKET POSITION 📈
• Market Cap: Approx $1.2B (based on 1B tokens) 🏆
• Operations: Layer 1 blockchain with focus on speed and scalability ⏰
• Trend: Partnerships with gaming studios, NFT platforms boosting adoption 🎯
Solid, with a clear path to utility and growth! 🚀
(4/9) – KEY DEVELOPMENTS 🔑
• Recent Partnerships: Collaborations with gaming firms like Mythical Games 🔄
• NFT Sales: Robust growth in NFT transactions on SUI blockchain 🌍
• Market Reaction: Positive sentiment post-launch and recent updates 📋
Thriving, with a focus on real-world applications! 💡
(5/9) – RISKS IN FOCUS ⚡
• Competition: Strong rivals like Solana, Avalanche in the L1 space 🔍
• Regulatory Challenges: Crypto regulations could impact growth 📉
• Volatility: Crypto market’s inherent swings affect price ❄️
Navigating these choppy waters is key! 🛑
(6/9) – SWOT: STRENGTHS 💪
• Performance: High-speed transactions, ideal for gaming and more 🥇
• Partnerships: Growing ecosystem with gaming and NFT projects 📊
• Scalability: Designed for mass adoption, per developers’ claims 🔧
Got the goods to stand out in the blockchain race! 🏦
(7/9) – SWOT: WEAKNESSES & OPPORTUNITIES ⚖️
• Weaknesses: New project, unproven in long-term stability 📉
• Opportunities: Expanding into metaverse, AI integration 📈
Can it scale and secure its position or get lost in the noise? 🤔
(8/9) –📢SUI at $2.70—your take? 🗳️
• Bullish: $5+ by end of 2025, gaming boom drives growth 🐂
• Neutral: Steady growth, risks balanced ⚖️
• Bearish: $0.50 by year-end, competition overtakes 🐻
Chime in below! 👇
(9/9) – FINAL TAKEAWAY 🎯
SUI’s at $2.70, with a promising future in blockchain gaming and NFTs. Volatility’s a given, but its strengths could lead to significant gains. DCA on dips, ride the wave! Gem or bust?

US30 - Clean and Clear!Hello TradingView Family / Fellow Traders. This is Richard, also known as theSignalyst.
As per my last US30 analysis attached on the chart, it rejected the upper bound of the range and has been trading lower.
What's next?
📦We will be trading the range as long as it holds.
🏹As US30 approaches the lower bound of the range around $42,000, I will start looking for bullish reversal setups.
For now, we wait! ⏱️
📚 Always follow your trading plan regarding entry, risk management, and trade management.
Good luck!
All Strategies Are Good; If Managed Properly!
~Rich
Disclosure: I am part of Trade Nation's Influencer program and receive a monthly fee for using their TradingView charts in my analysis.

$SMCI: Super Micro Computer – AI Server Surge or a Pit Stop?
NASDAQ:SMCI : Super Micro Computer – AI Server Surge or a Pit Stop?
AI infrastructure’s hotter than a July barbecue, with revenue up 110% to $14,989.2 million in 2024! But with internal control concerns, is this tech beast charging up or taking a breather? Let’s dive in!
(1/9)
Good morning, everyone! ☀️ NASDAQ:SMCI : Super Micro Computer – AI Server Surge or a Pit Stop?
AI infrastructure’s hotter than a July barbecue, with revenue up 110% to $14,989.2 million in 2024! But with internal control concerns, is this tech beast charging up or taking a breather? Let’s dive in! 🔍
(2/9) – PRICE PERFORMANCE 📊
• Fiscal 2024: Net sales soared 110.4% to $14,989.2 million 💰
• Server Systems: Up 115.9%, GPU servers leading the charge 📏
• Sector Trend: AI demand’s skyrocketing 🌟
It’s a wild ride, fueled by AI’s hunger! ⚙️
(3/9) – MARKET POSITION 📈
• Market Cap: $2.4B, based on shares outstanding 🏆
• Holdings: Servers, storage, and AI solutions ⏰
• Trend: International sales steady at 32%, showing global appetite 🎯
Firm, carving a niche in AI infrastructure! 🚀
(4/9) – KEY DEVELOPMENTS 🔑
• 10-K Filing: Dropped Feb 25, 20
25, dodged NASDAQ delisting 🔄
• Revenue Driver: GPU servers for AI workloads 🌍
• Market Reaction: Shares jumped 19.8% after-hours 📋
Adapting, with investors cheering the comeback! 💡
(5/9) – RISKS IN FOCUS ⚡
• Internal Controls: Audit flagged issues, per Feb 25 filing 🔍
• Competition: Big players in AI server space 📉
• Volatility: High-growth sectors swing hard ❄️
Tough, but risks loom! 🛑
(6/9) – SWOT: STRENGTHS 💪
• Revenue Boom: 110% growth, $14,989.2 million in sales 🥇
• AI Focus: GPU servers crushing it 📊
• Global Reach: 32% international sales 🔧
Got rocket fuel in the tank! 🏦
(7/9) – SWOT: WEAKNESSES & OPPORTUNITIES ⚖️
• Weaknesses: Internal control concerns, per audit 📉
• Opportunities: AI infrastructure demand keeps soaring 📈
Can it fix the cracks and ride the wave? 🤔
(8/9) – 📢 SMCI’s revenue up 110%, with AI demand exploding, your take? 🗳️
• Bullish: Shares to $50+ soon, AI’s unstoppable 🐂
• Neutral: Steady, risks balance growth ⚖️
• Bearish: $35 looms, controls spook 🐻
Chime in below! 👇
(9/9) – FINAL TAKEAWAY 🎯
SMCI’s revenue surge to $14,989.2 million screams AI potential 📈, but control issues add a pinch of caution 🌿. Volatility’s our friend—dips are DCA gold 💰. Grab ‘em low, climb like pros! Gem or bust?

Nasdaq volatility NOT OVER YET!!Make note of the following liquidity targets this wk
Buy-side near term tp @ 21110-21160 (selling from there)
Sell-side tp @ 20378 (scaling into long buy positions from there)

Trump Media ($DJT) – Truth Social’s Latest MovesTrump Media ( NASDAQ:DJT ) – Truth Social’s Latest Moves
(1/9)
Good afternoon, TradingView! 🌞 Trump Media ( NASDAQ:DJT ) is trending 📈, last at $ 29.23 per Feb 18, 2025, close (Yahoo Finance), down 3.82% that day. Q4 2024 showed a $ 401M loss, yet cash reserves hit $ 777M 🌿. Let’s dive into this social media play! 🔍
(2/9) – PRICE PERFORMANCE 📊
• Feb 18, 2025: $ 29.23, down 3.82% from $ 30.39 💰
• Q4 2024: Revenue at $ 1M, down from $ 1.1M year prior 📏
• Full Year 2024: $ 3.6M sales, $ 401M net loss 🌟
It’s volatile, with cash as a lifeline! ⚙️
(3/9) – MARKET POSITION 📈
• Market Cap: $ 6.43B as of Feb 18, 2025, per Yahoo 🏆
• User Base: 9M Truth Social sign-ups as of Feb 2024 ⏰
• Trend: Exploring M&A, per Feb 14 filing 🎯
Firm, betting on growth! 🚀
(4/9) – KEY DEVELOPMENTS 🔑
• Q4 Earnings: $ 401M loss reported Feb 14, 2025 🔄
• Expansion: Plans for Truth.Fi ETFs, per Feb 6 Reuters 🌍
• Market Reaction: Flat post-earnings, per CNBC 📋
Adapting, diversification’s key! 💡
(5/9) – RISKS IN FOCUS ⚡
• Losses: $ 401M hit in 2024, per Feb 14 filing 🔍
• Competition: Meta, X pressure social media 📉
• Regulation: Legal woes linger, per Feb 14 SEC ❄️
Tough, but risks loom large! 🛑
(6/9) – SWOT: STRENGTHS 💪
• Cash Reserves: $ 777M buffer, per Feb 14 filing 🥇
• Brand: Trump loyalty drives interest 📊
• Flexibility: M&A plans in motion 🔧
Got resilience in the tank! 🏦
(7/9) – SWOT: WEAKNESSES & OPPORTUNITIES ⚖️
• Weaknesses: Revenue down, losses up 📉
• Opportunities: Crypto ventures, M&A growth 📈
Can NASDAQ:DJT turn cash into wins? 🤔
(8/9) – NASDAQ:DJT ’s $ 23.93 , cash-rich but loss-heavy, your take? 🗳️
• Bullish: $ 35+ soon, M&A pays 🐂
• Neutral: Steady, risks balance ⚖️
• Bearish: $ -20 looms, losses weigh 🐻
Chime in below! 👇
(9/9) – FINAL TAKEAWAY 🎯
NASDAQ:DJT ’s $ 29.23 Feb 18 close masks $ 777M cash stash 📈, but $ 401M losses sting 🌿. Volatility bites, yet dips are our DCA gold 💰. We grab ‘em low, climb like pros! Gem or bust?

ARISTA NETWORKS ($ANET) ZAPS Q4—AI & CLOUD FUEL SURGEARISTA NETWORKS ( NYSE:ANET ) ZAPS Q4—AI & CLOUD FUEL SURGE
(1/9)
Good evening, TradingView! Arista Networks ( NYSE:ANET ) is buzzing—$ 7B in 2024 revenue, up 19.5% 📈🔥. Q4 shines with AI and cloud demand—let’s unpack this tech titan! 🚀
(2/9) – REVENUE RUSH
• 2024 Haul: $ 7B—19.5% jump from $ 5.86B 💥
• Q4 Take: $ 1.93B—25.3% up, beats $ 1.9B 📊
• EPS: $ 0.65—tops $ 0.57, up 25%
NYSE:ANET ’s humming—cloud’s got juice!
(3/9) – BIG PLAYS
• Q1 ‘25 Guide: 1.93 − 1.97B—above $ 1.907B 🌍
• Stock Split: 4-for-1—shares for all! 🚗
• AI Ties: Meta, NVIDIA deals spark buzz 🌟
NYSE:ANET ’s wiring the future—full throttle!
(4/9) – SECTOR SNAP
• P/E: ~54—premium vs. Cisco’s 17 📈
• Growth: 19.5% smokes sector’s 7%
• Edge: 70-80% Microsoft share—kingpin 🌍
NYSE:ANET ’s hot—value or stretch?
(5/9) – RISKS IN VIEW
• Clients: Microsoft, Meta—big eggs, one basket ⚠️
• Comp: Cisco bites back—AI race heats 🏛️
• Economy: Capex cuts could sting 📉
High flyer—can it dodge the turbulence?
(6/9) – SWOT: STRENGTHS
• AI Lead: $ 750M ‘25 target—cloud king 🌟
• Margins: 64.6%—profit punch 🔍
• Cash: 95% flow jump, no debt 🚦
NYSE:ANET ’s a lean, mean machine!
(7/9) – SWOT: WEAKNESSES & OPPORTUNITIES
• Weaknesses: Client lean, high P/E 💸
• Opportunities: AI clusters, enterprise zip 🌍
Can NYSE:ANET zap past the risks?
(8/9) – NYSE:ANET ’s Q4 buzz—what’s your vibe?
1️⃣ Bullish—AI keeps it soaring.
2️⃣ Neutral—Growth’s solid, risks linger.
3️⃣ Bearish—Premium fades fast.
Vote below! 🗳️👇
(9/9) – FINAL TAKEAWAY
NYSE:ANET ’s $ 1.93B Q4 and AI deals spark zing—$ 7B year shines 🌍. Premium P/E, but growth rules—champ or chase?

META’S Q4 2024—$META RIDES AI AND ADS TO VICTORYMETA’S Q4 2024— NASDAQ:META RIDES AI AND ADS TO VICTORY
(1/9)
Good evening, Tradingview! Meta’s Q4 2024 earnings landed—$48.4B revenue, up 21% YoY, topping estimates 📈🔥. A 16.5% stock rally seals the deal. Let’s unravel NASDAQ:META ’s big win! 🚀
(2/9) – AD & AI POWER
• Q4 Revenue: $48.4B, 21% jump from last year 💥
• Profits: Nearly $21B—up 49%—efficiency shines 📊
• Ad Surge: Biggest driver, fueling the cash flow
AI’s humming, ads are king—Meta’s on fire!
(3/9) – KEY WINS
• AI Spend: $60B+ lined up for ‘25 🌍
• Users: 3.35B daily logins—record crowd 🚗
• Meta AI: 700M monthly fans—AI’s buzzing 🌟
Stock’s tearing up the charts—hot streak alert!
(4/9) – SECTOR SMACKDOWN
• Forward P/E: ~28x, leaner than Amazon’s 33x
• Ad Game: 21% growth beats Google’s 12% 📈
• User Pull: Social king—rivals can’t touch it
NASDAQ:META ’s a growth beast—hidden value or hype? 🌍
(5/9) – RISKS ON THE HORIZON
• Regs: EU and U.S. eyeing fines—trouble brews? 🏛️
• AI Bet: $60B spend—payoff’s a question ⚠️
• Saturation: 3.35B users tough to top 📉
High stakes in this tech showdown!
(6/9) – SWOT: STRENGTHS
• Ad Muscle: $46.8B in Q4—ad king rules 🌟
• AI Edge: 700M Meta AI users—future’s here 🔍
• Cash Pile: $52B free flow in ‘24 🚦
NASDAQ:META ’s flexing serious firepower!
(7/9) – SWOT: WEAKNESSES & OPPORTUNITIES
• Weaknesses: Metaverse burns SEED_TVCODER77_ETHBTCDATA:5B , AI costs stack 💸
• Opportunities: Threads hits 100M+, AI ads shine 🌍
Can NASDAQ:META spin risks into wins?
(8/9) – NASDAQ:META ’s Q4 rocks—what’s the vibe?
1️⃣ Bullish—AI and ads keep it roaring.
2️⃣ Neutral—Growth’s cool, risks hover.
3️⃣ Bearish—Big spends clip its wings.
Vote below! 🗳️👇
(9/9) – FINAL TAKEAWAY
Meta’s Q4 dazzles—$48.4B revenue, $21B profit, AI soaring 🌍🪙. 28x P/E vs. peers, but growth’s electric. Regs and AI costs loom—gem or gamble?

APPLOVIN’S Q4 2024—$APP BLASTS OFF WITH AI-AD SURGEAPPLOVIN’S Q4 2024— NASDAQ:APP BLASTS OFF WITH AI-AD SURGE
(1/9)
Good evening, Tradingview! AppLovin’s Q4 2024 earnings hit—$1.37B revenue, up 44% YoY, crushing $1.26B estimates 📈🔥. AI-powered AXON drives a 37% stock pop. Let’s unpack NASDAQ:APP ’s monster quarter! 🚀
(2/9) – REVENUE & EARNINGS
• Q4 Revenue: $1.37B, +44% YoY ($953.3M Q4 ‘23) 💥
• Ad Revenue: $999.5M, +73% YoY
• Apps Revenue: $373.3M, -1% YoY 📊
• EPS: $1.73, beats $1.24 est.
• Net Income: $599.2M, +248% YoY
(3/9) – BIG MOVES
• Stock Surge: +37% post-earnings (Feb 13) 🌍
• Buybacks: $2.1B retired 25.7M shares in ‘24 🚗
• Debt Play: $3.55B notes issued Nov ‘24 💸
• Q1 ‘25 Guide: $1.355-1.385B, tops $1.32B est.
(4/9) – SECTOR SHOWDOWN
• Market Cap: $175B (Feb 13) 🌟
• Trailing P/E: 116 vs. TTD (50), META (33)
• Growth: 44% YoY beats TTD (26%), META (19%)
• 1Y Stock: +1,000%, 2Y: +3,000%
Premium price, growth screams value!
(5/9) – RISKS TO FLAG
• Valuation: 116 P/E—high stakes, no misses 📉
• Debt: $3.51B vs. $567.6M cash—leverage looms ⚠️
• AI Rivals: Google, Meta eye AXON’s turf 🏛️
• Regs & Economy: Ad spend cuts lurk
(6/9) – SWOT: STRENGTHS
• Growth: 44% revenue, $599M profit soars 🌟
• Margins: 62% EBITDA, $2.1B FCF in ‘24 🔍
• AXON: 73% ad surge—AI’s the champ 🚦
NASDAQ:APP ’s a profit powerhouse!
(7/9) – SWOT: WEAKNESSES & OPPORTUNITIES
• Weaknesses: Apps dip (-1%), $3.51B debt 💸
• Opportunities: E-commerce ads, AI edge, acquisitions 🌍
Can NASDAQ:APP turn risks into riches?
(8/9) – NASDAQ:APP ’s Q4 stuns—where’s it headed?
1️⃣ Bullish—AI keeps it soaring.
2️⃣ Neutral—Growth holds, risks balance.
3️⃣ Bearish—Valuation bites back.
Vote below! 🗳️👇
(9/9) – FINAL TAKEAWAY
AppLovin’s Q4 dazzles—$1.37B revenue, $599M profit, stock blazing 🌍🪙. High P/E, but AI growth shines. Debt and rivals loom—gem or peak?

AIRBNB’S Q4 2024—$ABNB SOARS WITH RECORD GROWTHAIRBNB’S Q4 2024— NASDAQ:ABNB SOARS WITH RECORD GROWTH
(1/9)
Good morning, Tradingview Fam! Airbnb’s Q4 2024 earnings dropped—$2.5B revenue, up 12% YoY, topping $2.42B estimates 📈🔥. Nights booked hit 111M, and a $14% stock surge shows the market’s love. Let’s unpack NASDAQ:ABNB ’s big win! 🚀
(2/9) – REVENUE & EARNINGS
• Q4 Revenue: $2.5B, +12% YoY ($2.2B Q4 ‘23) 💥
• Net Income: $461M vs. -$349M loss last year
• EPS: $0.73, beats $0.61 est. 📊
• Adj. EBITDA: $765M, +4% YoY, 30.8% margin
• GBV: $17.6B, +13% YoY
Travel demand’s fueling the fire!
(3/9) – KEY HIGHLIGHTS
• Stock Surge: +14% post-earnings (Feb 14) 🌍
• Buybacks: $838M in Q4, $3.4B for 2024 🚗
• New Ventures: $200-250M investment in travel services for May ‘25 ✅
NASDAQ:ABNB ’s betting big on growth beyond stays!
(4/9) – SECTOR SHOWDOWN
• Market Cap: ~$102B, Stock: $161.2 🌟
• Trailing P/E: 48.87 vs. BKNG (23), EXPE (15)
• Outperforms: 12% revenue growth beats BKNG (6%), EXPE (2%)
Premium valuation, but $4.5B free cash flow says it’s earned!
(5/9) – RISKS TO WATCH
• Economy: Retail sales dip hints travel cuts 📉
• Regs: NYC bans, Barcelona threats loom 🏛️
• Competition: BKNG, EXPE, hotels fight back ⚔️
• Costs: $200-250M spend may squeeze Q1 margins ⚠️
(6/9) – SWOT: STRENGTHS
• Growth: 12% revenue, $461M profit shines 🌟
• Cash: SEED_TVCODER77_ETHBTCDATA:9B net, $4.5B FCF powers buybacks 🔍
• Tech: 535+ upgrades boost scale 🚦
NASDAQ:ABNB ’s a travel titan with muscle!
(7/9) – SWOT: WEAKNESSES & OPPORTUNITIES
• Weaknesses: High P/E (48.87), Q1 margin dip 💸
• Opportunities: New services ( SEED_TVCODER77_ETHBTCDATA:1B + potential), LatAm/Asia boom 🌍
Can NASDAQ:ABNB turn expansion into gold?
(8/9) – NASDAQ:ABNB ’s Q4 rocks—where’s it headed?
1️⃣ Bullish—Growth keeps climbing.
2️⃣ Neutral—Solid, but risks hover.
3️⃣ Bearish—Valuation caps it.
Vote below! 🗳️👇
(9/9) – FINAL TAKEAWAY
Airbnb’s Q4 dazzles—$2.5B revenue, stock soaring, new bets in play 🌍. Premium P/E vs. peers, but growth screams value. Risks lurk—regs, economy. Gem or peak?

$SHOP’S Q4 2024—E-COMMERCE KING OR OVERHYPED HUSTLE?NYSE:SHOP ’S Q4 2024—E-COMMERCE KING OR OVERHYPED HUSTLE?
(1/9)
Hey Tradingview crew! Shopify’s Q4 2024 is dropping jaws 📈🔥! $2.81B in revenue—31% YoY blast—$94.5B GMV, and a fat cash flow flex. Is NYSE:SHOP the champ or just flexing? Let’s rip it open! 🚀
(2/9) – REVENUE & EARNINGS BLOWOUT
• Q4 Revenue: $2.81B, +31% YoY—smoked $2.73B est. 💥
• Subscription: $666M, +27%
• Merchant Solutions: $2.15B, +33%
• EPS: $0.44, edged $0.43 est. 📊
• FCF: $611M, 22% margin— GETTEX:25M over est.
NYSE:SHOP ’s cash machine is humming!
(3/9) – BIG WINS
• GMV: $94.5B, +26%—fastest since ‘21 🚗
• Full Year: $8.88B revenue, +25.78% 🌍
• 3-Month Trials: New twist for Q1 ‘25 subs ✅
• Enterprise: 114 deals in 10 quarters—B2B up 132%!
X is buzzing— NYSE:SHOP ’s scaling like a beast!
(4/9) – SECTOR SMACKDOWN
• Market Cap: ~$151.5B, P/E 81, P/S 14.3 🌟
• Vs. NASDAQ:BIGC : Lagging, $CRM/ NASDAQ:ADBE : Broader focus
• NYSE:SHOP ’s 31% growth smokes peers—$94.5B GMV flexes
Pricey, but is it a steal for this hustle? X debates!
(5/9) – RISKS TO DODGE
• Amazon & WooCommerce: Claws out for NYSE:SHOP ’s turf 📉
• Economy: Slowdown could choke GMV ⚠️
• Tariffs: Duty hikes loom— NYSE:SHOP ’s got tools, but ouch!
• Costs: Intern army in ‘25—cash burn risk?
X says watch out—trouble’s lurking!
(6/9) – SWOT: STRENGTHS
• Revenue: 31% YoY—$2.81B Q4 fury 🌟
• FCF: 22% Q4 margin, 18% ‘24 🔍
• Global: 33% GMV growth, EMEA +37% 🚦
NYSE:SHOP ’s an e-commerce titan—X can’t look away!
(7/9) – SWOT: WEAKNESSES & OPPORTUNITIES
• Weaknesses: High P/E 81, merchant reliance 💸
• Opportunities: Enterprise boom, AI tools, price hikes 🌍
Can NYSE:SHOP turn hype into gold? X wants to know!
(8/9) – NYSE:SHOP ’s Q4 is fire—where’s it headed?
1️⃣ Bullish—$151.5B king keeps slaying
2️⃣ Neutral—Growth’s hot, but risks bite
3️⃣ Bearish—Valuation’s a trap, crash incoming
Vote now—let’s brawl it out! 🗳️👇
(9/9) – FINAL BLAST
NYSE:SHOP ’s Q4 is a $2.81B thunderclap—GMV soaring, cash flowing 🌍. But competition and costs lurk. Undervalued rocket or overhyped bubble?
SLong

Nasdaq and Next Major SupportThe Nasdaq Composite is about to break above what will be it's next major support. When this happens stocks usually fly quite high. Please remember that it will likely want to hit back into this support at some point. So when you get big gains after this happens, do not enter new positions, just ride them. You also might want to trim some off and wait for the pullback into support before adding new positions.
As always, good luck!

BAIDU’S Q4 2024 Earnings drop today Review Q3BAIDU’S Q3 2024 PERFORMANCE—AI GROWTH VS. AD WOES
(1/9)
Good morning, Tradingview Fam! Baidu’s latest financials are 📈🔍. Q3 2024 revenue hit ¥33.6B ($4.7B USD), but the story’s in the details: AI’s soaring, ads are slipping. Let’s dive into BIDU’s numbers and outlook! 🚀
(2/9) – REVENUE & EARNINGS SNAPSHOT
• Total Revenue: ¥33.6B ($4.7B USD)
• Baidu Core: ¥26.5B ($3.7B USD), +4% YoY 💥
• Cloud Revenue: Strong growth (exact figures vary) ☁️
• Q3 EPS: ¥19.2 ($2.67 USD), missed ¥19.62 est.
• Non-GAAP Net Income: ¥7.6B (~$1.06B USD)
Next up: Feb 18 earnings, est. $1.78 EPS, $4.56B revenue (-7.4% YoY).
(3/9) – BIG MOVES IN AI & AUTONOMOUS TECH
• Baidu World 2024: Unveiled iRAG & Miaoda AI tools 🤖
• ERNIE API: 1.5B daily calls, up 30x YoY 📈
• Lidar Deal: $200-300M with Hesai for Yichi 06 robotaxis 🚗
AI and autonomy are stealing the show—growth engines revving up!
(4/9) – SECTOR SHOWDOWN
• Market Cap: $31.36B (Feb 2025) 🌍
• Trailing P/E: 10.56x, Forward P/E: 10.5x—cheap vs. Alphabet or Tencent 📊
• Lags GOOG in search/ad scale but leads Chinese peers (JD, PDD) in AI diversification
At 3x EV/EBITDA, is BIDU undervalued? X posts think so!
(5/9) – RISKS ON THE RADAR
• Ad revenue: Squeezed by Tencent, ByteDance competition 📉
• AI costs: Big R&D spend, profits TBD 🤔
• China regs: Unpredictable hurdles loom 🏛️
• Economy: Slowdown could hit ad & cloud growth
• U.S.-China tension: Weighs on sentiment ⚠️
(6/9) – SWOT: STRENGTHS
• King of China’s search market, mobile ecosystem thriving 🔍
• ERNIE Bot: 430M users, 770k enterprise apps 🌟
• Apollo Go: Leading autonomous driving, $162.6B robotaxi market by 2025 🚦
Baidu’s got serious firepower!
(7/9) – SWOT: WEAKNESSES & OPPORTUNITIES
• Weaknesses: Ad margins shrinking, AI not yet cashing in 💸
• Opportunities: AI cloud expansion, robotaxi scale-up, China stimulus upside 🌍
Can Baidu turn its tech bets into gold? Time will tell!
(8/9) – What’s BIDU’s 2025 vibe?
1️⃣ Bullish—AI and autonomy will drive a breakout.
2️⃣ Neutral—Growth potential, but risks balance it out.
3️⃣ Bearish—Ads and regs will drag it down.
Vote below! 🗳️👇
(9/9) – FINAL TAKEAWAY
Baidu’s Q3 shows a tale of two trends: AI and autonomy surging, ads under pressure 🌍. With a low valuation and big tech bets, BIDU’s at a crossroads. Will innovation outpace the risks? Earnings drop today—stay tuned for the next chapter! 💪

ROBINHOOD has a solid Double left in it.There are speculative doubles
and there higher probability plays.
I like HOOD as a firm play to accelerate into the $50 region sometime in Q4
great chart for Momentum players
while the true believer should already had their bags packed long ago.

Looking for TEM at $68I'm hoping to get into Tempus. Looking for $68 maybe it'll hit post earnings. Might have missed the bus, but just wanted to share that's my entry if it hits.
Good luck!

APPLE ($AAPL) – Q1 FY25 EARNINGS & WHAT’S NEXT APPLE ( NASDAQ:AAPL ) – Q1 FY25 EARNINGS & WHAT’S NEXT
(1/8)
Revenue: $124.3B (+4% YoY) – A new all-time record! Services soared +14% to $26.3B, offsetting a slight dip in iPhone sales. Let’s see how Apple’s holding up. 🍎📈
(2/8) – EARNINGS BEAT
• EPS: $2.40 (beat by $0.06)
• Gross margin: 46.9%, topping estimates 🔥
• Despite China sales dropping 11% to $18.51B, Apple still racked up big gains elsewhere 🌏
(3/8) – SECTOR SNAPSHOT
• Market cap $3.5T+, P/E ~30
• Some call it pricey vs. tech peers, but brand strength + services + potential AI expansions = possible undervaluation 🤔
• Compares favorably to Microsoft, Samsung, etc., given stable product + services synergy 🌐
(4/8) – RISKS TO WATCH
• Geopolitical: China manufacturing & sales reliance → Trade tensions? Tariffs? 🏭
• Innovation Pace: Competitors could leapfrog Apple in AI or other emerging tech 💡
• Regulatory: Antitrust cases (App Store) could pinch profitability ⚖️
• Economy: Premium pricing in downturn—brand loyalty helps, but can’t ignore recession effects 💸
(5/8) – SWOT HIGHLIGHTS
Strengths:
Legendary brand loyalty & huge install base
Growing services revenue (+14%!)
Massive cash reserves for R&D & buybacks
Weaknesses:
Heavy dependence on iPhone sales
China manufacturing concentration
Opportunities:
AI, AR/VR expansions (Vision Pro, maybe more)
Emerging markets → untapped smartphone penetration 🌍
Services sector continuing to expand ⚡
Threats:
Fierce competition (especially in China) 🦖
Trade tensions & supply chain hiccups 🌐
Shifts in consumer tech tastes or new disruptors
(6/8) – CHINA SALES DENT
• China down 11%—that’s a chunk given its importance
• Local giants (Xiaomi, Huawei) are snapping at Apple’s heels 🦾
• Will Vision Pro + AI upgrades woo Chinese consumers back? 🤔
(7/8) – Is Apple undervalued at a $3.5T market cap & P/E of 30?
1️⃣ Bullish—Brand power + AI = unstoppable 🍀
2️⃣ Neutral—Solid, but watch those China risks 🔍
3️⃣ Bearish—Too expensive, competition’s rising 🐻
Vote below! 🗳️👇
Arista Into EarningsANET is still suffering from the NVDA sell off (I would argue completely irrational panic). It's currently ranging right in the middle of major support and major resistance. So it's tricky because we're so far above support, but also lots of room to recover losses. My bet into earnings is Arista breaks above resistance at $141. Arista is trading just under 20X revenue and they have amazing profit margins and sustained growth. The broader Nasdaq Computer Index IXCO is very close to breaking out of this long range it's been so it seems like a fair bet that ANET jumps to the upside along with everything else.
Good Luck!

FRESHWORKS ($FRSH): DRIVING AI-POWERED GROWTH IN SaaSFRESHWORKS ( NASDAQ:FRSH ): DRIVING AI-POWERED GROWTH IN SaaS
1/7
Revenue Growth: Freshworks just posted $194.6M in Q4 2024 (+22% YoY), with full-year revenue hitting $ 720M (+21% YoY)! ⚡️
Growth is fueled by new customer wins and the rising AI demand in customer service, sales, and IT solutions.
2/7 – EARNINGS BEAT
• Non-GAAP EPS: $0.14 (beat by $0.04) 💰
• Operating profit for FY2024 doubled to $ 99M from $ 44.5M in 2023 🔥
• FY2025 guidance: Revenue $ 809M–$ 821M (12–14% YoY growth) 🚀
3/7 – CASH FLOW & PROFITABILITY
• Free Cash Flow margin at 21% in Q4—showing major profitability strides 💸
• Shifting from less profitable past to a more robust, scalable business model 🏆
4/7 – SECTOR SNAPSHOT
• Competes with Salesforce, HubSpot, Zendesk in the SaaS arena 🌐
• Enterprise Value to Revenue ratio is on the lower end—could be undervalued given its growth 📈
• Mid-market & SMB focus → niche advantage vs. pricier enterprise solutions
5/7 – RISK FACTORS
• Market Competition: Big fish (Salesforce) + fresh entrants (Zendesk) 🏦
• Customer Acquisition: High marketing costs, must maintain ROI 🤝
• Economic Sensitivity: Downturn = possible budget cuts on software 💼
• Tech Shifts: Rapid AI innovation—no resting on laurels! 🤖
6/7 – SWOT HIGHLIGHTS
Strengths:
• Strong AI-driven revenue growth
• Wide product portfolio (sales, IT, support, etc.)
• Growing customer base & retention ✅
Weaknesses:
• Less profitable historically (though improving)
• Revenue heavily reliant on core products 😬
Opportunities:
• Expand into untapped global markets
• Double down on AI for new revenue streams 🌍
Threats:
• Market saturation & intense competition 🏁
• Data privacy regs could disrupt operations ⚖️
7/7 Freshworks: undervalued gem or just another SaaS player?
1️⃣ Bullish—AI + mid-market niche = unstoppable! 🏅
2️⃣ Neutral—Need more proof of profitability 🤔
3️⃣ Bearish—Competition & economy hold it back 🐻
Vote below! 🗳️👇

$ACHR ARCHER AVIATION SCORES 300M BOOST BLACKROCK JOINS THE RIDEARCHER AVIATION SCORES $300M BOOST—BLACKROCK JOINS THE RIDE
1/7
🚀 $300M just landed in Archer Aviation’s pocket! Major institutional investors like BlackRock are backing Archer’s quest to dominate the eVTOL game. Ready to see why this funding is a big deal? Let’s go! ⚡️✈️
2/7 – WHAT’S ARCHER BUILDING?
Midnight Aircraft: Designed for short urban flights (~20 miles) with rapid turnarounds.
Targets commercial operations by 2025, battling congestion & pollution. 🌆
Hybrid Approach: Electric + other propulsion to boost range and expedite FAA certification.
3/7 – BLACKROCK’S INVOLVEMENT
Big Vote of Confidence: World’s largest asset manager sees serious potential. 💪
Aligns with green investing—eVTOLs can slash emissions compared to helicopters. ♻️
Could draw more partnerships and capital to Archer’s runway.
4/7 – WHY COMPOSITES & BATTERIES MATTER
Composites: Lighter & stronger materials = extended range & higher efficiency. 🏋️♀️
Batteries: High-energy density is critical for flight duration & payload. 🔋⚡️
Archer’s push here signals they’re tackling the industry’s biggest hurdles head-on.
5/7 – FINANCIAL & STRATEGIC IMPACT
Stronger Balance Sheet: $300M for R&D, testing, manufacturing. 💼
Timing is key: Archer eyes FAA approval soon—this cash could speed up that process. ⏱️
Competing with Joby, Vertical Aerospace, Lilium—the race is on! 🏁
6/7 Are eVTOLs the future of urban travel?
1️⃣ Absolutely—Game-changer for city traffic! 🏙️
2️⃣ Maybe—Need more proof and better tech. 🤔
3️⃣ Nope—I’m still skeptical about costs & safety. ❌
Vote below! 🗳️👇
7/7 – INDUSTRY CONTEXT
Market could hit $1.5T by 2040 (Morgan Stanley). 💰
Key markets: US, UAE, Japan, India—Archer is eyeing them all. 🌏
eVTOLs promise faster, greener commutes, but hurdles remain: regulations, infrastructure, battery tech.
Strengths: Archer’s recent $300 million funding, strategic partnerships, and regulatory progress position it well to compete in the eVTOL market. Its focus on composites and batteries aligns with industry needs.
Weaknesses: High R&D costs, limited manufacturing capacity, and lack of commercial revenue highlight financial and operational challenges.
Opportunities: The growing eVTOL market, international expansion, and defense applications offer significant growth potential.

Nasdaq Industrial Bull Run Getting Ready!Basically we're just over the previous highs consolidating for the next big move up.
Industrials include retailers like Amazon and Costco and Electric vehicle companies Tesla and Rivian.
Good luck and stay bullish!

$UBER UBER’S RIDE TO PROFITABILITY & BEYOND?UBER’S RIDE TO PROFITABILITY & BEYOND?
1/8 Uber ( NYSE:UBER ) just keeps on rolling! 🚀🚖
From 20% YoY growth in gross bookings to a SEED_TVCODER77_ETHBTCDATA:7B stock buyback, here’s what you need to know about this market heavyweight.
2/8 – RECENT REVENUE GROWTH
• Q1 FY24: Gross bookings hit $37.7B (+20% YoY)
• Revenue: $10.1B (+15% YoY), beating estimates by FWB:40M
• Uber’s firing on all cylinders—mobility & delivery both on the rise
3/8 – EARNINGS & PROFITABILITY
• Operating margin up from -3% to 2%—that’s a serious pivot to profit
• Adjusted EBITDA soared 82% to $1.4B
• First annual profit since going public in 2019. Party time! 🎉
4/8 – BUYBACKS & BULLISH GUIDANCE
• SEED_TVCODER77_ETHBTCDATA:7B stock buyback → market approves, stock at all-time highs 📈
• Gross bookings outlook: +15–20% for the next 3 years
• EBITDA growth pegged at ~40%—can they keep the momentum?
5/8 – VALUATION SNAPSHOT
• Forward P/E ~35x—a bit high, but consider the growth & dominance
• Market cap ~$140B vs. robust free cash flow projections
• Competition (Lyft, DoorDash) often has higher P/E or shakier growth
6/8 Is Uber undervalued given its trajectory?
1️⃣ Yes—ride (and deliver) the wave!
2️⃣ No—too pricey at 35x forward P/E
3️⃣ Maybe—needs more proof (robotaxi success?)
Vote below! 🗳️👇
7/8 – SWOT/SCOT TAKE
Strengths: Global brand, diverse services, Waymo partnership 🤖
Challenges: Regulations, high op costs, fierce competition
Opportunities: New markets, AI, autonomous tech
Threats: Legal hurdles, changing consumer habits
8/8 – WHAT’S NEXT?
Uber’s aiming for an autonomous future—could that turbocharge margins? ⚡️🏁

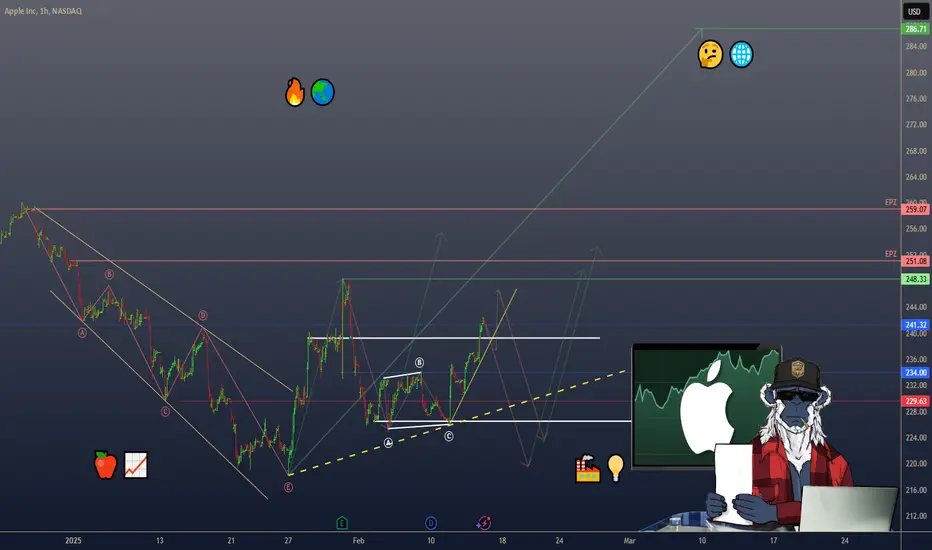
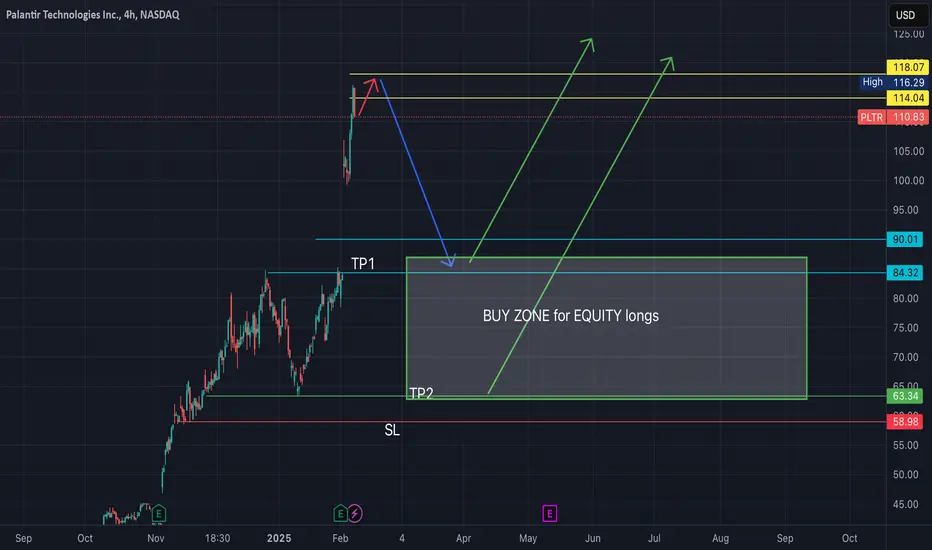
PLTR -- more volatility forecasted into MarchExpecting quick progression to 118$ level as final buy-side wave near term.
Looking for renewed significant selling action from that level to retrace price back to pre-earnings levels near 80-85$
Possibility exists (imho) that we fully retrace back to 63-64$ levels by April timeframe, depending on sentiment as we head into next FOMC meeting in mid-March.
After that, my cycles analysis indicates we will continue higher toward 120...Therefore, I will be planning on taking profits on put option contracts once underlying share price reaches below 85$, and will plan on scaling into long equity positions on discounts between 64-85$ for the projected subsequent buy wave to 120+
Did We Just Witness AI Black Monday? DeepSeek Shocks Tech StocksPanic sell, panic sell, panic sell! That’s basically how Monday went for Wall Street and those of you who hold Nvidia shares. Or just about any other tech stock — you name it, it likely fell nose first when a big and scary Chinese artificial intelligence startup unveiled its new AI model.
DeepSeek.
What in the world is DeepSeek and why do I hear about it now?
DeepSeek, a Chinese artificial intelligence startup, may have just stripped Nvidia of its untouchable status as the go-to company that develops expensive chips to train AI models. DeepSeek announced it had trained its latest model, a rival of ChatGPT, for the negligible $5.6 million in computing costs. The story gets even crazier: it did it with 2,048 Nvidia H800 GPUs (bought before the US rolled out export restrictions).
That’s a meager 5% of the $100 million OpenAI blew on training its GPT-4 model in late 2023. And, what’s even more, DeepSeek’s model, called R1, churns out responses that are scarily close to the advanced US-bred technology.
Oh, and it’s open source, unlike OpenAI, which was originally open source but shut its doors to the public. It’s also free to use, unlike ChatGPT, which offers a paid tier between $240 and $2,400 a year. DeepSeek’s R1 model is quickly gaining traction among users as it made its way to the top of Apple’s App Store rankings.
DeepSeek has factored in demand from corporations, too. While OpenAI hosts the model on its own platform, its Chinese rival allows you to host this beast on your own hardware, which is a big deal to lots of businesses that work with sensitive data.
The stock market was so shocked by the news that you can get pretty much the same result for a fraction of the cost (and give it to users for free), it ran for the hills. The aftermath — Monday saw more than $1 trillion washed out from the valuation of the Magnificent Seven club. One company specifically took the biggest blow.
Can DeepSeek deep-six Nvidia’s world dominance plans?
Have companies been overpaying for Nvidia’s $30,000 chips? And have investors been overpaying for Nvidia’s shares? Nvidia NVDA pulled in a record $35 billion in Q3 , 2024 and struck a gross margin of 75% and net income of $20 billion.
The Jensen Huang-led company on Monday showed it can also hit records in reverse. Closing down 17% for the cash session, it took the biggest L in history. This was the largest destruction of value for a single company ever — $589 billion . So why was Nvidia particularly hit by DeepSeek’s rise?
Nvidia has been the primary beneficiary of the vast amounts of cash companies spent on AI. Simply because Nvidia makes the semiconductors used to train AI models. But if the same result (or just about the same) could be achieved through far less expensive means, why bother propelling Nvidia to the top echelon of the world’s biggest companies ?
Nvidia has picked up roughly $131 billion over the past two years from the sale of data-center equipment, mostly AI chips. Its client list includes the biggest names in tech, such as Amazon AMZN , Microsoft MSFT , Meta META and Alphabet GOOGL . These four combined have shelled out $343 billion in AI-related capex (capital expenditures) over the past two years. Since the release of ChatGPT, Nvidia shares have surged more than 700%.
Could we be looking at the good old supply and demand equation in play? If DeepSeek’s claims are true, and other companies can do the same (it’s an open-source model), then the scales could turn from undersupply to oversupply.
Can we then see a market crash that’s beyond anything we’ve ever thought possible? Or is that freak-out an unjustified stretch? Share your thoughts in the comment section below.
