XAUUSD BULLISH ANALYSIS(READ CAPTION)Hi trader's what do you think about gold
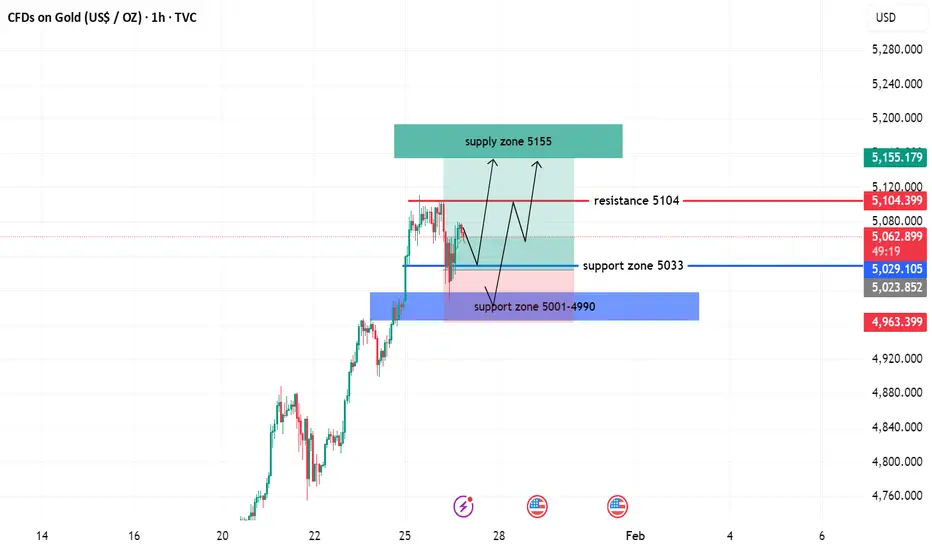
Gold is currently showing bullish price action, with the market holding above key support levels. Buyers remain in control, and any short-term pullbacks are considered potential buying opportunities within the overall uptrend.
🟢 Primary Support: 5033
The 5033 level is acting as a strong bullish support. As long as price stays above this level, the bullish momentum is expected to continue.
🟢 Second Support Zone: 5001 – 4990
This zone represents a strong demand and accumulation area. If price retraces into this zone, buyers are likely to step in again. A clear break below 4990 would weaken the bullish structure.
📈 Market Bias
Above 5033 → Bullish trend remains valid
Pullback toward 5001–4990 → Possible buy zone
Below 4990 → Bullish setup invalidated
Overall, the market structure supports a buy-on-dips strategy while price holds above key support zones.
please don't forget to like comment and follow
Techanicalanalysis
XAUUSD BUY TRAPE (READ CAPTION)hi trader's what do you think about gold
Gold (XAUUSD) is currently trading under a bearish structure, as price is facing strong selling pressure near the upper resistance zone. The area between 4980–5000 is acting as a major supply and rejection zone, where sellers are aggressively defending higher prices.
🔻 Resistance Zone: 4980–5000
This zone represents a strong bearish rejection area and an ideal sell-on-retest zone.
As long as Gold remains below 5000, the overall market bias stays bearish.
Any retracement into this zone followed by rejection candles would confirm downside continuation.
🔻 Demand Zone: 4840
This is the primary downside target and demand area.
If selling pressure continues from the resistance zone, price is likely to move toward 4840, where buyers may attempt a temporary reaction or consolidation.
📉 Market Outlook
Below 4980–5000 → Bearish continuation expected
Rejection from resistance → Confirms seller control
Downside target → 4840 demand zone
Break above 5000 → Bearish setup invalidated
Overall, the structure supports a bearish retest → continuation setup, favoring sellers unless price breaks and holds above the major resistance zone.
please don't forget to like comment and follow

BTCUSD NEXT MOVE (READ CAPTION)Hi trader's what do you think about btcusd
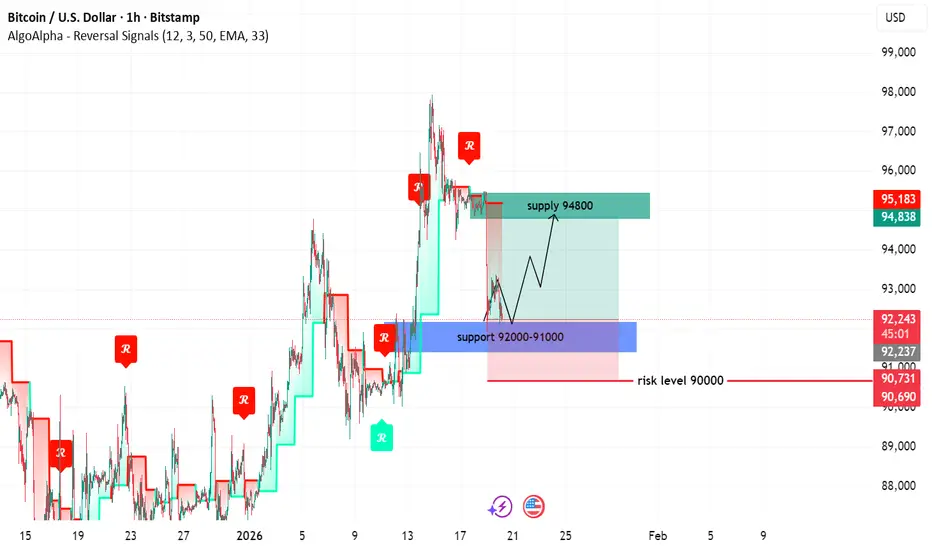
BTCUSD is currently maintaining a bullish market structure, with price holding above a key support zone and buyers remaining active on pullbacks. The overall price action suggests a potential continuation toward higher levels, while risk is clearly defined below.
🔹 Support Zone: 92,000–91,000
This zone represents the primary bullish demand area, where buyers have repeatedly stepped in.
As long as BTC holds above 91,000, the bullish bias remains valid.
🔹 Risk Level: 90,000
This level acts as the invalidation and risk management level.
A sustained break below 90,000 would weaken the bullish setup and signal caution or trend change.
🔹 Supply Zone: 94,800
This is the near-term upside target and supply area.
If bullish momentum continues, price is likely to move toward 94,800, where sellers may attempt to slow the advance or cause short-term rejection.
📈 Market Outlook
Holding above 92,000–91,000 → Bullish continuation expected
Break below 90,000 → Bullish setup invalidated
Upside target → 94,800 supply zone
Overall, the structure supports a bullish pullback followed by continuation, with clearly defined risk control.
please don't forget to live come follow
XAUUSD BUYER WANT (READ CAPTION)Hi trader's what do you think about gold
Gold (XAUUSD) is maintaining a bullish market structure, with price holding above key support zones and buyers showing strength on pullbacks. The current price action suggests a higher probability of upside continuation toward the next resistance and supply areas.
🔹 Support Zone: 4600
This level acts as the primary bullish support, where buyers are actively defending price.
Holding above 4600 keeps the bullish bias intact.
🔹 Support Zone: 4580–4567
This is a strong demand and accumulation zone.
Any deeper retracement into 4580–4567 is considered a high-probability buying area, where strong bullish reactions are expected.
🔹 Resistance: 4673
This is the key near-term resistance.
A confirmed breakout and close above 4673 will strengthen bullish momentum and confirm continuation.
🔹 Supply Zone: 4710
This zone represents the main upside target and supply area.
If Gold breaks above 4673, price is likely to move toward 4710, where sellers may attempt to slow or reject the move.
A strong breakout above this zone could signal further bullish expansion.
📈 Market Outlook
Holding above 4600 / 4580–4567 → Bullish continuation expected
Break above 4673 → Opens path toward 4710 supply zone
Supply zone reaction will define the next major move
Overall, the structure supports a bullish pullback followed by continuation setup.
please dont' forget to like comment and follow

XAUUSD BULLISH SETUP(READ CAPTION)Hi trader's what do you think about gold
Gold (XAUUSD) is currently showing a bullish market structure, with price holding above a key support zone and buyers actively defending pullbacks. The overall price action supports a continuation toward higher levels.
🔹 Support Zone: 4455–4430
This zone represents the primary bullish demand area where buyers have previously stepped in strongly.
As long as Gold holds above 4430, the bullish bias remains valid.
🔹 Resistance: 4518
This is the key near-term resistance level.
A confirmed breakout and close above 4518 will strengthen bullish momentum and signal continuation.
🔹 Supply Zone: 4550
This is the main upside target and supply area.
If Gold breaks above 4518, price is likely to move toward the 4550 supply zone, where sellers may attempt to slow or reject the move.
A strong breakout above 4550 could open the door for further bullish expansion.
📈 Market Outlook
Holding above 4455–4430 → Bullish continuation expected
Break above 4518 → Targets 4550 supply zone
Supply zone reaction will define the next directional move
Overall, the structure supports a bullish pullback followed by continuation setup.
please don't forget to like comment and follow thank you

BTCUSD READY FOR FLY (READ CAPTION)Hi trader's what do you think about btcusd
BTCUSD is currently maintaining a bullish market structure, with price holding firmly above a strong support zone and showing consistent buyer interest on pullbacks. The overall price action supports further upside continuation toward higher levels.
🔹 Support Zone: 89,000–88,000
This zone represents the primary bullish demand area where buyers have repeatedly stepped in.
As long as BTC holds above 88,000, the bullish bias remains intact.
🔹 Resistance Zone: 95,000
This is the key resistance area where price may face temporary rejection or consolidation.
A strong breakout and close above 95,000 will confirm bullish continuation.
🔹 Supply Zone: 99,000
This is the major upside target and supply area.
If BTC breaks above 95,000, price is likely to extend toward the 99,000 supply zone, where sellers may attempt to slow the move.
A decisive breakout above this zone could signal further upside expansion.
📈 Market Outlook
Holding above 89,000–88,000 → Bullish continuation expected
Break above 95,000 → Opens path toward 99,000 supply zone
Supply zone reaction will determine the next major directional move
Overall, the structure favors a bullish pullback followed by continuation scenario.
please don't forget to like comment and follow

XAUUSD SHOULDER HEAD (READ CAPTION)Hi trader's what do you think about gold
Gold (XAUUSD) is currently forming an Inverse Head & Shoulders pattern, which is a classic bullish reversal structure. This setup indicates that sellers are losing control and buyers are gradually stepping into the market.
🔹 Support Zone: 4310–4300
This zone represents the base of the pattern, where price has formed the right shoulder and buyers are actively defending the market.
As long as Gold holds above 4300, the bullish setup remains valid.
🔹 Pattern Structure (Inverse Head & Shoulders)
Left Shoulder: Initial rejection from support
Head: Deeper low near the 4300 zone
Right Shoulder: Higher low, confirming buyer strength
This structure signals a potential trend reversal from bearish to bullish.
🔹 Resistance (Neckline): 4402
The level 4402 acts as the neckline resistance of the pattern.
A confirmed breakout and close above 4402 will validate the Inverse Head & Shoulders and confirm bullish continuation.
🔹 Supply Zone: 4460
Once the neckline is broken, the next upside target is the 4460 supply zone, where sellers may attempt to react.
A strong breakout above 4460 could open the door for further bullish expansion.
📈 Market Outlook
Holding above 4310–4300 → Bullish bias intact
Break above 4402 → Pattern confirmation
Upside target → 4460 supply zone
Structure favors bullish reversal → continuation
Overall, this setup supports a bullish trade based on Inverse Head & Shoulders confirmation.
please don't forget to like comment and follow

$SPY & $SPX Scenarios — Friday, Jan 2, 2026🔮 AMEX:SPY & SP:SPX Scenarios — Friday, Jan 2, 2026 🔮
🌍 Market-Moving Headlines
• First trading day of the year: Thin liquidity + positioning resets can exaggerate moves.
• Manufacturing tone check: PMI helps frame growth momentum heading into the first full trading week of 2026.
📊 Key Data & Events (ET)
9 45 AM
• S&P Final U.S. Manufacturing PMI (Dec): 51.7
⚠️ Disclaimer: For informational use only — not financial advice.
📌 #SPY #SPX #PMI #markets #trading #stocks #macro

XAUUAD READY FOR PULLBACK (READ CAPTION)Hi traders what do you think about gold
Gold (XAUUSD) is currently forming a sell retest setup, where price is retracing upward into key resistance zones before a potential bearish continuation. This structure supports a sell-on-retest strategy.
🔹 Resistance Zone: 4527–4531
This is the primary sell zone where price is expected to face rejection.
If the market retests this zone and shows bearish price action (rejection wicks or bearish candles), it confirms seller dominance.
🔹 Second Resistance: 4555
This level represents the upper resistance and invalidation zone.
A strong rejection from 4555 would further strengthen the bearish outlook, while a sustained break above it may weaken the sell setup.
🔹 Support: 4496
This is the first downside target where price may pause or form a minor bounce.
A confirmed break below 4496 signals continuation of bearish momentum.
🔹 Demand Zone: 4457
This is the main downside target and demand area.
If price breaks below 4496, Gold is likely to move toward 4457, where buyers may step in for a reaction or short-term consolidation.
📉 Market Outlook (Retest Logic)
Retracement into 4527–4531 → Sell opportunity
Rejection from resistance → Confirms bearish continuation
Break below 4496 → Opens path toward 4457 demand zone
Demand zone reaction will determine next move
The overall structure favors a bearish retest → continuation setup, unless price breaks and holds above 4555
please don't forget to like comment and follow thank you

XAUUSD PULLBACK AND PUMP (READ CAPTION)Hi trader's what do you think about gold
Gold (XAUUSD) is currently showing a bullish trade structure, with price respecting key demand zones and buyers maintaining control on pullbacks. The overall market behavior supports further upside continuation as long as price holds above major support areas.
🔹 Support Zone: 4307
This is the primary bullish support zone where buyers are actively defending price.
Holding above 4307 keeps the bullish bias valid.
🔹 Strong Bullish Zone: 4286–4273
This area represents a strong demand and accumulation zone.
Any pullback into 4286–4273 is considered a high-probability buying region, where strong bullish reactions are expected.
🔹 Resistance Zone: 4348
This is the first upside resistance, where price may face temporary rejection or consolidation.
A clean breakout and close above 4348 will confirm bullish continuation.
🔹 Supply Zone: 4373
This is the major upside target and supply area.
If Gold breaks above 4348, price is likely to extend toward the 4373 supply zone, where sellers may attempt to slow the move.
A strong breakout above this zone could signal further upside expansion.
📈 Market Outlook
Holding above 4307 → Bullish continuation expected
Pullback into 4286–4273 → Strong buy reaction zone
Break above 4348 → Opens path toward 4373 supply
Supply zone reaction will define next directional move
don't forget to like comment and follow

XAUUSD BULLISH MOVE (READ CAPTION)Hello trader's what do you think about gold
Gold (XAUUSD) is currently maintaining a bullish market structure, as price continues to respect key support zones and shows strong buyer interest on pullbacks. The overall price action suggests a potential continuation toward higher levels.
🔹 Support Zone: 4263
This is the primary bullish support zone where buyers are actively defending price.
As long as Gold holds above 4263, the bullish bias remains valid.
🔹 Second Support: 4240
This level acts as a strong secondary support and deeper retracement area.
If price pulls back into 4240, it can offer a high-probability buying opportunity within the bullish trend.
🔹 Resistance: 4349
This is the key resistance level where price may face temporary rejection or consolidation.
A confirmed breakout above 4349 will strengthen bullish momentum.
🔹 Supply Zone: 4383
This zone represents the next upside target.
If Gold breaks and holds above 4349, price is likely to move toward the 4383 supply zone, where sellers may become active.
A strong breakout above this zone could signal further upside continuation.
📈 Market Outlook
Holding above 4263 / 4240 → Bullish continuation expected
Break above 4349 → Opens the path toward 4383 supply zone
Supply zone reaction will determine the next major move
please like comment and follow

BTCUSD BULLISH OR BEARISH (READ CAPTION)Hi trader's what do you think about BTCUSD
BTCUSD is currently showing a bullish market structure, with price holding above key demand areas and buyers actively defending lower levels. The overall price action suggests a potential upside continuation.
🔹 Support Zone: 86,500
This is the primary bullish support zone where buyers have previously stepped in.
As long as price holds above 86,500, bullish momentum remains intact.
🔹 Bounce Support: 85,000
This level represents a strong bounce support and deeper retracement area.
If BTC pulls back toward 85,000, it is expected to attract strong buyer interest and trigger a bullish bounce.
🔹 Supply Zone: 90,200
This is the major upside target and supply area.
If bullish momentum continues, price is likely to move toward 90,200, where sellers may attempt to slow down or reject the move.
📈 Market Outlook
Holding above 86,500 → Bullish continuation expected
Deep pullback toward 85,000 → Strong buy reaction zone
Upside target → 90,200 supply zone
Supply zone reaction will define the next major move
The structure supports a bullish pullback → continuation setup, favoring buyers unless key supports break.
please don't forget to like comment and follow

XAUUSD READY FOR FLY (READ CAPTION)Hi trader's
Gold is currently showing a bullish bias as long as the price holds above the major support zones.
🔹 Support Levels:
4209: The first strong support zone where buyers may step in to push the price higher.
4196: The second, deeper support level. If price dips here, strong demand is likely to build.
🔹 Resistance Levels:
4240: The first immediate resistance. A breakout above this level could trigger the next bullish move.
4260 (Supply Zone): A major supply area where sellers may attempt to push the price down. A clean break above this zone can lead to strong bullish continuation.
🔹 Bias:
The market structure continues to form higher lows, supporting the bullish sentiment. As long as price stays above the support levels, upside targets remain valid.
please like comment and follow thank you

Nifty 50 Chart Analysis: Key Support, ResistanceGet the latest insights into the Nifty 50 as markets brace for action! As of today, September 25, 2025, at 03:15 PM IST, our technical analysis dives deep into the Nifty 50's recent performance, spotlighting critical support and resistance levels, and offering a bold prediction for tomorrow, September 26, 2025. Buckle up for a data-driven breakdown that could shape your trading strategy!
EMA Insights: Riding the Trend Waves
The Nifty 50 chart reveals a fascinating dance with its Exponential Moving Averages (EMAs). The 20-period EMA hovers around 25,042, acting as a short-term pivot, while the 50-period EMA (25,040-25,132) and 200-period EMA (around 25,132) underpin a broader bullish trend. Recently, the index dipped below the 20 EMA, signaling short-term weakness, but its position above the 50 and 200 EMAs keeps long-term optimism alive. Watch for a potential bearish crossover that could trigger further declines if momentum shifts.
RSI Breakdown: Neutral Territory Holds the Key
The Relative Strength Index (RSI) stands at 52.17, placing it in neutral territory (45-55). This balance suggests no immediate overbought or oversold conditions, with recent bearish candlesticks hinting at caution. An RSI above 50 still supports consolidation, but traders should stay alert for any breakouts that could signal the next big move.
Support and Resistance Levels to Watch
Key support levels are emerging as critical battlegrounds. The psychological mark of 25,000, reinforced by recent lows, offers immediate cushioning, with stronger support at 24,900 (aligned with the 50-day EMA and 50% Fibonacci retracement). A deeper drop could test 24,400. On the upside, resistance kicks in at 25,600 (past highs) and 25,630. A breakout above 25,600 could ignite bullish momentum, while a fall below 25,000 might accelerate selling toward 24,900.
Tomorrow's Market Prediction: What to Expect
Looking ahead to September 26, 2025, the Nifty 50 is poised for a cautious start, likely consolidating around the 25,000 support. A close below this level could spark a decline toward 24,900, fueled by recent EMA softness. However, a rebound from 25,000-25,042 (20 EMA) with strong volume might push prices toward 25,600. The bias leans neutral, with global cues and an opening above 25,100 as key bullish triggers. Stay tuned!
This analysis blends cutting-edge technical tools with real-time market vibes, making it a must-read for investors and traders alike. Bookmark this page for updates, and let’s navigate the Nifty 50’s next move together!

SILVER (XAG/USD)-RESISTANCE AND SUPPORT (READ CAPTION)Hello!
Resistance: 40.700
Support: 40.500
Demand Zone: 39.600
Risk Level (Invalidation): 41.200
Silver is currently consolidating between 40.500 support and 40.700 resistance.
If buyers defend the support, price may attempt a move toward resistance.
A breakout above 40.700 could extend the bullish momentum.
If support fails, the next strong demand zone is at 39.600, where buyers may step back in.
For risk management, 41.200 is the invalidation level — if price moves above this, bearish setups become unsafe
For more safe chart updates and analysis, you can follow my profile.

Breakout in Dave Inc...Chart is self explanatory. Levels of breakout, possible up-moves (where stock may find resistances) and support (close below which, setup will be invalidated) are clearly defined.
Disclaimer: This is for demonstration and educational purpose only. This is not buying or selling recommendations. Please consult your financial advisor before taking any trade.

$GLD - bullish momentum soon to stallHello, I was bullish on AMEX:GLD for a bit and now examining the charts, multiple frames, this may be setting up for a good short. If geopolitics and tariff talks deescalate then this should cool off. The Elliot wave placed indicates some time for a correction/pull back on this hot commodity and the candle on the Daily from Friday is a spinning stop doji which can indicate reversal in an uptrend. Also, we have so many gaps up that happened in 3 day span, crazy actually. I labeled areas of targets to fill these gaps. Expecting a retracement to $280.
WSL.

Breakout in Organogenesis Holdings Inc...Chart is self explanatory. Levels of breakout, possible up-moves (where stock may find resistances) and support (close below which, setup will be invalidated) are clearly defined.
Disclaimer: This is for demonstration and educational purpose only. This is not buying or selling recommendations. Please consult your financial advisor before taking any trade.

Breakout in Innodata Inc...Chart is self explanatory. Levels of breakout, possible up-moves (where stock may find resistances) and support (close below which, setup will be invalidated) are clearly defined.
Disclaimer: This is for demonstration and educational purpose only. This is not buying or selling recommendations. Please consult your financial advisor before taking any trade.

Mahindra and Mahindra next target buy rally?Mahindra and Mahindra takes a first target for harmonic pattern
and take off entry on breaker block
at CMP we can see a FVG also a extreme supply on that area if market breaks extreme supply around 3200 we can expect huge up side rally 3270,3440,also extreme target of 3700
lets be patient to close above supply and take a perfect entry
📌 Please support me with your likes 🤞🏻 and comments 💬 to motivate me to share more analysis with you and share your any opinion about the possible trend of this chart with me !
Best Regards , Davis 🥰
Hit the like 🤞🏻 button to !! Motive some energy !!🥇
📌 Note :
⨻ Check the live market updates and analysis yourself before buy 📈🔺 or sell 📉🔻
⨺ Am not giving any advisory or signals its just my idea for upgrade my knowledge 📚 in trading
⨹ This is my pre and post market analysis to improve my trading journey 🚀
⨂ Am Not suggesting anyone to buy or sell ❌ am just giving my views 👀
⫸ You are responsible for your trading ✅ not me ❌ ⫷
HAPPY TRADING 🥰

Voltamp Transformers Limited - Breakout Setup, Move is ON...#VOLTAMP trading above Resistance of 13100
Next Resistance is at 16496
Support is at 9705
Here are previous charts:
Chart is self explanatory. Levels of breakout, possible up-moves (where stock may find resistances) and support (close below which, setup will be invalidated) are clearly defined.
Disclaimer: This is for demonstration and educational purpose only. This is not buying or selling recommendations. I am not SEBI registered. Please consult your financial advisor before taking any trade.

Ircon International Ltd - Breakout Setup, Move is ON...#IRCON trading above Resistance of 298
Next Resistance is at 423
Support is at 211
Here are previous charts:
Chart is self explanatory. Levels of breakout, possible up-moves (where stock may find resistances) and support (close below which, setup will be invalidated) are clearly defined.
Disclaimer: This is for demonstration and educational purpose only. This is not buying or selling recommendations. I am not SEBI registered. Please consult your financial advisor before taking any trade.

Glenmark Pharmaceuticals Limited - Breakout Setup, Move is ON...#GLENMARK trading above Resistance of 1262
Next Resistance is at 1943
Support is at 970
Here are previous charts:
Chart is self explanatory. Levels of breakout, possible up-moves (where stock may find resistances) and support (close below which, setup will be invalidated) are clearly defined.
Disclaimer: This is for demonstration and educational purpose only. This is not buying or selling recommendations. I am not SEBI registered. Please consult your financial advisor before taking any trade.
