EUR/USD SHORT FROM RESISTANCE
EUR/USD SIGNAL
Trade Direction: short
Entry Level: 1.157
Target Level: 1.145
Stop Loss: 1.166
RISK PROFILE
Risk level: medium
Suggested risk: 1%
Timeframe: 1D
Disclosure: I am part of Trade Nation's Influencer program and receive a monthly fee for using their TradingView charts in my analysis.
✅LIKE AND COMMENT MY IDEAS✅
Techincalanalysis

AUD/CHF BEARS WILL DOMINATE THE MARKET|SHORT
Hello, Friends!
AUD/CHF is trending down which is clear from the red colour of the previous weekly candle. However, the price has locally surged into the overbought territory. Which can be told from its proximity to the BB upper band. Which presents a classical trend following opportunity for a short trade from the resistance line above towards the demand level of 0.520.
Disclosure: I am part of Trade Nation's Influencer program and receive a monthly fee for using their TradingView charts in my analysis.
✅LIKE AND COMMENT MY IDEAS✅

NZD/CHF SENDS CLEAR BEARISH SIGNALS|SHORT
Hello, Friends!
NZD/CHF pair is in the downtrend because previous week’s candle is red, while the price is clearly rising on the 1D timeframe. And after the retest of the resistance line above I believe we will see a move down towards the target below at 0.453 because the pair is overbought due to its proximity to the upper BB band and a bearish correction is likely.
Disclosure: I am part of Trade Nation's Influencer program and receive a monthly fee for using their TradingView charts in my analysis.
✅LIKE AND COMMENT MY IDEAS✅

XAUUSD – Ascending channel in play, eyes on the 4,240 regionXAUUSD – Ascending channel in play, eyes on the 4,240 region
Brian – Buying the dip within structure, watching for a fade at higher resistance
Market overview & structure
On the H4 chart, gold is trading neatly inside a well-defined ascending channel, printing higher highs and higher lows. The current leg is pushing up towards the 4,237–4,240 area, which lines up with:
The upper boundary of the channel
A key resistance zone
The 1.618 Fibonacci extension and resting liquidity above recent highs
So for now, the broader bias remains bullish, but as price creeps closer to 4,240, the risk of profit-taking and short-term selling naturally increases.
Wave & technical context
This move is an extension of the previous bullish structure after price broke out of the old descending channel and started to build a new bullish one.
Liquidity levels around 4,193 and above suggest the market has been building positions and still has room to drive price into the higher resistance band.
The buy zone around 4,154–4,157, near the lower edge of the channel, is where buyers are likely to step back in to defend the trend.
As long as price holds above 4,150–4,154, the continuation scenario towards 4,240 remains the higher-probability path.
Key zones & trading plan
Primary scenario – Buy with the trend
Buy zone: 4,154–4,157 (channel support + marked buy zone).
Idea: Wait for a pullback towards the lower boundary of the channel, or a brief liquidity sweep into this region, then look for a clear rejection candle on H1/H4 before going long.
Targets:
Short term: 4,190–4,200 (mid-channel / interim liquidity).
Extended: 4,237–4,240 (major resistance + 1.618 Fib extension).
This is a trend-following “buy the dip” setup, more suited to swing and short-term position traders rather than scalpers.
Secondary scenario – Short-term fade from 4,237–4,240
Sell zone: 4,237–4,240 – confluence of strong resistance and the 1.618 Fibonacci extension.
Idea: If price tags this zone and shows clear rejection (long upper wicks, bearish reversal pattern on H1/M15), it may offer a counter-trend short back towards the middle of the channel or the 4,190–4,200 support area.
As this is a counter-trend play:
Keep position size smaller than the main long idea.
Use a tight stop above 4,240 and avoid widening it out of emotion.
Macro and liquidity backdrop
Liquidity is likely to thin out towards the end of the session with the US Thanksgiving period in play, which can lead to the odd sharp spike or stop-hunt, especially around obvious liquidity pools.
On the political front, headlines such as Mr Trump’s comments about “permanently suspending immigration from third-world countries” add to broader policy uncertainty, but the impact on gold is indirect via risk sentiment rather than a direct driver.
It’s also worth noting that silver has been rallying strongly, supported by solar-related demand and supply concerns – a bit of a “silent workhorse” at the moment. That doesn’t remove gold’s role, but it does show that precious metals as a whole are attracting capital.
Strategy & risk management
For now, my focus is on buying dips around 4,154–4,157 in line with the ascending channel, and only looking for tactical shorts if price clearly rejects the 4,237–4,240 band.
I prefer not to open fresh trades when US liquidity is extremely thin or straight into major holiday sessions, as spreads can widen and price can behave erratically.
If we see a decisive close below the buy zone and a clean break of the channel structure, this bullish plan is invalidated – at that point it’s better to step aside and reassess rather than forcing trades.
What do you reckon – does this structure still favour the bulls, or are you leaning towards a deeper correction from the 4,240 region? Feel free to share your view in the comments.

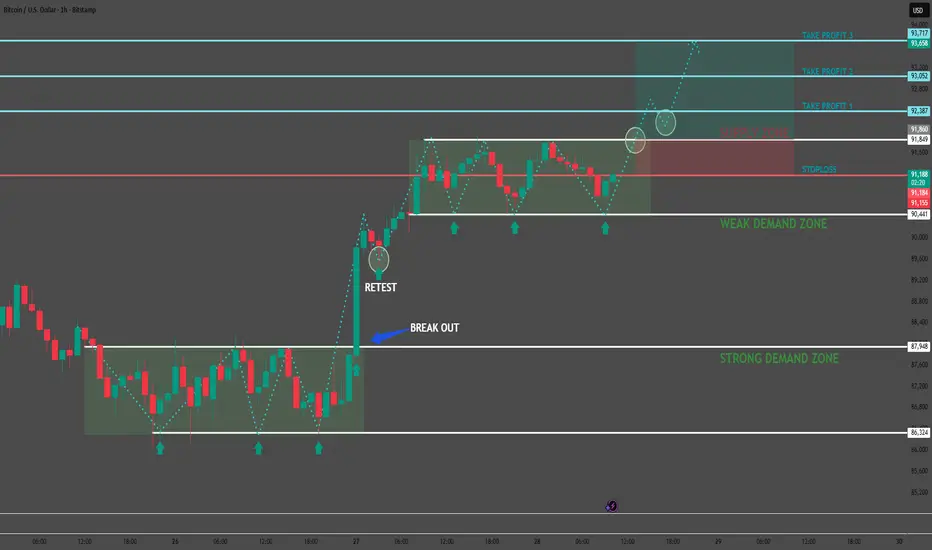
Bitcoin Loading a Breakout Continuation 📌 TECHNICAL ANALYSIS — BTC/USD (1H)
The market continues to maintain a clear bullish structure, with a consistent sequence of higher lows (HL) forming directly inside the Weak Demand Zone. After breaking out of the previous consolidation range, price delivered a clean retest, followed by a strong impulsive move upward confirming solid buy-side absorption.
🎯 PRIMARY SCENARIO — Continuation to the Upside
- As long as price holds above 90,850, the bullish structure remains intact.
- The Weak Demand Zone continues acting as a launchpad for bullish continuation.
- A decisive break above 92,387 will likely accelerate momentum and open the door for extended upside targets.
📈 TRADE SETUP (Precision Levels)
- Buy Entry: 91,250 – 91,350
(A pullback into equilibrium before continuation)
- Stop Loss: 90,850
(Protected below demand + previous swing low to avoid noise)
- Take Profit Levels:
TP1: 92,387
TP2: 93,052
TP3: 93,717
📌 TRADE RATIONALE
- The market is printing a textbook Higher High – Higher Low structure.
- Breakout followed by a clean retest confirms trend continuation.
- Demand zones show strong absorption — no lower lows created.
- Clear liquidity void above → high probability for price expansion into higher targets.
- The supply structure above is thin, increasing the likelihood of a breakout.
🔍 SUMMARY
BTC is currently behaving exactly as expected within a bullish continuation model.
As long as 90,850 holds, upside projection toward 92,387 → 93,717 remains the highest-probability scenario.
Stay disciplined — every candle tells a story, but only a patient trader profits from the ending.
Share your thoughts in the comments — what’s your bias on the next move?
ANFIBO XAUUSD – Holiday Range or Surprise Breakout? [11.27]Hi guys, Anfibo’s here!
XAUUSD Intraday Trading Plan
Overall Picture
On M30, gold is trading inside a tightening rising structure, with price repeatedly bouncing between local support and descending short-term resistance. Liquidity is thin due to the holiday period, so the market is compressing in a narrow range instead of showing a clear trend.
Key things on the chart:
Upper trendline + horizontal resistance around 4170–4175 is acting as a sell zone.
Local supports are stacked around 4143 – 4136, with a major liquidity pocket / demand zone near 4110 labeled “Strong Liquidity”.
Because of low volume and mixed flows, the safest approach is to trade the edges or wait for a clean breakout of this range.
On the macro side, USD is correcting as markets price in a more dovish Fed path, while Thanksgiving liquidity is thin. According to ING, recent USD moves are more about rate expectations than geopolitics, and the low-liquidity environment can also invite occasional volatility spikes, especially in pairs like USD/JPY. All of this supports a choppy, indecisive environment for gold in the short term.
Trading Plan – Fade the Edges, Respect the Range
We’ll work with two tactical setups:
a sell from resistance and a buy from deep liquidity support.
>>> Scenario #1 – SELL from 4173 Resistance Zone
If price drifts back into the upper boundary and reacts bearishly, I’ll look for short setups:
Sell entry: 4173 – 4175
Stop loss: 4180
Take profit levels:
TP1: 4162
TP2: 4150
TP3: 4122
TP4: 4110 (strong liquidity / demand)
Idea: fade the holiday squeeze into resistance, targeting a move back toward mid-range support and eventually the liquidity zone at 4110 if downside extends.
>>> Scenario #2 – BUY from the Strong Liquidity Zone
If price flushes down into the 4110 area and shows strong rejection, I’ll switch to a buy-the-dip plan:
Buy entry: 4110 – 4112
Stop loss: 4104
Take profit levels:
TP1: 4133
TP2: 4150
TP3: 4172
TP4: 4190 (if market breaks above the current range)
Idea: participate in a liquidity grab at the bottom of the structure, aiming for a bounce back into the core of the range and potentially a breakout if volume returns.
Key Intraday Levels to Watch
Resistance / Sell zone: 4167 – 4175
Mid-range supports: 4143 – 4136
Major liquidity support: 4110 – 4112
A clean break and hold outside this band would signal the next directional move; until then, this is a range market.
Risk Management
Holiday liquidity can be tricky – avoid over-leveraging and keep positions smaller than usual.
Wait for clear rejection or confirmation at planned levels; avoid trading in the noisy middle of the range.
Maintain Risk:Reward ≥ 1:2 for both buy and sell setups.
Do not hold both directions simultaneously; follow the scenario that price confirms first.
If price breaks and holds beyond your SL zone (above 4180 or below 4104), close the idea and reassess instead of forcing re-entries.
Conclusion
Gold is stuck in a narrow holiday range, squeezed between resistance near 4175 and liquidity support around 4110. With USD adjusting to softer Fed expectations and volumes thin, the best edge comes from patiently trading the extremes or standing aside until price finally breaks out.
TRADE THE EDGES, RESPECT THE RANGE, AND LET THE MARKET SHOW ITS HAND, GUYS!

BITCOIN BEARS ARE GAINING STRENGTH|SHORT
BITCOIN SIGNAL
Trade Direction: short
Entry Level: 91,634.79
Target Level: 81,942.62
Stop Loss: 98,078.49
RISK PROFILE
Risk level: medium
Suggested risk: 1%
Timeframe: 9h
Disclosure: I am part of Trade Nation's Influencer program and receive a monthly fee for using their TradingView charts in my analysis.
✅LIKE AND COMMENT MY IDEAS✅

CAD/CHF SELLERS WILL DOMINATE THE MARKET|SHORT
CAD/CHF SIGNAL
Trade Direction: short
Entry Level: 0.573
Target Level: 0.570
Stop Loss: 0.575
RISK PROFILE
Risk level: medium
Suggested risk: 1%
Timeframe: 6h
Disclosure: I am part of Trade Nation's Influencer program and receive a monthly fee for using their TradingView charts in my analysis.
✅LIKE AND COMMENT MY IDEAS✅

NZD/CAD BEARISH BIAS RIGHT NOW| SHORT
Hello, Friends!
NZD/CAD pair is trading in a local uptrend which we know by looking at the previous 1W candle which is green. On the 3H timeframe the pair is going up too. The pair is overbought because the price is close to the upper band of the BB indicator. So we are looking to sell the pair with the upper BB line acting as resistance. The next target is 0.794 area.
Disclosure: I am part of Trade Nation's Influencer program and receive a monthly fee for using their TradingView charts in my analysis.
✅LIKE AND COMMENT MY IDEAS✅

AUD/CAD BEST PLACE TO SELL FROM|SHORT
Hello, Friends!
We are going short on the AUD/CAD with the target of 0.910 level, because the pair is overbought and will soon hit the resistance line above. We deduced the overbought condition from the price being near to the upper BB band. However, we should use low risk here because the 1W TF is green and gives us a counter-signal.
Disclosure: I am part of Trade Nation's Influencer program and receive a monthly fee for using their TradingView charts in my analysis.
✅LIKE AND COMMENT MY IDEAS✅

USD/JPY BEST PLACE TO SELL FROM|SHORT
USD/JPY SIGNAL
Trade Direction: short
Entry Level: 157.226
Target Level: 155.990
Stop Loss: 158.047
RISK PROFILE
Risk level: medium
Suggested risk: 1%
Timeframe: 2h
Disclosure: I am part of Trade Nation's Influencer program and receive a monthly fee for using their TradingView charts in my analysis.
✅LIKE AND COMMENT MY IDEAS✅

NZD/USD BULLS ARE STRONG HERE|LONG
Hello, Friends!
NZD/USD pair is in the downtrend because previous week’s candle is red, while the price is clearly falling on the 9H timeframe. And after the retest of the support line below I believe we will see a move up towards the target above at 0.568 because the pair oversold due to its proximity to the lower BB band and a bullish correction is likely.
Disclosure: I am part of Trade Nation's Influencer program and receive a monthly fee for using their TradingView charts in my analysis.
✅LIKE AND COMMENT MY IDEAS✅

EUR/NZD SENDS CLEAR BEARISH SIGNALS|SHORT
Hello, Friends!
EUR/NZD pair is trading in a local uptrend which we know by looking at the previous 1W candle which is green. On the 12H timeframe the pair is going up too. The pair is overbought because the price is close to the upper band of the BB indicator. So we are looking to sell the pair with the upper BB line acting as resistance. The next target is 2.033 area.
Disclosure: I am part of Trade Nation's Influencer program and receive a monthly fee for using their TradingView charts in my analysis.
✅LIKE AND COMMENT MY IDEAS✅

XAU/USD: Gold Stagnates, Poised for a Strong Surge📊 Market Structure
Gold is moving in a tight accumulation phase (compression) between two important zones:
• OB Support: 4,130 – 4,126
• Resistance – Small Supply: 4,148 – 4,166
The previous trend remains a strong uptrend (clear BoS sequence from 4,089), and currently, the price is retesting the newly formed peak-bottom structure.
The BUY side is still in control as long as the price stays above:
• 4,130 – Main OB Support
• 4,104 – Discount FVG
• 4,089 – Key Low Confirming Trend
If gold holds these zones, the next targets will be the upper liquidity levels:
• 4,166
• 4,181
• 4,207
• 4,243
💎 Key Technical Zones
• OB Support 1: 4,130 – 4,126
• FVG Zone: 4,104 – 4,089 (best discount)
• Deep Bearish OB: 4,060 – 4,045 (if price drops sharply)
• Upper Liquidity Targets: 4,166 → 4,181 → 4,207 → 4,243
🎯 Trading Plan (Priority BUY)
1️⃣ BUY 1 – Retest OB 4,130
When the price touches the OB support zone 4,130 – 4,126 and shows a bounce signal (rejection / engulfing).
• Entry: 4,130 – 4,126
• SL: below 4,115
• TP1: 4,166
• TP2: 4,181
• TP3: 4,207
• TP4: 4,243
→ Quick setup, good RR, trend aligned.
2️⃣ BUY 2 – Discount FVG 4,104 – 4,089
This is the best BUY zone if the market drops sharply before rising.
• Entry: 4,104 – 4,089
• SL: 4,070
• TP1: 4,166
• TP2: 4,181
• TP3: 4,207
• TP4: 4,243
→ Strong confluence: FVG + fibo discount + key liquidity.
3️⃣ BUY 3 – Deep Accumulation at Bearish OB Shift
• Entry: 4,060 – 4,045
• SL: 4,020
• TP: 4,104 → 4,166 → 4,207
→ Only activate if “flush liquidity” appears.
🎯 SELL Scalp (secondary – not priority)
Only SELL when there is a clear rejection reaction at:
• 4,166 – first liquidity sweep zone
• 4,181 – strong reaction zone
• 4,207 – main bearish OB
• 4,243 – large liquidity peak
• SL: 10–15 USD
• TP: 4,148 → 4,130
→ For scalpers only, not a main setup.
🧠 Vincent’s View
The market structure remains completely bullish. The market is accumulating energy in a narrow range before breaking strongly to the upper liquidity targets.
As long as gold stays above 4,089 – the uptrend remains dominant.
“Patience builds the entry – liquidity completes the move.” ⚜️
⏰ Timeframe: 1H
✍️ Analysis by: Captain Vincent

XAUUSD – H1 uptrend channel, short-term downside risk increasingXAUUSD – H1 uptrend channel, short-term downside risk increasing Brian – Prioritize short selling at the channel peak, wait to buy back at lower support
I. Strategy Summary Gold is trading in an uptrend channel on H1, but the rise around 4.160 shows signs of weakening, increasing short-term correction risk.
Preferred Scenario: Short sell at the channel peak 4.162–4.164, targeting support areas 4.145 – 4.130 – 4.115 – 4.100.
After the correction, the 4.100–4.080 area may become the foundation for the next rise in the larger trend.
Important price areas to watch: 4.139 – 4.127 – 4.110 – 4.088.
II. Macro Context & News 27/11
02:00 – Fed releases Beige Book This document updates the Fed branches' assessment of the US economic situation.
Describing slower growth, cooling price pressures will further reinforce expectations that the Fed will soon cut interest rates → supporting gold.
Conversely, if the Beige Book describes the economy as still “resilient,” the market may temporarily slow down pricing in rate cuts → causing a short-term adjustment for gold.
19:30 – ECB releases October meeting minutes
If the minutes lean towards the scenario of keeping high interest rates longer, the EUR may be supported, indirectly affecting the USD and gold inflows.
However, the impact is usually not as strong as US data, mainly affecting the overall risk-on/risk-off sentiment.
General Context: Gold has surpassed 4.160 USD/oz as the market increasingly expects the Fed to cut interest rates as early as December, reducing the appeal of interest-bearing assets and increasing the allure of gold – a non-yielding asset. This creates a support foundation for the medium-term uptrend, but after a hot rise, technical adjustments on H1 are normal.
III. Technical Structure – H1 uptrend channel
The price is within the H1 uptrend channel, with rising peaks and troughs, but the upper area near 4.160 coincides with:
The upper boundary of the price channel. The “Sell POC” area on the chart – where liquidity and sell orders are concentrated.
Preferred scenario on the chart: The price may slightly rebound to the POC area 4.162–4.164, then be rejected and slide to the important support area around 4.110 before extending the adjustment down to 4.100–4.080.
The lower trendline of the uptrend channel also acts as a short-term buy area if a clear candle reaction appears.
Notable price areas on H1: Resistance: 4.162–4.164 (channel peak + POC). Intermediate support: 4.139 – 4.127 – 4.110. Deep support: 4.088 – 4.080 – 4.100 (area that may form the bottom for the next rise).
IV. Trading Plan 1. Preferred Scenario – Short sell at the channel peak Idea: Short sell when the price rebounds to the upper boundary of the H1 uptrend channel and POC 4.162–4.164, expecting a correction to support.
Sell: 4.162–4.164 SL: 4.168 TP targets: TP1: 4.145 TP2: 4.130 TP3: 4.115 TP4: 4.100
This is a counter-move order in the uptrend channel, only targeting a short-term correction, not a major trend reversal scenario.
2. Supplementary Scenario – Short buy at support trendline Idea: When the price hits the lower trendline of the H1 uptrend channel and a nice candle reaction appears, consider a short-term buy according to the channel, prioritizing areas:
4.139 – 4.127 – 4.110 – 4.088
Specific Entry/SL levels will depend on the actual price reaction at the trendline, but the general principle:
Buy close to the trendline,
SL placed below the immediate support area,
TP aimed at the middle of the channel or the nearest resistance.
V. Risk Management & Notes
Do not open new positions right before or at the time of the Beige Book and ECB minutes release, as volatility may suddenly increase, widening spreads.
The sell order at 4.162–4.164 is a short-term counter-trend order in the uptrend channel, requiring moderate volume and strict adherence to SL 4.168.
If the price clearly breaks and holds above the 4.170 area, the H1 correction scenario weakens – in that case, stay out, wait for a new structure instead of trying to maintain a sell view.

$BTC: BOTTOMING ATTEMPT I highlighted the Double Top formation with a target of 89,000, which has now been surpassed. Technically, the long-term uptrend has been significantly weakened by the loss of the trend line that connected the HIGHER LOWS lows since August 2024. Bitcoin (BTC) has not been this oversold since June 2022. Currently, BTC shows three consecutive weekly candlesticks below the lower Bollinger Band. Today, we observed a slight improvement in the likelihood of a market bottom, as BTC reclaimed the 89,000-resistance level with a sudden rise. It is crucial to maintain the current weekly higher low at 85,200. A short covering squeeze could help push the price to the resistance level at 98,250, where the 0.382 retracement lies, and there appears to be a potential air pocket.
The market would benefit from the Federal Reserve's supportive measures to enhance liquidity and drive momentum higher.
Positive news for BTC includes:
• The probability of a December rate cut has risen to 85%, up from 30% one week ago.
• There are reports of potential discussions to replace Fed Chair Powell.
• Former President Trump’s reported candidate: Kevin Hassett (an ally known for a pro-tariff approach and dovish stance).
Takeaway:
Today's recovery above the 89,000-resistance level modestly increases the likelihood of a market bottom. The current weekly higher low at 85,200 must be preserved. A short-covering rally could facilitate further gains toward the next resistance at 98,250, which aligns with the 0.382 retracement level, as there may be a potential air pocket.

AIRARABIA - 4 months CUP & HANDLE══════════════════════════════
Since 2014, my markets approach is to spot
trading opportunities based solely on the
development of
CLASSICAL CHART PATTERNS
🤝Let’s learn and grow together 🤝
══════════════════════════════
Hello Traders ✌
After a careful consideration I came to the conclusion that:
- it is crucial to be quick in alerting you with all the opportunities I spot and often I don't post a good pattern because I don't have the opportunity to write down a proper didactical comment;
- since my parameters to identify a Classical Pattern and its scenario are very well defined, many of my comments were and would be redundant;
- the information that I think is important is very simple and can easily be understood just by looking at charts;
For these reasons and hoping to give you a better help, I decided to write comments only when something very specific or interesting shows up, otherwise all the information is shown on the chart.
Thank you all for your support
🔎🔎🔎 ALWAYS REMEMBER
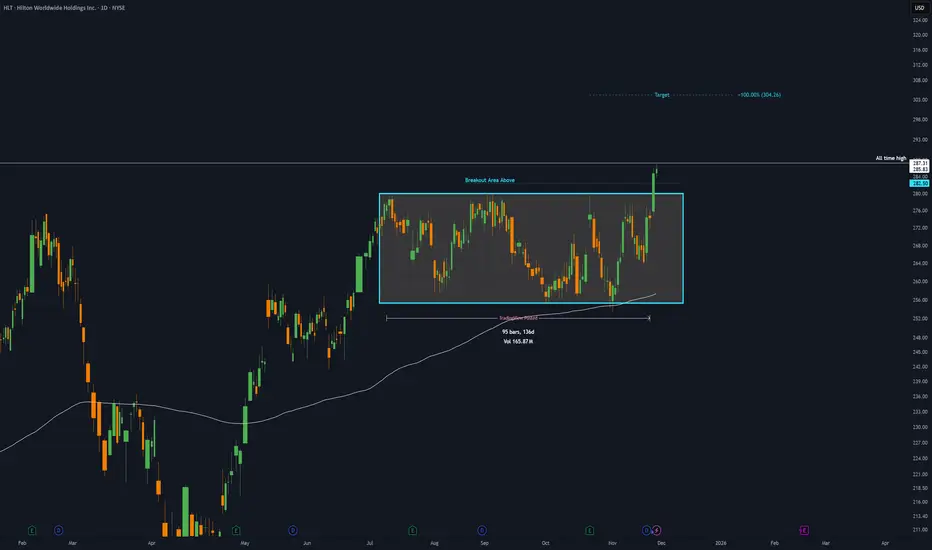
"A pattern IS NOT a Pattern until the breakout is completed. Before that moment it is just a bunch of colorful candlesticks on a chart of your watchlist"
═════════════════════════════
⚠ DISCLAIMER ⚠
The content is The Art Of Charting's personal opinion and it is posted purely for educational purpose and therefore it must not be taken as a direct or indirect investing recommendations or advices. Any action taken upon these information is at your own risk.

HLT - 4 months RECTANGLE══════════════════════════════
Since 2014, my markets approach is to spot
trading opportunities based solely on the
development of
CLASSICAL CHART PATTERNS
🤝Let’s learn and grow together 🤝
══════════════════════════════
Hello Traders ✌
After a careful consideration I came to the conclusion that:
- it is crucial to be quick in alerting you with all the opportunities I spot and often I don't post a good pattern because I don't have the opportunity to write down a proper didactical comment;
- since my parameters to identify a Classical Pattern and its scenario are very well defined, many of my comments were and would be redundant;
- the information that I think is important is very simple and can easily be understood just by looking at charts;
For these reasons and hoping to give you a better help, I decided to write comments only when something very specific or interesting shows up, otherwise all the information is shown on the chart.
Thank you all for your support
🔎🔎🔎 ALWAYS REMEMBER
"A pattern IS NOT a Pattern until the breakout is completed. Before that moment it is just a bunch of colorful candlesticks on a chart of your watchlist"
═════════════════════════════
⚠ DISCLAIMER ⚠
The content is The Art Of Charting's personal opinion and it is posted purely for educational purpose and therefore it must not be taken as a direct or indirect investing recommendations or advices. Any action taken upon these information is at your own risk.
PHVS - 19 months HEADS & SHOULDERS══════════════════════════════
Since 2014, my markets approach is to spot
trading opportunities based solely on the
development of
CLASSICAL CHART PATTERNS
🤝Let’s learn and grow together 🤝
══════════════════════════════
Hello Traders ✌
After a careful consideration I came to the conclusion that:
- it is crucial to be quick in alerting you with all the opportunities I spot and often I don't post a good pattern because I don't have the opportunity to write down a proper didactical comment;
- since my parameters to identify a Classical Pattern and its scenario are very well defined, many of my comments were and would be redundant;
- the information that I think is important is very simple and can easily be understood just by looking at charts;
For these reasons and hoping to give you a better help, I decided to write comments only when something very specific or interesting shows up, otherwise all the information is shown on the chart.
Thank you all for your support
🔎🔎🔎 ALWAYS REMEMBER
"A pattern IS NOT a Pattern until the breakout is completed. Before that moment it is just a bunch of colorful candlesticks on a chart of your watchlist"
═════════════════════════════
⚠ DISCLAIMER ⚠
The content is The Art Of Charting's personal opinion and it is posted purely for educational purpose and therefore it must not be taken as a direct or indirect investing recommendations or advices. Any action taken upon these information is at your own risk.

ANFIBO BTCUSD – Relief Rally or Deeper Flush? [11.26]
Hi guys, Anfibo’s here!
BTCUSD D1 Swing Trading Plan
Overall Picture
Bitcoin has just printed a sharp multi-day selloff on the D1 chart, breaking below the mid‐range support and tapping the 1.618 Fibonacci extension around the 80k zone. This move also cleaned out liquidity below recent lows – exactly where the chart marks “Liquidity taken”.
From here, price is likely to form a relief rally / corrective pullback rather than a full trend reversal. The key area I’m watching is the 0.618 – 0.786 retracement cluster from the last impulsive drop, which aligns with the 98k–99k zone and previous structure support now turning into resistance (“Support for confirmation reduction” on the chart).
As long as BTC trades below the 108k invalidation area, I’m treating any push into that resistance band as a shorting opportunity within a broader bearish leg.
Macro Context
Fundamentally, BTC is still trading in a risk-off environment:
Price has dropped around 20% in November, putting this month on track to be the worst November since 2018.
From the October all-time high, BTC is currently down about 36%, keeping it inside a bear-market zone despite occasional aggressive bounces.
Some forecasts suggest we could see a local bottom forming this week, but until structure confirms, we treat every rally as a potential lower high.
This backdrop fits well with a strategy of selling premium levels instead of chasing breakdowns late.
Trading Plan – Medium-Term SHORT Setup
We will react if price retraces into our pre-defined zone, not try to guess every candle.
>>> Scenario #1 – Short the 0.618–0.786 Retracement (Primary Plan)
If BTC continues its relief move toward the 98k–99k resistance band, I’ll look for bearish confirmation there:
Short entry: 98,000 – 99,000
Stop loss: 108,000 (above the resistance box and swing structure)
Take profit targets:
TP1: 77,000 – retest of the prior liquidity zone
TP2: 65,000 – next major downside support
TP3: 58,000 – confluence with the 2.618 Fibonacci extension (~56k area) and a deep psychological support zone
Idea: fade the corrective rally into premium prices, in line with the dominant D1 bearish swing. This is a swing short, not a scalp.
>>> Scenario #2 – No Deep Pullback, Direct Breakdown
If BTC fails to reclaim 90k convincingly and rolls over again from lower levels:
I will not chase shorts at the very bottom.
Instead, I’ll wait for a smaller intraday pullback to fresh resistance (for example, retests of broken supports below 90k) and mirror the same downside target area around 77k → 65k → 58k.
This keeps us aligned with the trend while avoiding emotional entries after vertical drops.
Risk Management
Treat this as a medium-term swing trade – keep position size modest and avoid over-leveraging.
Wait for clear bearish reaction (rejection wicks, momentum shift, or market structure break on lower timeframes) before entering around 98k–99k.
Maintain Risk:Reward ≥ 1:2 towards at least TP1; scale out gradually at the lower targets.
Do not average into losing shorts above 108k – that area is our structural invalidation.
If price reclaims and holds above 108k on D1, step aside and reassess the entire bearish thesis.
Conclusion
BTC remains in a bear-biased structure on D1 after a violent selloff and liquidity grab near 80k. While the market may be searching for a short-term bottom, the technical map still favors a corrective rally into resistance followed by another leg down, especially if price respects the 98k–99k supply zone.
By planning our shorts at clearly defined levels and respecting invalidation, we let the market come to us instead of chasing every move.
TRADE THE LEVELS, STAY DISCIPLINED, AND DON’T LET VOLATILITY CONTROL YOU, GUYS! 💛📉

ANFIBO XAUUSD – Elliott Wave Pullback or Continuation? [11.26]Gold XAUUSD – Elliott Wave Pullback or Continuation?
Hi guys, Anfibo’s here!
XAUUSD Short-Term Trading Plan
Overall Picture
On H1, gold is still trading inside a rising channel, but price has just completed a potential 5-wave impulsive leg into the upper boundary of the structure. From here, we’ve got short-term bearish confirmation around the 4147 area, suggesting that price may be entering an ABC corrective phase within the channel.
In other words:
Bigger picture: structure remains bullish as long as the channel holds.
Short term: I’m prepared for a corrective drop before the next directional leg.
On the macro side, fresh data show the U.S. is burning around 22B USD per day, with October spending at 688.7B vs 404B in tax revenue. The first month of fiscal year 2026 already printed a record 284.4B deficit, and interest payments alone reached 1.24T over the last 12 months – about 24 cents of every tax dollar going just to service debt.
This kind of fiscal pressure is structurally supportive for gold in the long run, but it doesn’t prevent short-term pullbacks inside the current channel.
Trading Plan – Playing the ABC Correction
I’m focusing on two key zones derived from the Elliott structure:
one for tactical sells from premium prices, and one for buys at the end of the correction.
>>> Scenario #1 – Tactical SELL from the Upper Zone (Short-Term Bearish)
If price retests the short-term bearish confirmation area and fills the upper liquidity zone, I’ll look for sell setups:
Sell entry: 4150 – 4152
Stop loss: 4158
Take profit levels: 4140 – 4133 – 4110 – 4088
Idea: fade the final push into the upper boundary / FVG area, targeting completion of wave A–B–C towards the mid and lower parts of the channel. This is a short-term play against the local high, not a long-term bearish view on gold.
>>> Scenario #2 – BUY the End of Wave C (Continuation with Trend)
If the ABC correction extends into the lower part of the short-term structure and shows bullish reaction, I’ll switch to a buy-the-dip plan:
Buy entry: 4130 – 4133
Stop loss: 4125
Take profit: 4145 – 4160
Idea: buy near the potential end of wave C, in confluence with channel support, for a continuation back toward the upper boundary and possibly a new impulsive leg.
Risk Management
Trade only when price respects one of the planned zones – no chasing in the middle of the range.
Always wait for clear confirmation (rejection wick, market structure shift, or strong reaction) before entering.
Keep risk per trade controlled and aim for Risk:Reward ≥ 1:2.
Do not hold both scenarios in opposite directions at the same time – choose the plan that the market confirms.
If price invalidates the structure (strong break beyond SL without reaction), step aside and reassess the wave count.
Conclusion
Gold is likely moving into an Elliott ABC correction phase inside a still-bullish channel. That gives us room for a tactical short from premium levels and a high-probability dip buy if price completes wave C lower. With macro debt and deficit pressures quietly supporting the long-term bullish case, this week is all about executing clean setups inside structure, not forcing trades.
STAY PATIENT, FOLLOW YOUR PLAN, AND TRADE WITH DISCIPLINE, GUYS! 💛📈

TSLA long-term TATesla stock is in uptrend on weekly time frame, but the distribution has started on mid-term, watch for $380 level to hold. If this level is broken it may go even lower to $360, let's keep an eye on it.

GOLD BEARS ARE STRONG HERE|SHORT
GOLD SIGNAL
Trade Direction: short
Entry Level: 4,167.31
Target Level: 3,975.91
Stop Loss: 4,294.65
RISK PROFILE
Risk level: medium
Suggested risk: 1%
Timeframe: 12h
Disclosure: I am part of Trade Nation's Influencer program and receive a monthly fee for using their TradingView charts in my analysis.
✅LIKE AND COMMENT MY IDEAS✅
