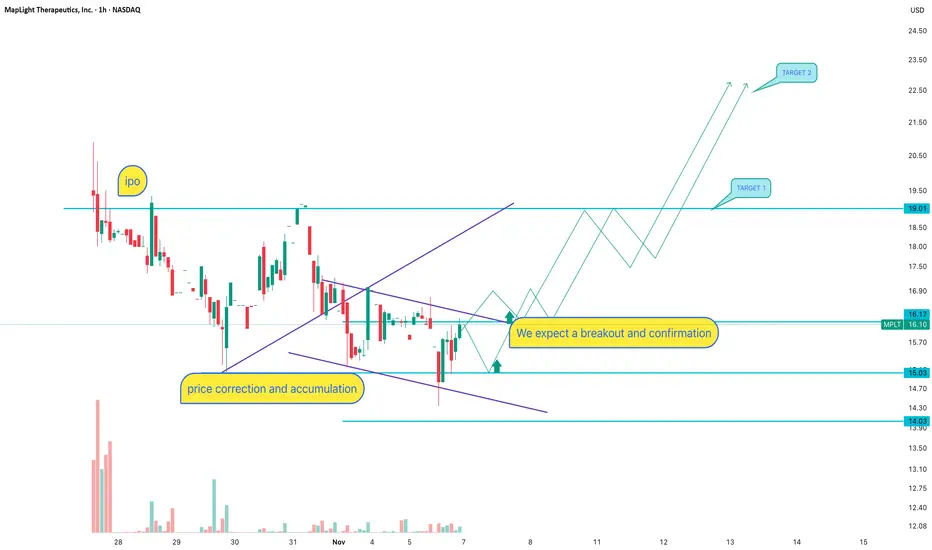
MPLT: Is the IPO working according to a scenarioAfter the IPO, the stock is forming a falling wedge — a classic post-listing accumulation pattern. Price is consolidating between the 15.03 support level and the accumulation zone. We see a trendline breakout attempt and price trying to hold above. The key resistance is 19.01, aligning with the previous consolidation range. Lowering volume indicates seller exhaustion. Scenario: breakout above 16.20 and confirmation gives a path toward target 1 at 19.01, with a potential impulse toward 22.50 (target 2). Entry only after breakout + retest. Without a retest, the risk of a fake breakout increases.
MPLT is a biotech company newly listed on NASDAQ. Post-IPO stocks often go through correction and accumulation while the market defines fair value. FDA updates or clinical trial results can act as catalysts — biotech names tend to move aggressively on news. If institutional interest increases, the trend may accelerate quickly.
If the breakout confirms — the rocket won’t wait for you to fasten your seatbelt. Let price show direction instead of forcing an entry inside noise.
Techincalanalysis
CHF/JPY SELLERS WILL DOMINATE THE MARKET|SHORT
CHF/JPY SIGNAL
Trade Direction: short
Entry Level: 190.016
Target Level: 189.715
Stop Loss: 190.214
RISK PROFILE
Risk level: medium
Suggested risk: 1%
Timeframe: 1h
Disclosure: I am part of Trade Nation's Influencer program and receive a monthly fee for using their TradingView charts in my analysis.
✅LIKE AND COMMENT MY IDEAS✅

EUR/GBP BULLISH BIAS RIGHT NOW| LONG
Hello, Friends!
It makes sense for us to go long on EUR/GBP right now from the support line below with the target of 0.880 because of the confluence of the two strong factors which are the general uptrend on the previous 1W candle and the oversold situation on the lower TF determined by it’s proximity to the lower BB band.
Disclosure: I am part of Trade Nation's Influencer program and receive a monthly fee for using their TradingView charts in my analysis.
✅LIKE AND COMMENT MY IDEAS✅

GOLD BEARS ARE STRONG HERE|SHORT
GOLD SIGNAL
Trade Direction: short
Entry Level: 4,007.34
Target Level: 3,924.43
Stop Loss: 4,062.61
RISK PROFILE
Risk level: medium
Suggested risk: 1%
Timeframe: 4h
Disclosure: I am part of Trade Nation's Influencer program and receive a monthly fee for using their TradingView charts in my analysis.
✅LIKE AND COMMENT MY IDEAS✅

GBP/CAD LONG FROM SUPPORT
GBP/CAD SIGNAL
Trade Direction: long
Entry Level: 1.846
Target Level: 1.890
Stop Loss: 1.817
RISK PROFILE
Risk level: medium
Suggested risk: 1%
Timeframe: 1D
Disclosure: I am part of Trade Nation's Influencer program and receive a monthly fee for using their TradingView charts in my analysis.
✅LIKE AND COMMENT MY IDEAS✅

GBP/JPY BEARS WILL DOMINATE THE MARKET|SHORT
Hello, Friends!
Previous week’s green candle means that for us the GBP/JPY pair is in the uptrend. And the current movement leg was also up but the resistance line will be hit soon and upper BB band proximity will signal an overbought condition so we will go for a counter-trend short trade with the target being at 200.420.
Disclosure: I am part of Trade Nation's Influencer program and receive a monthly fee for using their TradingView charts in my analysis.
✅LIKE AND COMMENT MY IDEAS✅

GBP/NZD SENDS CLEAR BEARISH SIGNALS|SHORT
Hello, Friends!
GBP/NZD is trending down which is evident from the red colour of the previous weekly candle. However, the price has locally surged into the overbought territory. Which can be told from its proximity to the BB upper band. Which presents a classical trend following opportunity for a short trade from the resistance line above towards the demand level of 2.296.
Disclosure: I am part of Trade Nation's Influencer program and receive a monthly fee for using their TradingView charts in my analysis.
✅LIKE AND COMMENT MY IDEAS✅

XAU/USD – Gold Forms New Liquidity Low, Buyers Return🔍 Market Context
Gold has completed a significant liquidity sweep around the 3,929 – 3,921 USD zone, clearing out the stop-losses of weak buyers before bouncing back strongly.
The bullish candle reaction at this zone indicates strong absorption from large capital flows, opening the possibility of forming a technical recovery wave towards the supply zone (OB – FVG) above.
In the short term, the market structure temporarily shifts to a bullish bias , as long as the price holds above this Liquidity Zone.
💎 Key Technical Zones
• Liquidity Sweep Zone: 3,929 – 3,921 USD → newly swept liquidity low, acting as main support.
• FVG 1: 3,951 – 3,959 USD → first target of the recovery wave.
• FVG 2: 3,977 – 3,985 USD → unfilled price balance zone.
• Order Block: 3,995 – 4,022 USD → strong supply resistance, expected reaction upon retest.
• Resistance Zone: 4,025 – 4,045 USD → watch for candle reactions to confirm upward momentum or reversal.
🎯 Trading Scenarios
1️⃣ BUY Setup – Liquidity Sweep Retest
• Entry: 3,932 – 3,922 USD (pullback to sweep zone)
• Stop Loss: below 3,912 USD
• Take Profit:
TP1: 3,965
TP2: 3,975
TP3: 3,987
TP4: 3,995
TP5: 4,022
➡️ “Buy the discount” strategy by Smart Money: buy after liquidity sweep to catch the technical rebound.
2️⃣ SELL Reaction – OB 4,022 USD
If the price approaches the OB 3,995 – 4,022 USD zone and shows reversal signals (strong rejection, bearish engulfing candle),
→ consider opening a short-term sell (counter-trend scalp)
• Entry: 4,015 – 4,020
• SL: 4,030
• TP: 3,990 → 3,970 → 3,940
⚙️ Market Structure
• Temporary uptrend line remains intact.
• Liquidity has been swept at the old low → confirming bullish ChoCH .
• Confluence structure of FVG + OB + trendline creates favorable conditions for recovery momentum.
📈 Summary
Gold has completed the old low liquidity sweep and is in a technical recovery phase.
As long as the price stays above 3,921 USD, the short-term trend leans towards bullish retracement .
Observe price reactions at the FVG 3,975 – 3,995 USD zone to determine buyer strength.
🔥 “Liquidity fuels direction — once the weak hands are out, the real move begins.”
⏰ Timeframe: 1H
📅 Updated: 05/11/2025
✍️ Analysis by: Captain Vincent

HTZ:From Breakdown to Breakout,Bullish Reversal Gaining TractionHertz Global Holdings, Inc. (NASDAQ: HTZ)
Technical Outlook: Potential Reversal Following Structural Breakout
Date : 5 November 2025
Summary
Hertz Global Holdings (HTZ) has exhibited signs of a potential medium-term trend reversal following a prolonged downtrend since mid-2023. Multiple bullish technical signals — including a breakout from key continuation patterns, RSI divergence, and sustained support retests — point toward a possible shift in market sentiment.
Price Action and Technical Developments
1. Downtrend continuation : Since July 2023, HTZ has been in a persistent downtrend, reinforced by a breakdown below major horizontal support.
2. Symmetrical triangle breakdown (Feb 2024) : The stock failed to hold within a consolidation structure, confirming bearish momentum at that stage.
3. Bullish divergence (Sept 2024) : Despite registering new price lows, the RSI formed higher highs, suggesting weakening downside momentum and potential for reversal.
4. Falling wedge breakout (Nov 2024) : Price action reversed from a classic bullish pattern, followed by a strong rally through the end of November.
5. Symmetrical triangle breakout (Apr 2025) : HTZ broke out of consolidation on elevated volume, coinciding with a break above the long-term descending trendline — a key technical inflection point.
6. Current setup (Nov 2025) : The share price is consolidating within a falling channel. On 4 November 2025, it rebounded from a confluence of supports — including the uptrend line from September 2024 and prior resistance turned support — reinforcing near-term bullish bias.
Trading Idea
Entry Zone: 4.71 - 5.50
Target: 10.50 and 15.00
Support: 4.71
Conclusion
After a long downtrend, HTZ is showing a clear shift in momentum. With multiple bullish patterns confirmed and strong support holding, the stock may be entering a new uptrend phase toward USD 10.50 and USD 15.00.

SILVER BEARS ARE GAINING STRENGTH|SHORT
SILVER SIGNAL
Trade Direction: short
Entry Level: 4,774.1
Target Level: 4,681.8
Stop Loss: 4,835.8
RISK PROFILE
Risk level: medium
Suggested risk: 1%
Timeframe: 1h
Disclosure: I am part of Trade Nation's Influencer program and receive a monthly fee for using their TradingView charts in my analysis.
✅LIKE AND COMMENT MY IDEAS✅

GBP/AUD BUYERS WILL DOMINATE THE MARKET|LONG
GBP/AUD SIGNAL
Trade Direction: long
Entry Level: 2.006
Target Level: 2.031
Stop Loss: 1.989
RISK PROFILE
Risk level: medium
Suggested risk: 1%
Timeframe: 1D
Disclosure: I am part of Trade Nation's Influencer program and receive a monthly fee for using their TradingView charts in my analysis.
✅LIKE AND COMMENT MY IDEAS✅

GBP/CHF BULLISH BIAS RIGHT NOW| LONG
Hello, Friends!
GBP/CHF pair is in the downtrend because previous week’s candle is red, while the price is clearly falling on the 1D timeframe. And after the retest of the support line below I believe we will see a move up towards the target above at 1.075 because the pair oversold due to its proximity to the lower BB band and a bullish correction is likely.
Disclosure: I am part of Trade Nation's Influencer program and receive a monthly fee for using their TradingView charts in my analysis.
✅LIKE AND COMMENT MY IDEAS✅

EUR/CHF BEST PLACE TO SELL FROM|SHORT
Hello, Friends!
EUR/CHF pair is trading in a local uptrend which we know by looking at the previous 1W candle which is green. On the 9H timeframe the pair is going up too. The pair is overbought because the price is close to the upper band of the BB indicator. So we are looking to sell the pair with the upper BB line acting as resistance. The next target is 0.926 area.
Disclosure: I am part of Trade Nation's Influencer program and receive a monthly fee for using their TradingView charts in my analysis.
✅LIKE AND COMMENT MY IDEAS✅

$SPY $SPX Scenarios — Wednesday, Nov 5, 2025🔮 AMEX:SPY SP:SPX Scenarios — Wednesday, Nov 5, 2025 🔮
🌍 Market-Moving Headlines
🚩 First clean data of the week: After delays in earlier reports, Wednesday brings ADP Employment and ISM Services — the first confirmed macro prints to gauge real economic momentum.
📉 Labor tone check: ADP’s private payroll growth of 22,000 vs -32,000 prior suggests continued softness but potential stabilization ahead of Friday’s NFP.
💼 Services resilience: ISM Services expected to tick up slightly to 50.5, hovering near the expansion line — a critical signal for Q4 GDP trajectory.
💬 Market tone: With shutdown-delayed data still missing, traders focus on rate-cut odds, yields, and Treasury auctions for directional cues.
📊 Key Data and Events (ET)
⏰ 8:15 AM — ADP Employment (Oct) | +22,000 vs -32,000 prior 🚩
⏰ 9:45 AM — S&P Final U.S. Services PMI (Oct) | 55.2
⏰ 10:00 AM — ISM Services (Oct) | 50.5 expected, 50.0 prior 🚩
⚠️ Note:
Unlike earlier-week reports, all of Wednesday’s data are confirmed to release on schedule — making this the first meaningful macro catalyst since the FOMC. Expect intraday volatility around 8:15 AM (ADP) and 10:00 AM (ISM).
⚠️ Disclaimer: Educational and informational only — not financial advice.
📌 #trading #stockmarket #SPY #SPX #ADP #ISM #PMI #yields #Fed #inflation #bonds #economy #macro

USOIL BULLS ARE STRONG HERE|LONG
USOIL SIGNAL
Trade Direction: long
Entry Level: 60.06
Target Level: 60.65
Stop Loss: 59.67
RISK PROFILE
Risk level: medium
Suggested risk: 1%
Timeframe: 2h
Disclosure: I am part of Trade Nation's Influencer program and receive a monthly fee for using their TradingView charts in my analysis.
✅LIKE AND COMMENT MY IDEAS✅

EUR/NZD SHORT FROM RESISTANCE
EUR/NZD SIGNAL
Trade Direction: short
Entry Level: 2.031
Target Level: 1.999
Stop Loss: 2.053
RISK PROFILE
Risk level: medium
Suggested risk: 1%
Timeframe: 1D
Disclosure: I am part of Trade Nation's Influencer program and receive a monthly fee for using their TradingView charts in my analysis.
✅LIKE AND COMMENT MY IDEAS✅

EUR/AUD BEARS WILL DOMINATE THE MARKET|SHORT
Hello, Friends!
We are targeting the 1.752 level area with our short trade on EUR/AUD which is based on the fact that the pair is overbought on the BB band scale and is also approaching a resistance line above thus going us a good entry option.
Disclosure: I am part of Trade Nation's Influencer program and receive a monthly fee for using their TradingView charts in my analysis.
✅LIKE AND COMMENT MY IDEAS✅

EUR/CAD SENDS CLEAR BULLISH SIGNALS|LONG
Hello, Friends!
We are now examining the EUR/CAD pair and we can see that the pair is going down locally while also being in a downtrend on the 1W TF. But there is also a powerful signal from the BB lower band being nearby indicating that the pair is oversold so we can go long from the support line below and a target at 1.637 level.
Disclosure: I am part of Trade Nation's Influencer program and receive a monthly fee for using their TradingView charts in my analysis.
✅LIKE AND COMMENT MY IDEAS✅

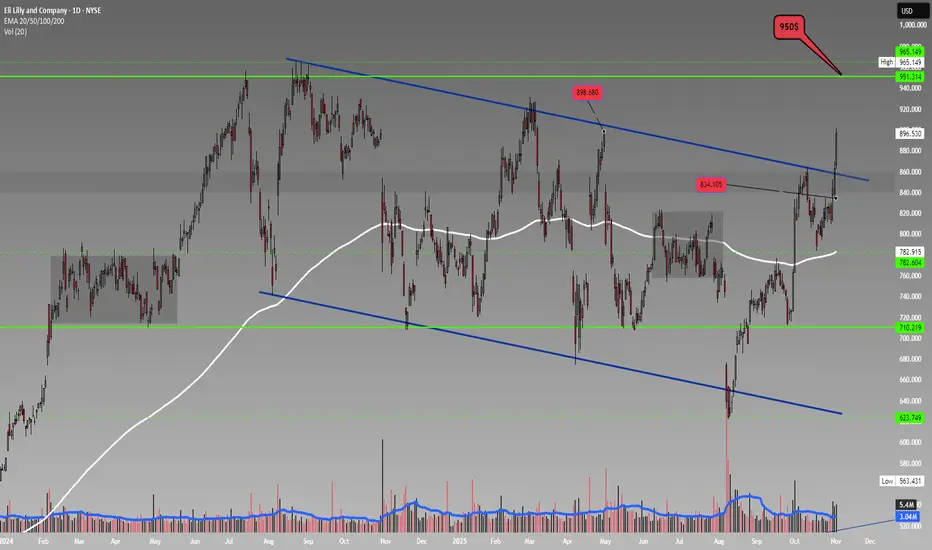
LLY DAILY OUTLOOKLLY has been rising strongly with high volume for the past three days! It closed above its long-term downtrend. Let’s see if it can reach $950.
If you already hold a position, taking some profits could be considered. If it falls below $835, the situation might change.
💬 Remember: Profit looks best in your pocket money that’s not in your pocket isn’t yours yet!
Wishing everyone successful trades and good profits!
GOLD CONFIRMS SHORT-TERM DECLINE AFTER BREAKING TRENDLINEXAUUSD – GOLD CONFIRMS SHORT-TERM DECLINE AFTER BREAKING TRENDLINE
🪞 1. Overview
🌤️ In this morning's Asian session, gold broke the upward trendline even though the selling pressure wasn't particularly strong.
However, this is the first signal indicating the short-term trend is leaning towards the sellers.
💬 Currently, the 3996 zone is a crucial resistance, and the price is likely to retest this area before continuing to decline.
If the price surpasses the FVG at 4007, the trend may temporarily rebound in the short term.
💹 2. Technical Analysis (ICT Perspective)
🔸 Market structure: After breaking the trend, the structure temporarily shifts to short-term bearish.
🔸 Liquidity & FVG: Liquidity is drawn towards the 3960–3940 zone, while FVG 4007 is the first barrier.
🔸 Order Flow: Smart Money might slightly sweep up to the resistance zone before pushing the price further down.
🎯 3. Reference Trading Scenarios
💔 MAIN SELL
Entry: 3996 | SL: 4004
TP: 3985 – 3972 – 3948
💢 SCALPING SELL
Entry: 4007 | SL: 4014
TP: 3998 – 3978
💖 REACTIVE BUY
Entry: 3965 | SL: 3957
TP: 3976 – 3988 – 3999
🌸 DEEP BUY
Entry: 3941 | SL: 3931
TP: 3955 – 3968 – 3988 – 4012 – 4066
🔍 4. Key Price Zones to Watch
✨ 4007 → FVG resistance, short-term trend confirmation zone
✨ 3996 → Zone to retest the broken trendline
✨ 3965 – 3941 → Strong support zone, likely to trigger a reversal reaction
💬 5. Notes & Call to Action
⚠️ This is not an investment recommendation, but merely a personal technical perspective using the ICT method.
Observe the price reaction around the trendline carefully before making a decision 💭
If you find this article helpful, please 💛 like – 💬 leave a comment – 🔔 follow LanaM2
to stay updated with daily gold insights and learn more about the Smart Money Concept 🌷✨

$SHOP: A 4-Year Pattern Breakout Before EarningsWith the AI bubble looking frothy, investors are hunting for the next big rotation. The consumer holiday play looks like the perfect switch, and all eyes are on $SHOP.
This is looking like a clean breakout from a massive 4-year rounding bottom—a pattern this big is a major deal.
The setup couldn't be more critical:
• Catalyst: Earnings are tomorrow (Nov 4) pre-market.
• Sector: AMZN just hit a record high. The e-commerce holiday season is the clear narrative right now.
• History: SHOP has a strong track record of beating revenue estimates for the last two years.
• Momentum: The stock is already up over 60% YTD and the RSI is high, showing strong buying interest.
• High Beta: The stock's beta is over 3.5. This thing is built to move on a catalyst.
You have a long-term technical break, a major sector rotation, and a huge earnings catalyst all hitting at the same time. This is a powerful combination. Watching this one very, very closely today.

XAU/USD – Gold Accumulates Before Breakout, Target 4,096 USD🔍 Market Context
Gold is trading within a symmetrical triangle pattern , reflecting short-term accumulation before forming a new breakout wave.
After a sharp decline from the peak of 4,096 USD, the market has shown two instances of Change of Character (ChoCH) – an early sign indicating the return of buying pressure.
As long as the price holds above the 3,959 – 3,917 USD range, the short-term bullish structure remains intact. This support zone serves as a crucial “discount zone” in the current accumulation cycle.
💎 Key Technical Zones
• Support Zone 1: 3,959 USD → main structure holding area, coinciding with the lower trendline.
• Support Zone 2: 3,917 USD → final liquidity reaction zone.
• Resistance Zone: 4,040 USD → potential break & retest area.
• Liquidity Zone: 4,096 USD → expansion target if the peak is broken.
🎯 Trading Scenarios
1️⃣ BUY Setup – Favoring the bullish structure
• Entry: 3,959 – 3,917 USD
• Stop Loss: 3,905 USD
• Take Profit:
– TP1: 3,985
– TP2: 4,040
– TP3: 4,072
– TP4: 4,096
✳️ “Buy the discount” – prioritize buying orders at the confluence support zone of trendline + FVG to follow the SMC flow.
2️⃣ SELL Scalp – Secondary strategy when price reacts at the peak
• Entry: 4,096 USD
• Stop Loss: 4,108 USD
• Take Profit:
– TP1: 4,072
– TP2: 4,040
– TP3: 3,985
✳️ “Sell the premium” – only activate if there is a strong price rejection signal at the liquidity peak.
💬 Conclusion
The short-term trend of gold remains bullish as the price stays above the trendline and continuously forms higher lows.
The main strategy is buy the dip – sell reaction around the 3,959 → 4,096 USD range.
The confirmation point for a strong bullish trend will be when the price closes steadily above 4,040 USD .
“Smart money accumulates in silence before the market makes noise.”
⏰ Timeframe: 1H
📅 Update: 03/11/2025
✍️ Analysis by: Captain Vincent

GBPAUD: Short Trade with Entry/SL/TP
GBPAUD
- Classic bearish formation
- Our team expects pullback
SUGGESTED TRADE:
Swing Trade
Short GBPAUD
Entry - 2.0084
Sl - 2.0096
Tp - 2.0060
Our Risk - 1%
Start protection of your profits from lower levels
Disclosure: I am part of Trade Nation's Influencer program and receive a monthly fee for using their TradingView charts in my analysis.
❤️ Please, support our work with like & comment! ❤️
