US30 SENDS CLEAR BULLISH SIGNALS|LONG
US30 SIGNAL
Trade Direction: long
Entry Level: 45,553.8
Target Level: 46,661.5
Stop Loss: 44,818.8
RISK PROFILE
Risk level: medium
Suggested risk: 1%
Timeframe: 1D
Disclosure: I am part of Trade Nation's Influencer program and receive a monthly fee for using their TradingView charts in my analysis.
✅LIKE AND COMMENT MY IDEAS✅
Techincalanalysis

GBP/CAD BEARS ARE GAINING STRENGTH|SHORT
Hello, Friends!
The BB upper band is nearby so GBP-CAD is in the overbought territory. Thus, despite the uptrend on the 1W timeframe I think that we will see a bearish reaction from the resistance line above and a move down towards the target at around 1.864.
Disclosure: I am part of Trade Nation's Influencer program and receive a monthly fee for using their TradingView charts in my analysis.
✅LIKE AND COMMENT MY IDEAS✅

LiamTrading – XAUUSD: Bullish Structure BROKENLiamTrading – XAUUSD: Bullish Structure BROKEN, Preparing for a STRONG DOWNTREND?
Hello trader,
The Gold market has undergone a significant Market Structure Shift, breaking the previously sustainable uptrend. After the key support area around 4000 was breached with high volume, the Bears have taken control in the short term.
Currently, the price is experiencing a slight correction after a sharp drop, but overall, it is forming Lower High – Lower Low patterns on the H1 timeframe, confirming the bearish move.
📊 Technical Analysis (Chart 1H – XAUUSD)
The recent sharp decline has broken the bullish structure (Break of Structure - BOS), while also creating important inefficiency/imbalances that need to be filled:
Liquidity Focus Area (Resistance): $4050 – $4060. This is the resistance peak to watch.
Sell Liquidity Zone (FVG Sell Zone): $4030 – $4040. This is the ideal Fair Value Gap for Bears to re-enter.
Key Support/Buy Scalping Zone: $3925 – $3935 (Confluence area of Fibonacci Extension 2.272).
Swing Buy/Accumulation Zone: $3905 – $3915 (Confluence area of Fibonacci Extension 2.618).
🎯 Main Trading Scenario (Short-term BEARISH)
Sell entry 4000 – 4002
SL 4008
TP 3986 – 3965 3950 – 3923
Sell Entry 4028 – 4031 (FVG )
SL 4036
TP 4022 – 4010 4000 – 3960
Buy Scalping
3926 – 3928
SL 3921
TP 3939 – 3955 3970 – 3990
Buy Bottom Zone 3900 – 3908
SL 3895
TP 3922 – 3945 3970 – 3988
Export to Spreadsheet
🧭 Fundamental Insight & Market Sentiment
The bearish momentum is being driven by the following factors:
Monetary Policy: Fed official Williams' statements supporting continued rate cuts seem to be reducing Gold's safe-haven demand. Although rate cuts typically support Gold in the long term (due to "cheap money"), the slowing labor market is a short-term negative signal.
CPI News: The Bureau of Labor Statistics recalling staff to compile the CPI report amid a government shutdown highlights the importance of this data. If the CPI is not as expected, it could cause significant volatility.
Market Sentiment: After the bullish structure was broken, technical selling sentiment may prevail, especially if the price cannot quickly recover to the 4000 level.
📌 Conclusion & Recommendations
Gold has confirmed a short-term structural shift to bearish. While the long-term trend is not clearly defined, the current priority is to seek Sell opportunities when the price retraces to key resistance and FVG areas (such as $4000 and $4030).
Advice: Always adhere to SL (Stop Loss) and prioritize risk reduction when the market signals a reversal. DO NOT BUY when the bearish structure is dominant.
👉 Follow me for detailed updates and the latest trading plans in the session!

My view on wheat futureHello,
According to my technical analysis on the Wheat futures 4H timeframe, there is potential for a decline toward 500 in the next few hours.

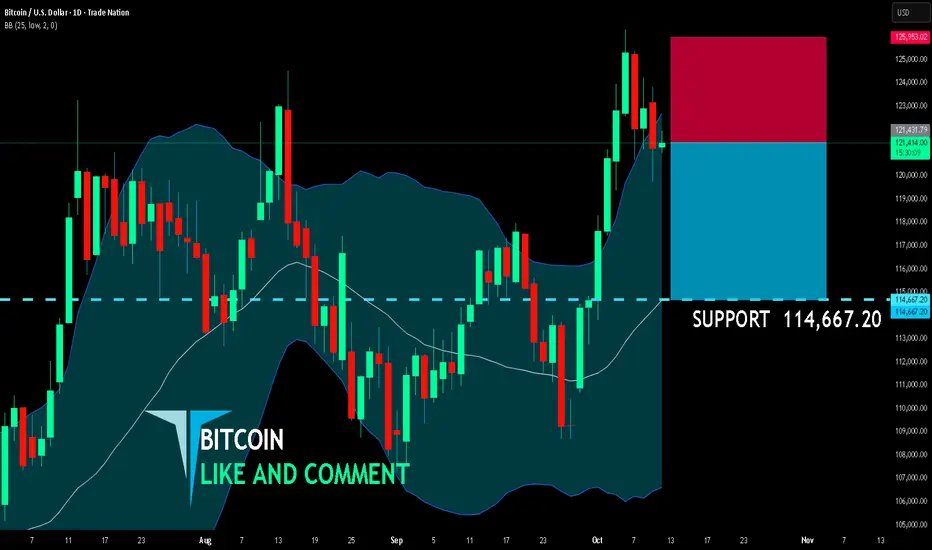
BITCOIN SENDS CLEAR BEARISH SIGNALS|SHORT
BITCOIN SIGNAL
Trade Direction: short
Entry Level: 121,431.79
Target Level: 114,667.20
Stop Loss: 125,953.02
RISK PROFILE
Risk level: medium
Suggested risk: 1%
Timeframe: 1D
Disclosure: I am part of Trade Nation's Influencer program and receive a monthly fee for using their TradingView charts in my analysis.
✅LIKE AND COMMENT MY IDEAS✅
BTCUSD Long Setup – Target 135,295 | Stop Below 120,000Description:
Bitcoin (BTCUSD) has maintained strong bullish momentum after breaking multiple structure levels (BOS) on the 4H timeframe. The price recently completed a corrective phase and is now showing signs of continuation.
I’m positioning long as long as BTC holds above the $120,000 support zone.
If the price falls below this key level, it will invalidate the bullish structure and I will exit the trade.
Trade Plan:
Entry: Current market price (~$121,500)
Take Profit 1: $124,664
Final Target: $135,295
Stop Loss: Below $120,000
Trend Bias: Bullish continuation
Timeframe: 4H
Technical Notes:
Clear BOS (Break of Structure) confirms bullish control.
Price retraced into previous demand and rejected strongly.
Above $124.6K, momentum could accelerate toward the next liquidity zone near $135K.
Conclusion:
BTC remains bullish above $120K.
First take-profit at $124,664 to secure partial gains,
and hold the rest toward the main target at $135,295 for potential trend extension.
BITSTAMP:BTCUSD

XAGUSD Long Setup – Target 55, Manage Risk Below 48Description:
Silver (XAGUSD) has shown strong bullish momentum, breaking multiple structure levels (BOS) and confirming a clear uptrend. The current price action suggests potential continuation toward the next resistance levels around $53.8 – $57.1, with a final target at $55.
However, if price retraces and closes below $48, it may signal exhaustion or a potential reversal, making that an appropriate exit or stop-loss level.
Trade Plan:
Entry: Current market price (~$50.6)
Take Profit: $55
Stop Loss / Exit if hit: $48
Risk–Reward Ratio: ~1.7:1
Trend Bias: Strong Bullish
Timeframe: 1D
Technical Notes:
Price has broken multiple structures and maintained higher highs and higher lows.
Momentum remains strong after BOS near $47.36.
Watch for consolidation near $51–$52 as short-term resistance.
Conclusion:
As long as silver holds above $48, the bullish structure remains intact. A push toward $55 aligns with current market momentum and Fibonacci extension targets.
OANDA:XAGUSD

GJ 2H, TRADE IDEA OCT, 9TH 2025.The current overall Trend is strongly bullish as the pound paired Japanese currency has been pushing for days now, but for now has a pause in other to drop some steam i see, so i expect price to reverse from the marked out points of perspective if not then we would reconsider a continuation to the above external extremes, so price is still bullish but on a retracement because there's a huge gap let below before it made a move up previously so if price drops further in the NY Open then that would confirm a reversal downwards.

Gold Awaits Powell's Speech: Sell $4052 or Buy $3977?Hello TradingView community!
The Gold market is entering a pivotal phase. After an impressive rally, prices are pausing at a critical resistance zone, and the market sentiment is holding its breath for tonight's main event: the speech by Federal Reserve Chairman Jerome Powell.
This is a moment where a few words can determine the direction of an entire trend. Let's outline a detailed action plan.
1. Macro Context: Jerome Powell in Focus
"Aftershocks" from the FOMC Minutes: The market is still "digesting" the FOMC meeting minutes released yesterday. The minutes revealed a somewhat more "hawkish" tone than expected, as many members remain concerned about inflation. This is putting slight pressure on Gold prices.
Main Event: Fed Chair Powell Speaks.
This is when all eyes are on him. Traders will scrutinize every word of Powell's for clues about the future interest rate path.
If Powell maintains a hawkish tone, emphasizing that the fight against inflation is not over, the USD will strengthen, and Gold may undergo a deep correction.
Conversely, if he makes "dovish" remarks, expressing concerns about economic growth, it will be a "green light" for Gold to break out.
2. Technical Analysis: Action Plan
Our chart clearly outlines the key "battle lines":
Main Resistance Zone (Bearish OB - Zone):
This is the "stronghold" of the Bears, where profit-taking and short-selling pressures are concentrated. With a somewhat hawkish macro backdrop, this is a very strong resistance zone. The scenario forecasted on the chart shows prices may rebound to this area and be rejected. This is a critical area to watch for sell signals.
Primary Buy Zone (Bullish OB - Buy Zone):
This is the safest and most ideal "stronghold" for the Bulls. It is the order block that created the previous strong upward wave. A perfect scenario is Powell's speech driving prices to adjust to this zone, creating a good buying opportunity to follow the main trend.
Breakout Target (Liquidity):
If Powell unexpectedly turns "dovish," Gold could break through the $4,052 resistance zone and head straight for the liquidity target at the previous peak.
Trading Strategy
Before the speech (19:30): The market may be unpredictable. It's best to stay on the sidelines to avoid price "sweeps."
Preferred strategy: Based on the adjustment scenario drawn on the chart, patiently waiting for a buying opportunity at a strong support zone will be safer.
Specific plan:
Sellers (Risky): Look for clear reversal signals at the $4,052 zone during or after the speech.
Buyers (Safe): Wait for a price push down to the $3,977 zone and look for confirmation signals to buy.
WHAT'S YOUR PLAN?
Do you predict Chairman Powell will be "hawkish" or "dovish" tonight? And is your plan to Sell $4,052 or wait to Buy $3,977?
👇 Share your thoughts in the comments and don't forget to Like 👍 and Follow the channel!

GOLD BEST PLACE TO SELL FROM|SHORT
GOLD SIGNAL
Trade Direction: short
Entry Level: 4,035.38
Target Level: 3,914.49
Stop Loss: 4,115.72
RISK PROFILE
Risk level: medium
Suggested risk: 1%
Timeframe: 6h
Disclosure: I am part of Trade Nation's Influencer program and receive a monthly fee for using their TradingView charts in my analysis.
✅LIKE AND COMMENT MY IDEAS✅

EUR/CAD LONG FROM SUPPORT
Hello, Friends!
EUR/CAD pair is trading in a local uptrend which know by looking at the previous 1W candle which is green. On the 9H timeframe the pair is going down. The pair is oversold because the price is close to the lower band of the BB indicator. So we are looking to buy the pair with the lower BB line acting as support. The next target is 1.629 area.
Disclosure: I am part of Trade Nation's Influencer program and receive a monthly fee for using their TradingView charts in my analysis.
✅LIKE AND COMMENT MY IDEAS✅

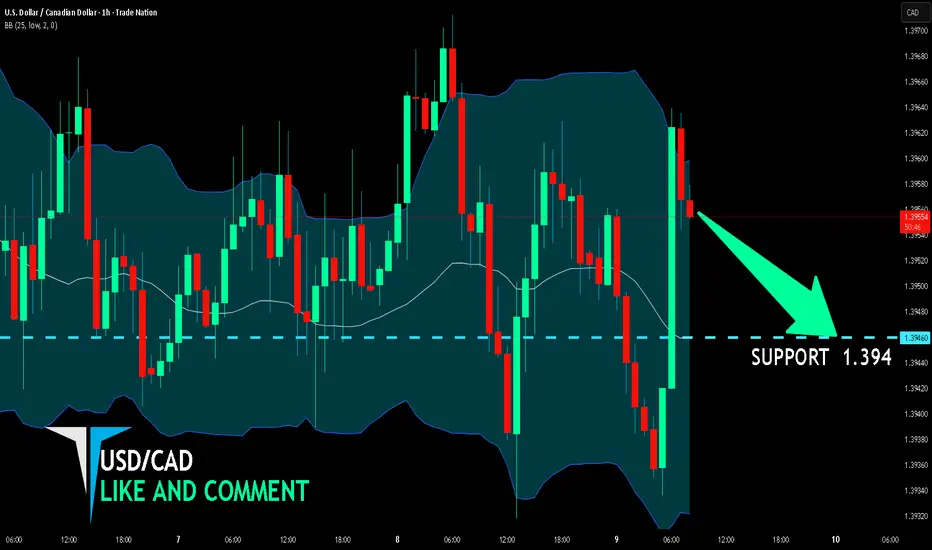
USD/CAD BEARS WILL DOMINATE THE MARKET|SHORT
Hello, Friends!
We are going short on the USD/CAD with the target of 1.394 level, because the pair is overbought and will soon hit the resistance line above. We deduced the overbought condition from the price being near to the upper BB band. However, we should use low risk here because the 1W TF is green and gives us a counter-signal.
Disclosure: I am part of Trade Nation's Influencer program and receive a monthly fee for using their TradingView charts in my analysis.
✅LIKE AND COMMENT MY IDEAS✅
GBP/AUD BEARS ARE STRONG HERE|SHORT
Hello, Friends!
We are going short on the GBP/AUD with the target of 2.029 level, because the pair is overbought and will soon hit the resistance line above. We deduced the overbought condition from the price being near to the upper BB band. However, we should use low risk here because the 1W TF is green and gives us a counter-signal.
Disclosure: I am part of Trade Nation's Influencer program and receive a monthly fee for using their TradingView charts in my analysis.
✅LIKE AND COMMENT MY IDEAS✅

GBP/NZD BULLISH BIAS RIGHT NOW| LONG
Hello, Friends!
GBP/NZD pair is trading in a local downtrend which we know by looking at the previous 1W candle which is red. On the 6H timeframe the pair is going down too. The pair is oversold because the price is close to the lower band of the BB indicator. So we are looking to buy the pair with the lower BB line acting as support. The next target is 2.323 area.
Disclosure: I am part of Trade Nation's Influencer program and receive a monthly fee for using their TradingView charts in my analysis.
✅LIKE AND COMMENT MY IDEAS✅

GBP/CAD SELLERS WILL DOMINATE THE MARKET|SHORT
Hello, Friends!
GBP/CAD pair is in the uptrend because previous week’s candle is green, while the price is obviously rising on the 12H timeframe. And after the retest of the resistance line above I believe we will see a move down towards the target below at 1.867 because the pair overbought due to its proximity to the upper BB band and a bearish correction is likely.
Disclosure: I am part of Trade Nation's Influencer program and receive a monthly fee for using their TradingView charts in my analysis.
✅LIKE AND COMMENT MY IDEAS✅

XAU/USD Intraday Plan | Support & Resistance to WatchYesterday, we noted that gold was extended and due for a retracement.
Price failed to hold above 4046 and sharply pulled back, testing the upper edge of the First Reaction Zone, which also aligns with the MA50, now acting as dynamic support.
For bullish momentum to continue toward 4064 and 4080, price needs to reclaim and hold above 4046.
Failure to do so could trigger another retest of the reaction zone and potentially a deeper pullback toward the lower support levels before buyers step back in.
📌 Key levels to watch:
Resistance:
4046
4064
4080
Support:
4020
4000
3970
3937
3909
🔎Fundamental Focus | October 9, 2025
Today’s spotlight is on Fed Chair Powell’s speech, which is expected to set the tone for the day. Markets will be watching closely for any hints on rate-cut timing or comments addressing economic risks amid the ongoing U.S. government shutdown.
Additional Fed officials — Bowman and Barr — are also scheduled to speak throughout the day, which could add layers of volatility if their remarks differ in tone from Powell’s.
With U.S. data releases still limited by the shutdown, today’s Fed communications will be the key market driver.

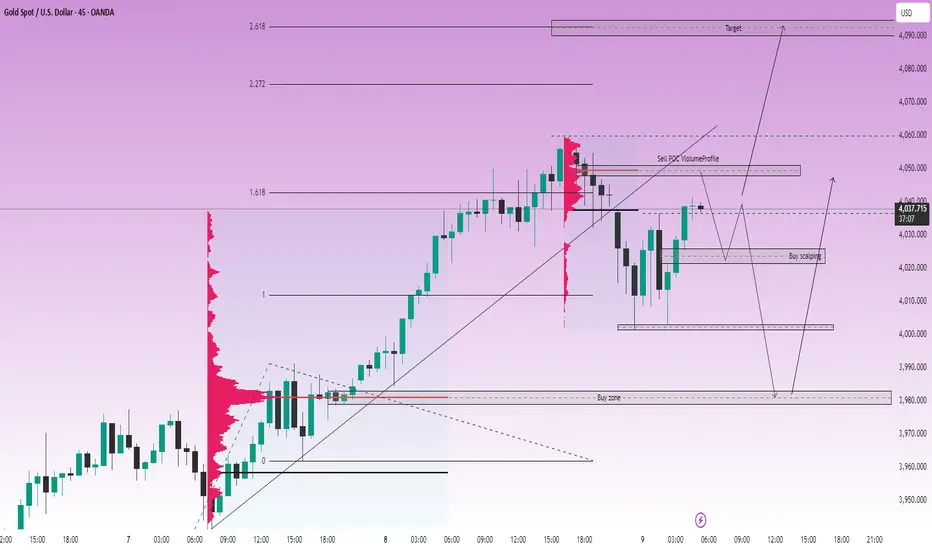
GOLD: The upward structure continues, target 4090 is approachingLiamTrading – GOLD: The upward structure continues, target 4090 is approaching
Hello everyone,
Gold and US stocks are setting new records, but don't forget — strong sell-offs often occur when everyone believes prices can only go up.
Currently, gold maintains a sustainable upward structure, with each subsequent low higher than the previous one, confirming a clear trend on the H1–H4 frames.
📊 Technical Analysis (Chart 45m – XAUUSD)
The price structure remains clearly Higher High – Higher Low, indicating that buyers still control the market.
Key liquidity zones are around:
🔹 4050–4060 (resistance – POC Volume Profile)
🔹 4020–4025 (temporary support zone – confluence Fibo 0.618)
🔹 3980 (technical bottom, strong previous liquidity zone)
The upward target according to Fibonacci Extension is currently in the 4090 zone, corresponding to the 2.618 extension level — likely to become a major profit-taking area for buyers.
🎯 Today's Trading Scenario
Short-term Sell (based on resistance reaction):
📍 4048–4050
🛑 SL: 4055
🎯 TP: 4030 – 4018 – 4005 – 3980
Buy scalping:
📍 4022–4024
🛑 SL: 4017
🎯 TP: 4030 – 4045 – 4060 – 4080
Buy swing (trend-following):
📍 3980–3982
🛑 SL: 3975
🎯 TP: 3995 – 4010 – 4025 – 4040 – 4060
🧭 Fundamental & Market Sentiment
According to the FOMC minutes from 16–17/9, most Fed officials believe that continuing to cut interest rates this year is appropriate.
This is the first time since 2020 that the Fed has officially reduced the interest rate by 0.25%, bringing the range down to 4.75% – 5.00%.
→ Cheap money + safe haven sentiment continues to be the main driver pushing gold higher.
However, with both gold and stocks reaching peaks, the risk of technical correction may occur when prices hit major liquidity zones.
📌 Conclusion
Gold is still in a stable upward trend, with a short-term target towards 4090 USD/oz.
However, watch for liquidity zones around 4050–4060 and 4000–4025 to optimize entry points, avoiding FOMO when prices are already high.
👉 I will continue to update details each trading session.
Follow me to not miss the earliest gold scenarios!
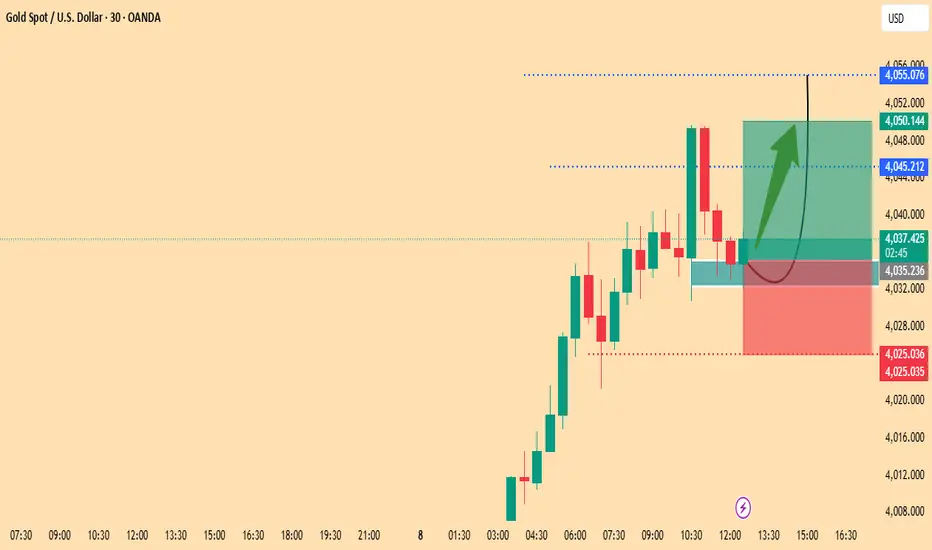
Gold Retesting Support – Bullish Continuation ExpectedGold (XAU/USD) is showing strong bullish momentum after a brief consolidation around the support zone. Price is currently retesting the breakout level, indicating potential continuation toward the upper resistance area. The bullish engulfing candles and higher lows suggest sustained buying interest, favoring long positions above the support level.
INFY Turning Bullish: IT Giant Ready for the Next Leg UpINFOSYS — 1 Hour Timeframe Analysis
INFY is showing strong momentum after respecting its support zone around 1400–1420. The stock has rebounded well and is now approaching its resistance zone near 1580–1590.
The Supertrend indicator is displaying a positive bias, while the MACD has confirmed a bullish crossover in the positive zone, further validating the ongoing strength in momentum.
Any buy-on-dip opportunity near the Supertrend support around 1450–1460 could offer another round of bullish momentum. The stock is currently maintaining a Higher Low – Higher High (HL–HH) structure, indicating a healthy uptrend continuation.
If the support zone holds firmly, we may witness higher prices in INFY in the coming sessions.
Thank You !!

USOIL SENDS CLEAR BEARISH SIGNALS|SHORT
USOIL SIGNAL
Trade Direction: short
Entry Level: 62.52
Target Level: 60.15
Stop Loss: 64.10
RISK PROFILE
Risk level: medium
Suggested risk: 1%
Timeframe: 7h
Disclosure: I am part of Trade Nation's Influencer program and receive a monthly fee for using their TradingView charts in my analysis.
✅LIKE AND COMMENT MY IDEAS✅

NZD/USD BULLS ARE GAINING STRENGTH|LONG
NZD/USD SIGNAL
Trade Direction: long
Entry Level: 0.576
Target Level: 0.584
Stop Loss: 0.571
RISK PROFILE
Risk level: medium
Suggested risk: 1%
Timeframe: 9h
Disclosure: I am part of Trade Nation's Influencer program and receive a monthly fee for using their TradingView charts in my analysis.
✅LIKE AND COMMENT MY IDEAS✅

EUR/USD BUYERS WILL DOMINATE THE MARKET|LONG
Hello, Friends!
We are now examining the EUR/USD pair and we can see that the pair is going down locally while also being in a downtrend on the 1W TF. But there is also a powerful signal from the BB lower band being nearby indicating that the pair is oversold so we can go long from the support line below and a target at 1.168 level.
Disclosure: I am part of Trade Nation's Influencer program and receive a monthly fee for using their TradingView charts in my analysis.
✅LIKE AND COMMENT MY IDEAS✅

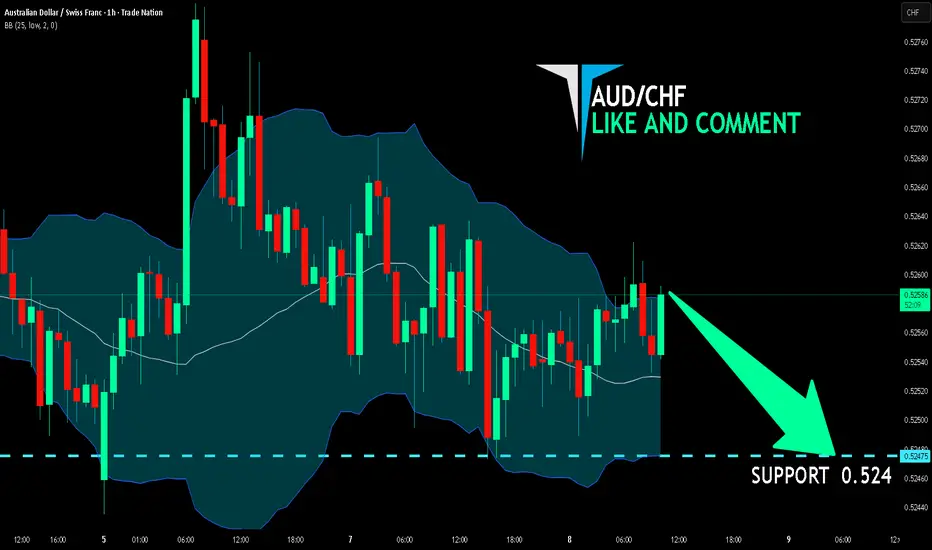
AUD/CHF BEARISH BIAS RIGHT NOW| SHORT
Hello, Friends!
It makes sense for us to go short on AUD/CHF right now from the resistance line above with the target of 0.524 because of the confluence of the two strong factors which are the general downtrend on the previous 1W candle and the overbought situation on the lower TF determined by it’s proximity to the upper BB band.
Disclosure: I am part of Trade Nation's Influencer program and receive a monthly fee for using their TradingView charts in my analysis.
✅LIKE AND COMMENT MY IDEAS✅