LiamTrading – Mid-term Gold Outlook H4Let's prepare the scenario for the new week, everyone!
In my opinion, gold next week might start to show a mid-term correction phase. However, it is important to note that nothing is absolutely certain on a larger time frame. If you're trading short-term within the day, closely follow price action to ensure higher accuracy.
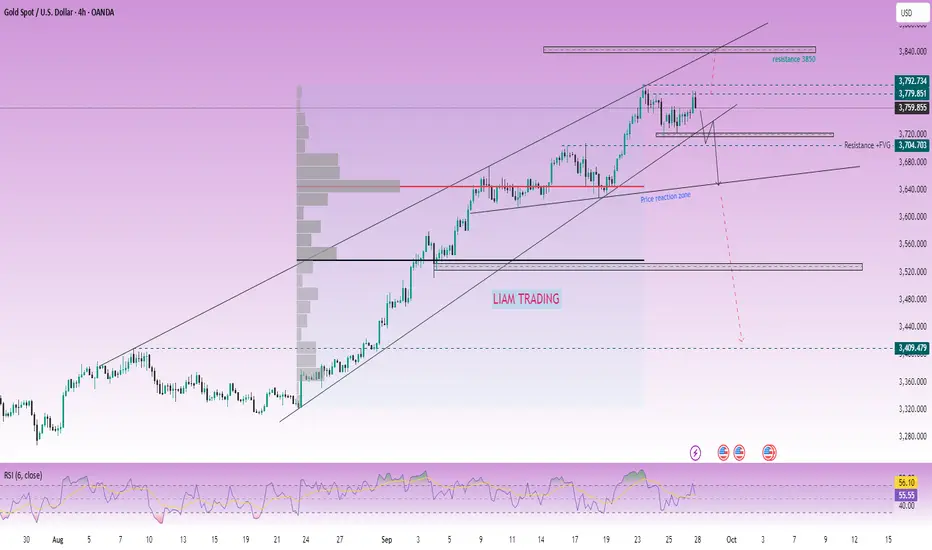
Gold closed the weekly candle at 3759.85 – a price point clearly reflecting hesitation. The end-of-week session showed resistance to price increases, mainly due to profit-taking pressure, so it's too early to confirm that a downtrend will begin.
The upward price channel is strong, so it's still necessary to think in line with the market's upward trend to ensure the mindset of holding profits remains firm.
The upward structure is still stable, but the RSI has indicated a weakening in buying sentiment. To confirm a mid-term correction, gold needs to break 3720. At that point, a reasonable strategy would be to wait to sell around 3737–3740 (retracing to the trendline), with the target being the support area coinciding with the highest volume profile cluster at 3645.
Conversely, the buying scenario will occur when:
- Price touches the 3735 boundary and shows a candle rejection reaction.
- Or gold breaks above the minor resistance at 3780, then you can buy immediately, with the expectation of heading towards the 3850 area.
Next week, be patient and wait for market confirmation to increase the probability of winning. I will continue to share detailed scenarios in each trading session for everyone to stay updated.
Techincalanalysis
XAUUSD – New Week Scenario on D1 FrameXAUUSD – New Week Scenario on D1 Frame: Prioritize buying, the 3790 – 3720 zone determines the trend
Hello Trader,
Trading is a journey, and the most important destination is conquering oneself.
On the D1 frame, gold has experienced a series of consecutive strong increases, indicating that the buyers still maintain the advantage. The buying force shows no clear signs of weakening, even though gold has just slightly reacted downward around 3790. Currently, the price is consolidating around 3760 – the closing zone of this week's candle.
Fundamental View
Political pressure from President Trump on the Fed is increasing, as the market expects easing measures soon. However, Chairman Powell remains cautious, prioritizing price stability over inflation concerns.
This factor may continue to keep gold as a key safe-haven asset, especially amid policy uncertainty.
Technical View
The 3790 – 3720 price zone will play a decisive role in the medium-term trend next week.
If 3790 is broken, gold will have the opportunity to advance to the Fibonacci Extension zone of 3822. Further, strong resistance lies around 3840 – 3860.
If 3720 is breached, selling pressure will retest the strategic support zone at 3650. This is also the confluence area with the rising trendline on D1.
MACD Indicator: continues to support the buyers, the histogram remains positive, not giving a clear signal of decline.
Volume: no significant selling pressure has appeared, indicating that gold is entering an accumulation phase, awaiting a breakout.
Trading Scenario for Next Week
Buying Scenario (priority):
Buy around 3650 – 3660 (if there is a correction).
SL: below 3640.
TP: 3720 – 3790 – 3822.
Selling Scenario at Resistance:
Sell around 3822 – 3830 (Fibo + strong resistance).
SL: above 3840.
TP: 3790 – 3760 – 3720.
Conclusion
In the medium term, the upward trend still prevails. Next week, gold will revolve around the 3790 – 3720 mark, and reactions here will pave the way for the next trend. The priority strategy is to buy at the 3650 support zone, while observing reactions at 3822 to consider short-term sell orders.
Short-term scenarios will be updated during the day, helping you be more proactive with market fluctuations.
Follow me and the community to update the earliest scenarios.

BTC TREND CHANNEL - BITCOIN TRENDING UPTRENDBitcoin is in a new uptrend on the lower time frames. There is a high chance BTC will target between $112K and $113K in the short term. From there, we could see the daily trend of Bitcoin develop further.
Follow this channel for daily BTC updates
Thank you

GBP/NZD SENDS CLEAR BEARISH SIGNALS|SHORT
Hello, Friends!
We are targeting the 0.978 level area with our short trade on GBP/NZD which is based on the fact that the pair is overbought on the BB band scale and is also approaching a resistance line above thus going us a good entry option.
Disclosure: I am part of Trade Nation's Influencer program and receive a monthly fee for using their TradingView charts in my analysis.
✅LIKE AND COMMENT MY IDEAS✅

BTCUSD – Short-term Downward Channel.....BTCUSD – Short-term Downward Channel, Accumulation Before a Potential Rally
Good day traders,
On the H4 timeframe, BTC is moving within a short-term descending channel. After testing a strong support level, selling pressure has started to ease. That said, the 107.4k zone has yet to be retested, and it is quite likely the price will revisit this level once again.
Technical Outlook
Over the past week, BTC has traded in a highly technical manner – with clear ranges, precise reversal points, and a sustained channel structure.
Key Support: around 107.4k, coinciding with the Long Entry Zone.
Short-term Resistance: 110k – 111k, an area where price has frequently reacted during recovery moves.
Fundamental Perspective
From a fundamental standpoint, there are currently few factors pointing to a deeper decline in BTC. Furthermore, historical patterns suggest that October is often a month where BTC and the wider crypto market tend to recover. This underpins the likelihood of a strong rebound once support has been fully tested.
Trading Scenarios
Short towards support
Entry: 110.3k
SL: 110.8k
TP: 109k – 107.6k
Long at strong support
Entry: 107.4k
SL: 106.8k
TP:Strong reaction: hold the trade, adjust SL to breakeven, and aim for higher levels in line with the broader uptrend.
Weak reaction: close around 109k for a short-term gain.
Conclusion
Short-term: preference is to look for short opportunities near 110.3k, targeting a move back towards support.
Medium-term: watch for long entries around 107.4k, with the expectation that BTC could resume an upward phase into October.
Risk Management
Adhering to stop-losses is essential, particularly for longs at support, as this is the pivotal level that may determine BTC’s next direction.
This represents my personal outlook on BTC heading into the weekend. Please take it as a reference and adapt it to your own strategy.
👉 Follow me to share scenarios and receive the quickest updates when price structure shifts.

DB Corp | Crucial Price Action Zone AheadDB Corp | Technical Outlook
On the daily timeframe, DB Corp is currently trading rangebound within a well-defined consolidation zone, with a strong support zone at 250–260.
The stock is respecting the 0.382 Fibonacci retracement level, with a critical support level placed at 254.
If this level holds, we may see a potential upside move towards 287.
However, if the support at 254 breaks, the next major support lies around 170–180.
Conclusion: Price action around the 254 level will be crucial for the next directional move.
Thank You !!

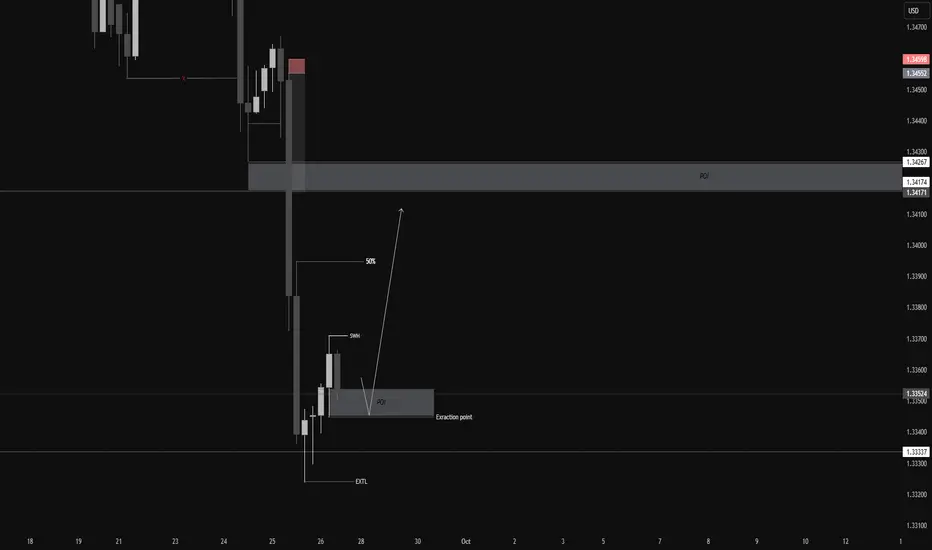
4H TRADE IDEA FOR 26 SEP, 2025Following the new information and increased volume that entered the market yesterday, the price generated a significant downward momentum, indicating an overall downtrend. Currently, the price is on a retracement based on my framework, moving back into a probable balance area. we expect the price to retrace a lot more back up towards the 50 - 70% level through today and until the beginning of next trading week before resuming the overall downtrend continuation. As usual, my calls or analysis are based on what we see, the current Bias, and from a probability standpoint, meaning that this projection may be or may not be validated, so tread carefully, and as usual, this is not financial advice, trade responsibly
ANFIBO | XAUUSD - The week's last day, I'm bullish over $3800Hi guys, Anfibo's here!
OANDA:XAUUSD Analysis – Daily Trading Strategy
Overall Picture:
At present, gold (XAUUSD) continues to hold steadily within the H4 bullish channel, without any unusual volatility. The dominant uptrend remains intact, and the market structure still favors buyers. Personally, I remain optimistic that gold will soon head toward a new ATH above $3,800/oz in the medium term. However, in the short term, the market may continue to fluctuate around key support and resistance levels before confirming its next move.
Technical Outlook:
Short-term trend: Solidly bullish, though momentum is slowing; accumulation may form before the next breakout.
> SUPPORT KEY / BUY ZONES : 3740 - 3723 - 3713 - 3703
> RESISTANCE KEY / SELL ZONES : 3770 - 3777- 3788 - 3799 - 3836
Here's my Trading Plan today:
>>> SELL ZONE:
ENTRY: 3769 - 3775
SL: 3780
TP: 3740 - 3723
>>> BUY ZONE:
ENTRY: 3700 - 3705
SL: 3695
TP: 3760 - 3800 - 3836
Risk Management:
- Prioritize buy trades in line with the dominant trend, limit countertrend shorts.
- Maintain a R:R ratio of at least 1:2 on all setups.
- Manage capital strictly, avoid overtrading during sideways phases before breakout.
✅ Conclusion:
Gold is maintaining a stable uptrend on H4, with market structure still supporting buyers.
Main scenarios: Buy on dip around 3700 – 3705.
A clear move beyond 3780 would likely pave the way toward a new ATH above $3,800.
HAVE A NICE WEEKEND, GUYS!!!

GBP/CHF BULLISH BIAS RIGHT NOW| LONG
GBP/CHF SIGNAL
Trade Direction: long
Entry Level: 1.067
Target Level: 1.075
Stop Loss: 1.062
RISK PROFILE
Risk level: medium
Suggested risk: 1%
Timeframe: 1D
Disclosure: I am part of Trade Nation's Influencer program and receive a monthly fee for using their TradingView charts in my analysis.
✅LIKE AND COMMENT MY IDEAS✅

EUR/NZD BEST PLACE TO SELL FROM|SHORT
Hello, Friends!
It makes sense for us to go short on EUR/NZD right now from the resistance line above with the target of 1.988 because of the confluence of the two strong factors which are the general downtrend on the previous 1W candle and the overbought situation on the lower TF determined by it’s proximity to the upper BB band.
Disclosure: I am part of Trade Nation's Influencer program and receive a monthly fee for using their TradingView charts in my analysis.
✅LIKE AND COMMENT MY IDEAS✅

EUR/CAD BEARS WILL DOMINATE THE MARKET|SHORT
EUR/CAD SIGNAL
Trade Direction: short
Entry Level: 1.632
Target Level: 1.625
Stop Loss: 1.636
RISK PROFILE
Risk level: medium
Suggested risk: 1%
Timeframe: 9h
Disclosure: I am part of Trade Nation's Influencer program and receive a monthly fee for using their TradingView charts in my analysis.
✅LIKE AND COMMENT MY IDEAS✅

EUR/USD SENDS CLEAR BEARISH SIGNALS|SHORT
Hello, Friends!
We are now examining the EUR/USD pair and we can see that the pair is going up locally while also being in a uptrend on the 1W TF. But there is also a powerful signal from the BB upper band being nearby, indicating that the pair is overbought so we can go short from the resistance line above and a target at 1.173 level.
Disclosure: I am part of Trade Nation's Influencer program and receive a monthly fee for using their TradingView charts in my analysis.
✅LIKE AND COMMENT MY IDEAS✅

XAU/USD Intraday Plan | Support & Resistance to WatchGold is trading around $3,743, consolidating inside the First Reaction Zone after failing to hold above the $3,753 resistance. The 50MA is also acting as resistance. Price remains range-bound within this zone, with multiple tests of both the $3,753 and $3,728 levels.
A clean breakout and hold above $3,753 would open the path toward $3,768 and $3,782. Failure to clear $3,753/50MA risks further downside into $3,728, with extended weakness toward $3,712–$3,690 (200MA support).
📌 Key Levels to Watch
Resistance:
$3,753
$3,768
$3,782
Support:
$3,728
$3,712
$3,690
$3,665
🔎 Fundamental Focus – Fri, Sep 26
The spotlight is on Core PCE (2:30pm), the Fed’s key inflation measure, followed by UoM Consumer Sentiment (4:00pm).
👉 Expect volatility — strong prints may pressure gold lower, while weaker data could provide support.

LiamTrading – Gold might fake a move before dropping
Gold is trading around the 375x zone and may exhibit a “fake breakout” to higher levels before adjusting downward. The price structure on the H4 chart shows:
Strong resistance is located at the 3770–3773 zone, coinciding with the 0.786 – 1.0 Fibonacci extension area. This is a confluence zone where a bearish reaction is likely.
The main trendline remains upward, but the RSI is gradually weakening, warning that buying pressure is not as strong.
Short-term support lies at 3710–3713, also the 0.5 – 0.618 fibo zone, suitable for buy scalping orders.
Larger support is at 3688–3691, where it converges with the trendline bottom and key Fibonacci levels, considered a sustainable “buy zone.”
Trading plan reference
Sell: 3770 – 3773, SL 3778, TP 3756 – 3743 – 3725 – 3710
Buy scalping: 3710 – 3713, SL 3705, TP 3725 – 3736 – 3748 – 3760
Buy zone: 3688 – 3691, SL 3684, TP 3699 – 3710 – 3725 – 3736 – 3745 – 3760
In summary, gold may create a fake upward move to the 3770–3773 resistance zone before reversing for a correction. Traders should patiently wait for confirmation signals at key price zones to optimize entries and manage risks tightly.
This is my personal view on XAUUSD. If you find it useful, follow for the fastest updates on upcoming scenarios, continuously updated in the community.

Gold under EMA pressure Buy at support,short scalp at resistance🟡 XAU/USD – Captain Vincent ⚓
🔎 Captain’s Log – Context & News
FED : Probability of a 25bps cut in October is 91.09% → almost certain.
US Calendar today : GDP, Jobless Claims, Durable Goods Orders, and especially speeches from 3 FED officials → strong volatility expected.
Gold yesterday : Dropped deeply but reacted precisely at key support → according to Vincent, this sell-off was mainly due to investors being cautious ahead of tomorrow’s CPI data.
⏩ Captain’s Summary : Short-term waves are pressured by EMAs, but the bigger voyage remains bullish – sailors prioritize Buy at Golden Harbor, only Quick Boarding 🚤 when facing Storm Breaker.
📈 Captain’s Chart – Technical Analysis (H30, EMA 34 & EMA 89)
EMA : EMA 34 (yellow) crossing below EMA 89 (red) → short-term bearish signal.
Trend : Overall still bullish, with Bullish OBs and Buy Zones below acting as strong supports.
Storm Breaker (Resistance / Sell Zone)
3,769 – 3,777 (Bearish OB)
Golden Harbor (Support / Buy Zone)
3,734 – 3,718 (Bullish OB)
3,687 – 3,685 (Buy Zone OB)
3,650 – 3,648 (Deeper Buy Zone, confluence with EMA 89)
🎯 Captain’s Map – Trade Plan
⚡ Sell (short-term scalp)
Entry: 3,776 – 3,773
SL: 3,783
TP: 3,770 – 3,765 – 3,760 – 3,755 – 3,750
✅ Buy (main priority)
Buy Zone 1 (OB)
Entry: 3,687 – 3,685
SL: 3,678
TP: 3,700 – 3,705 – 3,710 – 3,715 – 3,720
Buy Zone 2 (Deeper OB)
Entry: 3,650 – 3,648
SL: 3,638
TP: 3,665 – 3,670 – 3,675 – 3,680 – 3,685
⚓ Captain’s Note
“The Golden sails are facing headwinds from short-term EMAs, but Golden Harbor 🏝️ (3,734 – 3,650) remains a solid support dock. Storm Breaker 🌊 (3,769 – 3,777) is only suitable for short Quick Boarding 🚤 scalps. Tonight, the US sea will bring big waves from data & FED speeches – sailors, tighten your sails and manage trades with discipline.”
📢 If you find Captain’s Log useful, don’t forget to Follow for the latest updates.
💬 Do you have a different view on Gold? Drop a comment and join the crew discussion!

LiamTrading – XAUUSD Fibo & Volume Profile AnalysisLiamTrading – XAUUSD Today's Scenario: Fibo & Volume Profile Analysis
Gold, after testing the 375x zone, has shown clear signs of weakening. On the H1 frame, the price structure is forming an adjustment phase as it aligns with key Fibonacci and Volume Profile levels. This is the time when the market begins to “filter” liquidity, creating opportunities for both short sell orders and buys at strong support zones.
Technical Analysis
Fibonacci indicates the 0.786 – 1.0 zone around 3756–3758 coincides with strong resistance and FVG, with a high potential for a reversal.
Volume Profile points out the POC zone around 3735–3740; if breached, it will pave the way for deeper downward pressure.
The confluence support zone 0.618 fibo + large volume around 3688–3691 is suitable for scalping buys.
Further, the 3648–3651 area is reinforced by VAL and the volume profile bottom, making it a strong long-term “Buy zone.”
Trading Plan Reference
Sell zone: 3756 – 3758, SL 3763, TP 3750 – 3748 – 3736 – 3710 – 3690 – 3655
Buy scalping: 3688 – 3691, SL 3685, TP 3701 – 3715 – 3728
Long-term Buy zone: 3648 – 3651, SL 3640, TP 3670 – 3688 – 3700 – 3718 – 3733 – 3755
In summary, gold is moving according to the technical structure with confirmation from Fibonacci and Volume Profile. Today's scenario prioritizes observing reactions around the sell zone 3756–3758 to find short opportunities, and waiting to buy at value zones 369x and 365x for the recovery wave.
This is my personal view on XAUUSD. If you want the fastest updates on the next gold scenarios, follow me and join the community to not miss out.

XAUUSD – Wolfe Waves continues on H4XAUUSD – Wolfe Waves continues on H4, price returns below the trendline: prioritising the correction scenario
Hello Trader,
Based on the Wolfe Waves structure on the H4 frame and current price behaviour, gold has returned to trading below the trendline, indicating a weakening of short-term upward momentum and making way for a downward correction before the market decides the next trend. The upper area has created a clear “sell zone”; below, two defensive buying zones appear for both scalping and medium-term.
Main Technical Picture
Wolfe Waves: wave 5 completes near resistance, then price falls back below the trendline — aligning with the correction scenario along Wolfe's target line 1–4.
Trendline & price box area: the close below the rising trendline shows “acceptance” below; immediate resistance lies in the 375x–376x cluster (sell zone).
Momentum: MACD H4 slows down, histogram narrows → high probability of a pullback – retest before a new decision.
Detailed Trading Scenarios
1) Sell according to the correction trend (priority)
Entry: 3756 – 3759
SL: 3764
TP: 3745 → 3732 → 3715 → 3690 → 3672
Reason: the 375x area coincides with the sell zone + upper trendline; selling at retest offers a good R:R ratio.
Confirmation/Invalidation: if H4 closes above 3764 and holds, the short-term selling scenario weakens.
2) Buy scalping in the buffer zone
Entry: 3701 – 3703
SL: 3695
TP: 3715 → 3732 → 3745 → 3766
Note: only a rebound in the correction phase; close each level and move SL according to TP1.
3) Buy medium-term (strong base area)
Entry: 3648 – 3651
SL: 3644
TP: 3672 → 3698 → 3708 → 3722 – 3727
Reason: the 365x area coincides with the demand/accumulation volume on H4; suitable for catching a deep rebound along with the larger trend.
Management: this is a medium-term order, so divide the volume, close each step, and move SL to breakeven after TP1.
Refer to my scenario if you find it reasonable, trade accordingly, and if you enjoy trading gold with high-quality scenarios, follow me

XAUUSD – Downtrend Continues to be FavoredDowntrend Continues to be Favored (Wolfe Waves Pattern H4)
Hello Trader,
Gold is following the Wolfe Waves structure on the H4 chart, after bouncing off the upper resistance zone and returning below the trendline. This indicates that the short-term upward momentum has weakened, and the scenario of a downward adjustment continues to be prioritized at this stage.
Technical Analysis
Wolfe Waves are clearly formed, wave 5 has hit resistance and a reversal signal has appeared.
The price failed to hold above the upper trendline, while the MACD shows weakening upward momentum.
The 3746 – 3748 zone is considered the main “sell zone” in the short term.
Nearby support zones: 3709 – 3711 and deeper at 3675 – 3678. Further out, the area around 3650 is an important “buy zone” in the medium term.
Trading Scenarios
1. Sell with the trend (priority)
Entry: 3746 – 3748
SL: 3754
TP: 3733 → 3720 → 3702 → 3690
2. Buy Short-term Scalping
Entry: 3709 – 3711
SL: 3705
TP: 3722 → 3730 → 3745
3. Buy Deep Support Scalping
Entry: 3675 – 3678
SL: 3670
TP: 3688 → 3696 → 3710 → 3725
4. Medium-term Buy Zone
Entry: around 3650
This is a large volume accumulation zone, coinciding with strong support on H4. This area is suitable for considering medium-term buy orders if the price adjusts deeply.
Conclusion
In the short term, the bearish scenario continues to be favored, especially when the price stays below the 3748 zone.
Buy strategies should only be considered in the form of scalping or at the important buy zone around 3650.
The current gold market is still in a distribution phase, so patience is needed to observe candle confirmations at entry zones to optimize the R:R ratio.
This is today's XAUUSD trading scenario according to Wolfe Waves on H4. You can refer to it and combine it with your personal strategy for the best risk management.
Follow me to receive the latest scenarios when the price structure changes.

GBPUSD – Medium-Term H1/H4 Technical Outlook
Overview: GBPUSD has broken below its ascending channel after failing to hold gains around the 1.3530–1.3575 supply zone. Price is now testing the 0.618 retracement (~1.3366) with the RSI (5) at heavily oversold levels (~13–14), suggesting scope for a corrective bounce before the broader bearish bias continues.
For traders, the focus remains on selling into rallies while considering short-term buy opportunities at key liquidity zones.
Market Structure
Trendline Break: The uptrend line has been breached, turning the bias towards selling rallies.
Resistance/Supply: 1.3537 and 1.3453–1.3428.
Support/Demand: Initial levels at 1.3366 (Fib 0.618) and 1.3319; major demand between 1.3143–1.3093.
Momentum: Oversold conditions increase the probability of corrective upside moves before continuation lower.
Trading Scenarios
Sell the Rally – Primary Plan
Entry: 1.3500 – 1.3510
Stop Loss: 1.3550
Take Profit: 1.3480 – 1.3466 – 1.3445 – 1.3430
Rationale: Short opportunities on retests of broken structure. Bias only invalidated if price closes above 1.3550 on the 4H chart.
Buy the Dip – Intraday Scalps
Entry: 1.3310 – 1.3330
Stop Loss: 1.3290
Take Profit: 1.3355 – 1.3368 – 1.3390 – 1.3410
Rationale: Oversold conditions and demand at 1.3319 favour quick long scalps back into resistance.
Deeper Liquidity Sweep – Swing Buy
Entry: 1.3090 – 1.3110
Stop Loss: 1.3050
Take Profit: 1.3135 – 1.3160 – 1.3200 – 1.3240
Rationale: A sweep into the 1.3143–1.3093 demand zone could provide a stronger base for swing long positions.
Risk Management & Invalidation
A 4H close above 1.3550 invalidates the bearish scenario.
A strong break below 1.3310 suggests focusing on the deeper buy zone rather than scalping longs.
Stagger take-profit levels and move stops to breakeven once the first target is reached.

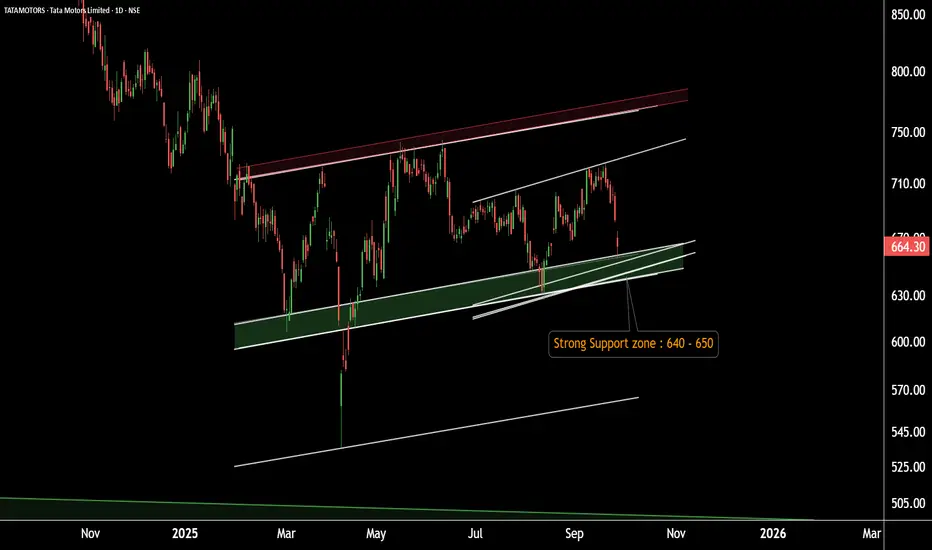
Tata Motors – Back at Key Support! Setting Up for the Next Bull.Tata Motors Daily Chart Update
Tata Motors is moving within a well-defined parallel channel, with a strong support zone around 630–650.
If this zone holds, the stock may see upward momentum.
Potential upside target: 730–740.
Thank you!
GOLD SHORT FROM RESISTANCE
GOLD SIGNAL
Trade Direction: short
Entry Level: 3,743.82
Target Level: 3,553.39
Stop Loss: 3,870.43
RISK PROFILE
Risk level: medium
Suggested risk: 1%
Timeframe: 1D
Disclosure: I am part of Trade Nation's Influencer program and receive a monthly fee for using their TradingView charts in my analysis.
✅LIKE AND COMMENT MY IDEAS✅

XAU/USD Intraday Plan | Support & Resistance to WatchGold is following the analysis — after failing to break the $3,782 resistance yesterday, price dropped into the First Reaction Support Zone. Currently trading around $3,741, the rejection has pushed price below the 50MA, keeping near-term pressure on the downside.
A clean reclaim and hold above $3,753 could shift momentum back to test $3,768–$3,782.
Failure to hold above the First Reaction Zone risks a deeper pullback into $3,712–$3,690, in line with the 200MA, which may act as dynamic support. If this breaks, sellers may target the Deeper Support Zone $3,665–$3,642.
📌 Key Levels to Watch
Resistance:
$3,753
$3,768
$3,782
Support:
$3,728
$3,712
$3,690
$3,665
🔎 Fundamental Focus – Thu, Sep 25
Heavy data day for USD with several high-impact releases:
🔴Final GDP q/q
🔴Unemployment Claims
🔶Core & Durable Goods Orders
🔶GDP Price Index
🔶 Existing Home Sales
👉 For gold, today’s data cluster is critical — stronger numbers could weigh on price, while weaker outcomes may support upside. Expect elevated volatility.

EUR/GBP BEARS ARE GAINING STRENGTH|SHORT
Hello, Friends!
EUR/GBP pair is in the downtrend because previous week’s candle is red, while the price is clearly rising on the 12H timeframe. And after the retest of the resistance line above I believe we will see a move down towards the target below at 0.867 because the pair is overbought due to its proximity to the upper BB band and a bearish correction is likely.
Disclosure: I am part of Trade Nation's Influencer program and receive a monthly fee for using their TradingView charts in my analysis.
✅LIKE AND COMMENT MY IDEAS✅
