BITCOIN BEARS WILL DOMINATE THE MARKET|SHORT
BITCOIN SIGNAL
Trade Direction: short
Entry Level: 117,076.48
Target Level: 111,750.81
Stop Loss: 120,567.13
RISK PROFILE
Risk level: medium
Suggested risk: 1%
Timeframe: 1D
Disclosure: I am part of Trade Nation's Influencer program and receive a monthly fee for using their TradingView charts in my analysis.
✅LIKE AND COMMENT MY IDEAS✅
Techincalanalysis

GBP/CAD SENDS CLEAR BEARISH SIGNALS|SHORT
GBP/CAD SIGNAL
Trade Direction: short
Entry Level:1.875
Target Level: 1.843
Stop Loss: 1.896
RISK PROFILE
Risk level: medium
Suggested risk: 1%
Timeframe: 1D
Disclosure: I am part of Trade Nation's Influencer program and receive a monthly fee for using their TradingView charts in my analysis.
✅LIKE AND COMMENT MY IDEAS✅

GBP/JPY BEARS ARE GAINING STRENGTH|SHORT
Hello, Friends!
Previous week’s green candle means that for us the GBP/JPY pair is in the uptrend. And the current movement leg was also up but the resistance line will be hit soon and upper BB band proximity will signal an overbought condition so we will go for a counter-trend short trade with the target being at 199.769.
Disclosure: I am part of Trade Nation's Influencer program and receive a monthly fee for using their TradingView charts in my analysis.
✅LIKE AND COMMENT MY IDEAS✅

GBP/NZD SELLERS WILL DOMINATE THE MARKET|SHORT
Hello, Friends!
GBP/NZD uptrend evident from the last 1W green candle makes short trades more risky, but the current set-up targeting 2.264 area still presents a good opportunity for us to sell the pair because the resistance line is nearby and the BB upper band is close which indicates the overbought state of the GBP/NZD pair.
Disclosure: I am part of Trade Nation's Influencer program and receive a monthly fee for using their TradingView charts in my analysis.
✅LIKE AND COMMENT MY IDEAS✅

LiamTrading – XAUUSD Market points to Wave 4LiamTrading – XAUUSD Outlook
Sharing my personal view on the next potential move for gold.
From the current chart structure, the wave pattern suggests XAUUSD is likely in Wave 4. The correction began yesterday after price touched the 3,700 round number – a key resistance area that also aligns with the 1.618 Fibonacci extension. This zone typically attracts significant liquidity, and the subsequent pullback adds weight to the view that Wave 4 has been triggered.
At present, the main support level to monitor is 3,675. A break below this level could see the corrective move complete around 3,656. On the H1 timeframe, RSI has dropped below 30, indicating oversold conditions. In my opinion, while the market trades in this area, short positions remain favourable, though patience is required until clearer confluence signals emerge.
Trading plan (short-term focus):
Sell 3685–3687, SL 3693, TP 3670 – 3656
Buy 3656–3654, SL 3648, TP 3675 – 3690 – 3702 – 3721 – 3740
I’ll continue to share further updates if price action shows significant changes. Wishing everyone good trading and success in the markets.

ANFIBO – GBPUSD Current H1 TrendI’d like to share my perspective on GBPUSD.
The uptrend on GBPUSD is well-structured, which is not surprising given that this pair often moves in line with gold for much of the time. The trendline shows a clear and sustainable upward direction.
Price has recently reacted at the dynamic resistance around the 1.618 Fibonacci extension. This should be considered only as a minor correction before the main bullish trend continues.
Trading Scenarios – Buy Continuation
Buy Setup 1
Entry: 1.3610 – 1.3600
Stop Loss: 1.3590
Take Profit: 1.3635 – 1.3665 – 1.3680 – 1.3740 – 1.3760
Buy Setup 2
Entry: 1.3580 – 1.3570
Stop Loss: 1.3550
Take Profit: 1.3595 – 1.3615 – 1.3630 – 1.3680 – 1.3740 – 1.3760
Stay tuned for my next updates to catch new trading signals as soon as market conditions shift.

ANFIBO – GBPJPY H1 Medium-Term StrategyANFIBO – GBPJPY H1 Medium-Term Strategy
I’d like to share my outlook on GBPJPY.
The bullish channel on the H1 timeframe remains very strong and stable. This pair has been trending upwards for quite some time, with price reacting cleanly at both the upper and lower trendlines.
Advantages: The structure is fairly straightforward, which makes it easier to identify entry points.
Drawback: For traders targeting larger moves, profit potential may feel limited as the current range offers a maximum of around 100 pips.
Trading Plan
We continue to wait for opportunities within this channel, focusing on liquidity zones and key psychological levels for entries.
Sell Setup
Entry: 200.20 – 200.30
Stop Loss: 200.50
Take Profit: 200.00 – 199.85 – 199.70
Buy Setup
Entry: 199.70 – 199.60
Stop Loss: 199.40
Take Profit: 199.85 – 200.10 – 200.35 – 200.55 – 200.80 – 201.00
Best of luck with your trades following this scenario, and keep an eye out for my upcoming updates.

XAUUSD H1 – Pennant + Head & Shoulders:XAUUSD H1 – Pennant + Head & Shoulders: Key Levels 3657 / 3627
Hello Traders,
Gold started the week with a bounce of over 20 points from the rising trendline and is now consolidating inside a Pennant, which also lines up with a small Head & Shoulders on the H1 chart. The market is waiting for a breakout and confirmation to set the next clear move.
What to Watch
3655–3660: Key reaction area (trendline + Pennant top).
3627: Critical support — if broken, it would invalidate the short-term bullish setup.
Fibonacci: 1.618 mid-range, 2.618 lower — possible correction targets.
MACD (12,26,9): Histogram has turned negative → short-term downside pressure, but no firm confirmation yet.
Trading Scenarios
Bullish Setup
Entry: Retest around 3654–3657
Targets: 3663 – 3670 – 3680 → 3695
Stop: Below 3648
Bearish Setup
Entry: Sell on a confirmed break, or on a retest at 3671–3674
Targets: 3663 – 3650 – 3633 – 3615 → 3595 → 3568 → 3540
Stop: Above 3679
markets now see a near-certain chance of a 0.25% Fed rate cut on 17 September, with some probability of a 0.50% cut still in play.
If you find this analysis useful, drop your thoughts in the comments. I’ll share updated scenarios as soon as the structure shifts — follow me to get the latest insights quickly.

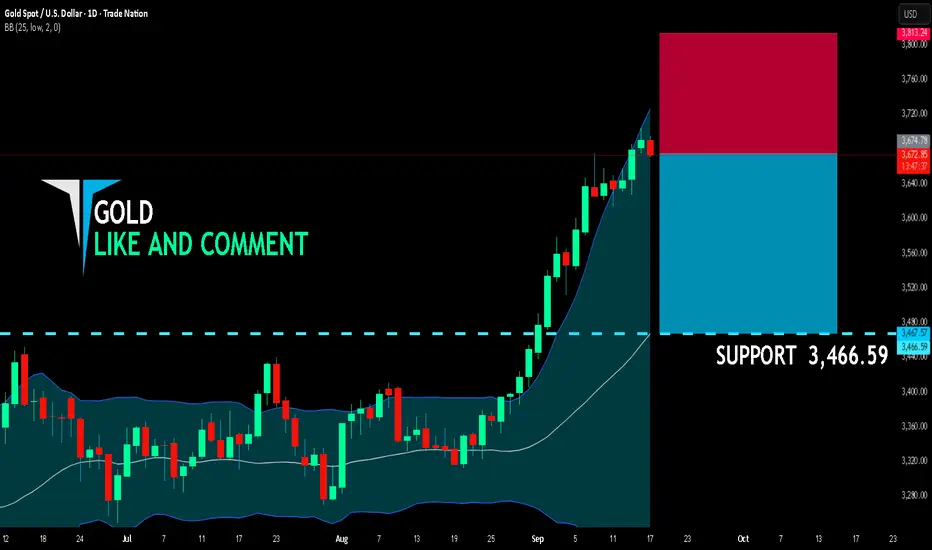
GOLD BEARISH BIAS RIGHT NOW| SHORT
GOLD SIGNAL
Trade Direction: short
Entry Level: 3,674.78
Target Level: 3,466.59
Stop Loss: 3,813.24
RISK PROFILE
Risk level: medium
Suggested risk: 1%
Timeframe: 1D
Disclosure: I am part of Trade Nation's Influencer program and receive a monthly fee for using their TradingView charts in my analysis.
✅LIKE AND COMMENT MY IDEAS✅
GBP/AUD BEST PLACE TO SELL FROM|SHORT
GBP/AUD SIGNAL
Trade Direction: short
Entry Level: 2.043
Target Level: 2.034
Stop Loss: 2.050
RISK PROFILE
Risk level: medium
Suggested risk: 1%
Timeframe: 3h
Disclosure: I am part of Trade Nation's Influencer program and receive a monthly fee for using their TradingView charts in my analysis.
✅LIKE AND COMMENT MY IDEAS✅

GBP/CHF BULLS ARE STRONG HERE|LONG
Hello, Friends!
GBP/CHF pair is in the uptrend because previous week’s candle is green, while the price is evidently falling on the 3H timeframe. And after the retest of the support line below I believe we will see a move up towards the target above at 1.077 because the pair is oversold due to its proximity to the lower BB band and a bullish correction is likely.
Disclosure: I am part of Trade Nation's Influencer program and receive a monthly fee for using their TradingView charts in my analysis.
✅LIKE AND COMMENT MY IDEAS✅

EUR/CHF LONG FROM SUPPORT
Hello, Friends!
EUR/CHF pair is trading in a local downtrend which we know by looking at the previous 1W candle which is red. On the 3H timeframe the pair is going down too. The pair is oversold because the price is close to the lower band of the BB indicator. So we are looking to buy the pair with the lower BB line acting as support. The next target is 0.935 area.
Disclosure: I am part of Trade Nation's Influencer program and receive a monthly fee for using their TradingView charts in my analysis.
✅LIKE AND COMMENT MY IDEAS✅

MGR - 3 years RECTANGLE══════════════════════════════
Since 2014, my markets approach is to spot
trading opportunities based solely on the
development of
CLASSICAL CHART PATTERNS
🤝Let’s learn and grow together 🤝
══════════════════════════════
Hello Traders ✌
After a careful consideration I came to the conclusion that:
- it is crucial to be quick in alerting you with all the opportunities I spot and often I don't post a good pattern because I don't have the opportunity to write down a proper didactical comment;
- since my parameters to identify a Classical Pattern and its scenario are very well defined, many of my comments were and would be redundant;
- the information that I think is important is very simple and can easily be understood just by looking at charts;
For these reasons and hoping to give you a better help, I decided to write comments only when something very specific or interesting shows up, otherwise all the information is shown on the chart.
Thank you all for your support
🔎🔎🔎 ALWAYS REMEMBER
"A pattern IS NOT a Pattern until the breakout is completed. Before that moment it is just a bunch of colorful candlesticks on a chart of your watchlist"
═════════════════════════════
⚠ DISCLAIMER ⚠
The content is The Art Of Charting's personal opinion and it is posted purely for educational purpose and therefore it must not be taken as a direct or indirect investing recommendations or advices. Any action taken upon these information is at your own risk.

GBPCAD - 6 months ASCENDING TRIANGLE══════════════════════════════
Since 2014, my markets approach is to spot
trading opportunities based solely on the
development of
CLASSICAL CHART PATTERNS
🤝Let’s learn and grow together 🤝
══════════════════════════════
Hello Traders ✌
After a careful consideration I came to the conclusion that:
- it is crucial to be quick in alerting you with all the opportunities I spot and often I don't post a good pattern because I don't have the opportunity to write down a proper didactical comment;
- since my parameters to identify a Classical Pattern and its scenario are very well defined, many of my comments were and would be redundant;
- the information that I think is important is very simple and can easily be understood just by looking at charts;
For these reasons and hoping to give you a better help, I decided to write comments only when something very specific or interesting shows up, otherwise all the information is shown on the chart.
Thank you all for your support
🔎🔎🔎 ALWAYS REMEMBER
"A pattern IS NOT a Pattern until the breakout is completed. Before that moment it is just a bunch of colorful candlesticks on a chart of your watchlist"
═════════════════════════════
⚠ DISCLAIMER ⚠
The content is The Art Of Charting's personal opinion and it is posted purely for educational purpose and therefore it must not be taken as a direct or indirect investing recommendations or advices. Any action taken upon these information is at your own risk.

EURSGD - 5 months CUP & HANDLE══════════════════════════════
Since 2014, my markets approach is to spot
trading opportunities based solely on the
development of
CLASSICAL CHART PATTERNS
🤝Let’s learn and grow together 🤝
══════════════════════════════
Hello Traders ✌
After a careful consideration I came to the conclusion that:
- it is crucial to be quick in alerting you with all the opportunities I spot and often I don't post a good pattern because I don't have the opportunity to write down a proper didactical comment;
- since my parameters to identify a Classical Pattern and its scenario are very well defined, many of my comments were and would be redundant;
- the information that I think is important is very simple and can easily be understood just by looking at charts;
For these reasons and hoping to give you a better help, I decided to write comments only when something very specific or interesting shows up, otherwise all the information is shown on the chart.
Thank you all for your support
🔎🔎🔎 ALWAYS REMEMBER
"A pattern IS NOT a Pattern until the breakout is completed. Before that moment it is just a bunch of colorful candlesticks on a chart of your watchlist"
═════════════════════════════
⚠ DISCLAIMER ⚠
The content is The Art Of Charting's personal opinion and it is posted purely for educational purpose and therefore it must not be taken as a direct or indirect investing recommendations or advices. Any action taken upon these information is at your own risk.

MTB - 9 months HEAD & SHOULDERS══════════════════════════════
Since 2014, my markets approach is to spot
trading opportunities based solely on the
development of
CLASSICAL CHART PATTERNS
🤝Let’s learn and grow together 🤝
══════════════════════════════
Hello Traders ✌
After a careful consideration I came to the conclusion that:
- it is crucial to be quick in alerting you with all the opportunities I spot and often I don't post a good pattern because I don't have the opportunity to write down a proper didactical comment;
- since my parameters to identify a Classical Pattern and its scenario are very well defined, many of my comments were and would be redundant;
- the information that I think is important is very simple and can easily be understood just by looking at charts;
For these reasons and hoping to give you a better help, I decided to write comments only when something very specific or interesting shows up, otherwise all the information is shown on the chart.
Thank you all for your support
🔎🔎🔎 ALWAYS REMEMBER
"A pattern IS NOT a Pattern until the breakout is completed. Before that moment it is just a bunch of colorful candlesticks on a chart of your watchlist"
═════════════════════════════
⚠ DISCLAIMER ⚠
The content is The Art Of Charting's personal opinion and it is posted purely for educational purpose and therefore it must not be taken as a direct or indirect investing recommendations or advices. Any action taken upon these information is at your own risk.

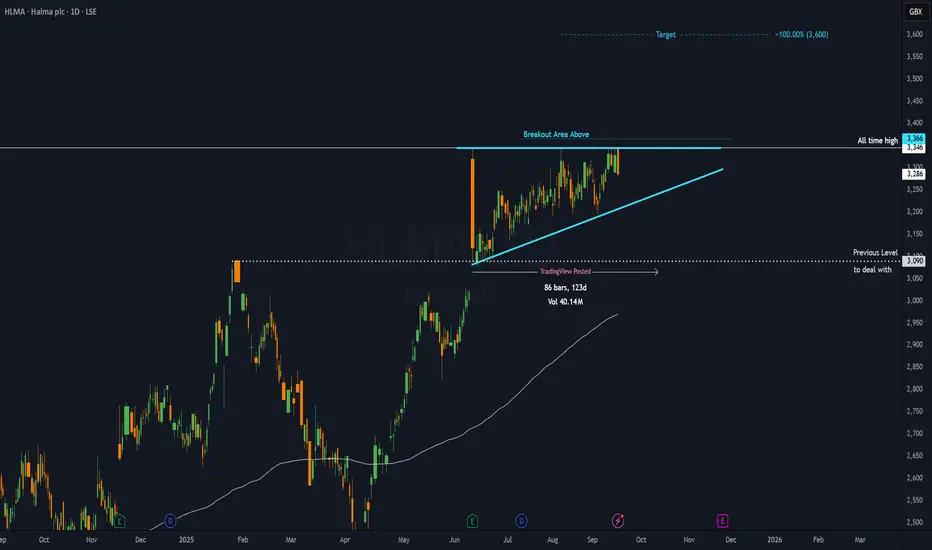
HLMA - 4 months ASCENDING TRIANGLE══════════════════════════════
Since 2014, my markets approach is to spot
trading opportunities based solely on the
development of
CLASSICAL CHART PATTERNS
🤝Let’s learn and grow together 🤝
══════════════════════════════
Hello Traders ✌
After a careful consideration I came to the conclusion that:
- it is crucial to be quick in alerting you with all the opportunities I spot and often I don't post a good pattern because I don't have the opportunity to write down a proper didactical comment;
- since my parameters to identify a Classical Pattern and its scenario are very well defined, many of my comments were and would be redundant;
- the information that I think is important is very simple and can easily be understood just by looking at charts;
For these reasons and hoping to give you a better help, I decided to write comments only when something very specific or interesting shows up, otherwise all the information is shown on the chart.
Thank you all for your support
🔎🔎🔎 ALWAYS REMEMBER
"A pattern IS NOT a Pattern until the breakout is completed. Before that moment it is just a bunch of colorful candlesticks on a chart of your watchlist"
═════════════════════════════
⚠ DISCLAIMER ⚠
The content is The Art Of Charting's personal opinion and it is posted purely for educational purpose and therefore it must not be taken as a direct or indirect investing recommendations or advices. Any action taken upon these information is at your own risk.
EURCNY - 5 months CUP & HANDLE══════════════════════════════
Since 2014, my markets approach is to spot
trading opportunities based solely on the
development of
CLASSICAL CHART PATTERNS
🤝Let’s learn and grow together 🤝
══════════════════════════════
Hello Traders ✌
After a careful consideration I came to the conclusion that:
- it is crucial to be quick in alerting you with all the opportunities I spot and often I don't post a good pattern because I don't have the opportunity to write down a proper didactical comment;
- since my parameters to identify a Classical Pattern and its scenario are very well defined, many of my comments were and would be redundant;
- the information that I think is important is very simple and can easily be understood just by looking at charts;
For these reasons and hoping to give you a better help, I decided to write comments only when something very specific or interesting shows up, otherwise all the information is shown on the chart.
Thank you all for your support
🔎🔎🔎 ALWAYS REMEMBER
"A pattern IS NOT a Pattern until the breakout is completed. Before that moment it is just a bunch of colorful candlesticks on a chart of your watchlist"
═════════════════════════════
⚠ DISCLAIMER ⚠
The content is The Art Of Charting's personal opinion and it is posted purely for educational purpose and therefore it must not be taken as a direct or indirect investing recommendations or advices. Any action taken upon these information is at your own risk.

8630 - 7 months ASCENDING TRIANGLE══════════════════════════════
Since 2014, my markets approach is to spot
trading opportunities based solely on the
development of
CLASSICAL CHART PATTERNS
🤝Let’s learn and grow together 🤝
══════════════════════════════
Hello Traders ✌
After a careful consideration I came to the conclusion that:
- it is crucial to be quick in alerting you with all the opportunities I spot and often I don't post a good pattern because I don't have the opportunity to write down a proper didactical comment;
- since my parameters to identify a Classical Pattern and its scenario are very well defined, many of my comments were and would be redundant;
- the information that I think is important is very simple and can easily be understood just by looking at charts;
For these reasons and hoping to give you a better help, I decided to write comments only when something very specific or interesting shows up, otherwise all the information is shown on the chart.
Thank you all for your support
🔎🔎🔎 ALWAYS REMEMBER
"A pattern IS NOT a Pattern until the breakout is completed. Before that moment it is just a bunch of colorful candlesticks on a chart of your watchlist"
═════════════════════════════
⚠ DISCLAIMER ⚠
The content is The Art Of Charting's personal opinion and it is posted purely for educational purpose and therefore it must not be taken as a direct or indirect investing recommendations or advices. Any action taken upon these information is at your own risk.

4528 - 7 months RECTANGLE══════════════════════════════
Since 2014, my markets approach is to spot
trading opportunities based solely on the
development of
CLASSICAL CHART PATTERNS
🤝Let’s learn and grow together 🤝
══════════════════════════════
Hello Traders ✌
After a careful consideration I came to the conclusion that:
- it is crucial to be quick in alerting you with all the opportunities I spot and often I don't post a good pattern because I don't have the opportunity to write down a proper didactical comment;
- since my parameters to identify a Classical Pattern and its scenario are very well defined, many of my comments were and would be redundant;
- the information that I think is important is very simple and can easily be understood just by looking at charts;
For these reasons and hoping to give you a better help, I decided to write comments only when something very specific or interesting shows up, otherwise all the information is shown on the chart.
Thank you all for your support
🔎🔎🔎 ALWAYS REMEMBER
"A pattern IS NOT a Pattern until the breakout is completed. Before that moment it is just a bunch of colorful candlesticks on a chart of your watchlist"
═════════════════════════════
⚠ DISCLAIMER ⚠
The content is The Art Of Charting's personal opinion and it is posted purely for educational purpose and therefore it must not be taken as a direct or indirect investing recommendations or advices. Any action taken upon these information is at your own risk.

4091 - 3 months RECTANGLE══════════════════════════════
Since 2014, my markets approach is to spot
trading opportunities based solely on the
development of
CLASSICAL CHART PATTERNS
🤝Let’s learn and grow together 🤝
══════════════════════════════
Hello Traders ✌
After a careful consideration I came to the conclusion that:
- it is crucial to be quick in alerting you with all the opportunities I spot and often I don't post a good pattern because I don't have the opportunity to write down a proper didactical comment;
- since my parameters to identify a Classical Pattern and its scenario are very well defined, many of my comments were and would be redundant;
- the information that I think is important is very simple and can easily be understood just by looking at charts;
For these reasons and hoping to give you a better help, I decided to write comments only when something very specific or interesting shows up, otherwise all the information is shown on the chart.
Thank you all for your support
🔎🔎🔎 ALWAYS REMEMBER
"A pattern IS NOT a Pattern until the breakout is completed. Before that moment it is just a bunch of colorful candlesticks on a chart of your watchlist"
═════════════════════════════
⚠ DISCLAIMER ⚠
The content is The Art Of Charting's personal opinion and it is posted purely for educational purpose and therefore it must not be taken as a direct or indirect investing recommendations or advices. Any action taken upon these information is at your own risk.

MAVI - 13 months HEAD & SHOULDERS══════════════════════════════
Since 2014, my markets approach is to spot
trading opportunities based solely on the
development of
CLASSICAL CHART PATTERNS
🤝Let’s learn and grow together 🤝
══════════════════════════════
Hello Traders ✌
After a careful consideration I came to the conclusion that:
- it is crucial to be quick in alerting you with all the opportunities I spot and often I don't post a good pattern because I don't have the opportunity to write down a proper didactical comment;
- since my parameters to identify a Classical Pattern and its scenario are very well defined, many of my comments were and would be redundant;
- the information that I think is important is very simple and can easily be understood just by looking at charts;
For these reasons and hoping to give you a better help, I decided to write comments only when something very specific or interesting shows up, otherwise all the information is shown on the chart.
Thank you all for your support
🔎🔎🔎 ALWAYS REMEMBER
"A pattern IS NOT a Pattern until the breakout is completed. Before that moment it is just a bunch of colorful candlesticks on a chart of your watchlist"
═════════════════════════════
⚠ DISCLAIMER ⚠
The content is The Art Of Charting's personal opinion and it is posted purely for educational purpose and therefore it must not be taken as a direct or indirect investing recommendations or advices. Any action taken upon these information is at your own risk.

Gbpusd outlook 📊 GBP/USD Daily Analysis (16 Sept 2025)
Price currently trading around 1.3632.
Market is approaching a Daily Fair Value Gap (FVG) and Order Block zone.
🔹 Expectation: Possible rejection from this supply area with downside movement.
🔹 Key Zone: 1.3650 – 1.3700 (Strong resistance / Order Block).
🔹 Bearish setup unless price breaks & sustains above the OB.
⚠️ Note: Until liquidity sweep occurs to the downside and CISD or MSS structure is formed, taking an entry is risky.
💡 ICT-based analysis – waiting for confirmation before entries
