EUR/USD SENDS CLEAR BULLISH SIGNALS|LONG
Hello, Friends!
EUR/USD is making a bearish pullback on the 4H TF and is nearing the support line below while we are generally bullish biased on the pair due to our previous 1W candle analysis, thus making a trend-following long a good option for us with the target being the 1.167 level.
Disclosure: I am part of Trade Nation's Influencer program and receive a monthly fee for using their TradingView charts in my analysis.
✅LIKE AND COMMENT MY IDEAS✅
Techincalanalysis

AUD/CAD BEARS ARE GAINING STRENGTH|SHORT
Hello, Friends!
Previous week’s green candle means that for us the AUD/CAD pair is in the uptrend. And the current movement leg was also up but the resistance line will be hit soon and upper BB band proximity will signal an overbought condition so we will go for a counter-trend short trade with the target being at 0.924.
Disclosure: I am part of Trade Nation's Influencer program and receive a monthly fee for using their TradingView charts in my analysis.
✅LIKE AND COMMENT MY IDEAS✅

GBP/CAD SELLERS WILL DOMINATE THE MARKET|SHORT
GBP/CAD SIGNAL
Trade Direction: short
Entry Level: 1.865
Target Level: 1.862
Stop Loss: 1.867
RISK PROFILE
Risk level: medium
Suggested risk: 1%
Timeframe: 1h
Disclosure: I am part of Trade Nation's Influencer program and receive a monthly fee for using their TradingView charts in my analysis.
✅LIKE AND COMMENT MY IDEAS✅

USOIL BEARISH BIAS RIGHT NOW| SHORT
USOIL SIGNAL
Trade Direction: short
Entry Level: 58.78
Target Level: 57.00
Stop Loss: 59.96
RISK PROFILE
Risk level: medium
Suggested risk: 1%
Timeframe: 1D
Disclosure: I am part of Trade Nation's Influencer program and receive a monthly fee for using their TradingView charts in my analysis.
✅LIKE AND COMMENT MY IDEAS✅

XAUUSD H4 – Gold Trading Plan for Next Week (Liquidity-Based Levels)
Gold is heading into a key decision week as price returns to a major reaction area. The market is currently best traded by waiting for liquidity reactions at the highlighted zones, rather than chasing moves in the middle of the range.
1) H4 Technical Context
Price has recovered and is now retesting a key pivot region around the 4.45xx area.
The chart shows clear supply zones overhead, while the 4445–4449 zone stands out as the highest-probability buy reaction area.
If price holds this buy zone, the preferred path is continuation higher toward the upper supply region near 4632–4637.
2) Key Levels to Watch
Main BUY zone: 4445 – 4449
Liquidity confluence area with strong probability of bullish reaction if structure remains intact.
Mid resistance: 4550 – 4560
A reaction zone where buyers may take partial profits and where price behaviour matters.
Target SELL zone (scalping): 4632 – 4637
Strong overhead supply. Ideal for short-term sell reactions if price rallies sharply and shows rejection.
Strong support: around 4408
If the main buy zone fails, this level becomes the next key area that defines whether the pullback deepens.
3) PRIORITY SCENARIO – Main Plan (Buy with Structure)
Next week’s primary strategy remains trend-following, but execution should be level-based.
Buy area: 4445–4449
Best confirmation: H4/H1 candles hold the zone and close back above it without a strong breakdown.
Upside expectations: push toward 4550–4560 first, then extend toward 4632–4637.
4) ALTERNATIVE SCENARIO – If the Buy Zone Fails
If price breaks 4445–4449 cleanly and accepts below it:
A deeper correction can develop toward 4408 and potentially lower.
In that case, the plan is to wait for a clear reaction at support before looking for the next long setup.
5) SELL Scenario – Short-Term Only
Selling is not the primary strategy. It is only considered as a short-term scalp at premium supply.
Sell zone: 4632–4637
Only sell on clear rejection signals such as strong wicks, failed breakout, or a lower-timeframe structure shift.
6) Weekly Summary
Focus zone: 4445–4449 is the key decision area
Hold above it → prefer BUY toward 4550–4560 and 4632–4637
Lose it → watch 4408 for deeper correction reaction
Sell ideas are scalps only at the upper supply zone

EUR/JPY SENDS CLEAR BULLISH SIGNALS|LONG
Hello, Friends!
EUR/JPY pair is in the downtrend because previous week’s candle is red, while the price is clearly falling on the 4H timeframe. And after the retest of the support line below I believe we will see a move up towards the target above at 183.402 because the pair oversold due to its proximity to the lower BB band and a bullish correction is likely.
Disclosure: I am part of Trade Nation's Influencer program and receive a monthly fee for using their TradingView charts in my analysis.
✅LIKE AND COMMENT MY IDEAS✅

GOLD BULLISH BIAS RIGHT NOW| LONG
GOLD SIGNAL
Trade Direction: long
Entry Level: 4,427.50
Target Level: 4,459.93
Stop Loss: 4,405.83
RISK PROFILE
Risk level: medium
Suggested risk: 1%
Timeframe: 1h
Disclosure: I am part of Trade Nation's Influencer program and receive a monthly fee for using their TradingView charts in my analysis.
✅LIKE AND COMMENT MY IDEAS✅

EUR/CAD SHORT FROM RESISTANCE
Hello, Friends!
We are targeting the 1.609 level area with our short trade on EUR/CAD which is based on the fact that the pair is overbought on the BB band scale and is also approaching a resistance line above thus going us a good entry option.
Disclosure: I am part of Trade Nation's Influencer program and receive a monthly fee for using their TradingView charts in my analysis.
✅LIKE AND COMMENT MY IDEAS✅

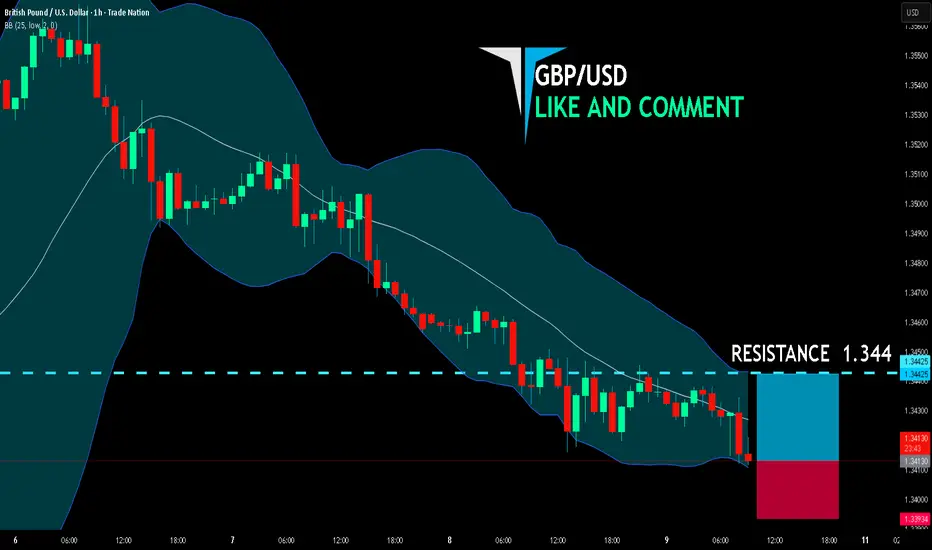
GBP/USD BULLS ARE GAINING STRENGTH|LONG
GBP/USD SIGNAL
Trade Direction: long
Entry Level: 1.341
Target Level: 1.344
Stop Loss: 1.339
RISK PROFILE
Risk level: medium
Suggested risk: 1%
Timeframe: 1h
Disclosure: I am part of Trade Nation's Influencer program and receive a monthly fee for using their TradingView charts in my analysis.
✅LIKE AND COMMENT MY IDEAS✅
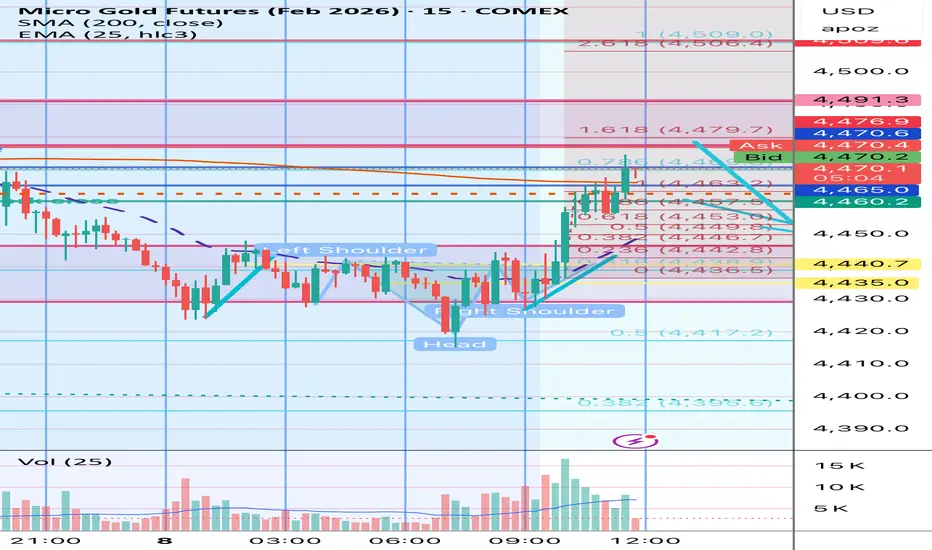
XAUUSD (H3) – Liam Plan Trendline break confirms the uptrend ✅ | Buy the discount, scalp-sell at ATH
Quick overview
On the H3 chart, the story is clean: price has broken the bearish trendline and held structure after a clear BOS, which keeps the bias bullish for continuation.
But the best execution is still the same: no FOMO. I’d rather buy from discount liquidity zones than chase mid-range candles.
Key Levels (from your chart)
✅ Buy Zone 1 (re-buy): 4434 – 4437
✅ Buy Zone 2 (liquidity imbalance): 4340 – 4343 (deep sweep zone)
✅ ATH Sell scalping: 4560 (main profit-taking / reaction sell)
Technical read (Liam style)
Breaking through the trend confirms uptrend: the trendline break signals buyers are back in control.
4434–4437 is the clean re-entry area: a logical pullback zone with better R:R.
If volatility spikes and price hunts liquidity, 4340–4343 is the “best value” area to look for a strong reaction.
Trading scenarios
✅ Scenario A (priority): BUY the pullback at 4434–4437
Entry: 4434 – 4437
SL: below 4426 (or below the most recent H1/H3 swing low)
TP1: 4485 – 4500
TP2: 4560 (ATH – main target)
Logic: Uptrend confirmation is in place — I only want the pullback entry, not a chase.
✅ Scenario B (deep buy): If price sweeps down into 4340–4343
Entry: 4340 – 4343
SL: below 4330
TP: 4434 → 4500 → 4560
Logic: This is the “sweet spot” if the market does a liquidity reset before pushing higher again.
⚠️ Scenario C (scalp only): SELL reaction at ATH 4560
Entry: 4560 (only if we see clear rejection / weakness)
SL: above the sweep high
TP: 4520 → 4500 (quick scalp)
Note: This is a scalp idea at ATH — not a long-term bearish call while the bullish structure is intact.
Key notes
Avoid entries mid-range. Only execute at 4434–4437 or 4340–4343.
Wait for confirmation on M15–H1 (rejection / engulf / MSS).
Risk management: 1–2% per idea, scale out into ATH.
Are you waiting for the 4434 pullback buy, or hoping for a deeper sweep into 4340 for the cleanest entry? 👀

Why Comparison Feels Productive — And Quietly Destroys YouHello, I’m Camila.
If I’m honest, comparison once felt like a necessary part of growth. It made me feel alert, ambitious, and aware of where I stood. Looking at people ahead of me felt like pressure in the right direction. What I didn’t realize then was that comparison wasn’t pushing me forward — it was slowly pulling my attention away from my own work.
Comparison keeps the mind busy. I would analyze other people’s progress, their speed, their outcomes. It felt productive, almost responsible. But nothing was actually being built. I was thinking about progress instead of creating it, and my brain rewarded me for observation rather than execution.
Over time, comparison changed how I made decisions. Instead of focusing on what I needed to improve today, I started measuring myself against someone else’s timeline. That shift led to rushed moves, unnecessary doubt, and a growing impatience with my own pace. Not because I was doing poorly — but because I was constantly looking elsewhere.
The real cost wasn’t a loss of confidence. It was a loss of trust in my process. Once that trust faded, hesitation took over. And hesitation, more than failure, is what quietly slows everything down.
If there’s one thing I’ve learned, it’s this: real progress is quiet. It doesn’t demand comparison to feel valid. When I focus on my own work and my own pace, growth takes care of itself — without the noise.
Traders, If you liked this educational post, give it a boost and drop a comment.

Gold price movements before the release of the NONFARM data.1️⃣ Trend / Trendline
Short-term trend: Sideways–bearish within a contracting triangle pattern.
Price is being compressed between the descending trendline above (selling pressure) and the ascending trendline below (weakening support).
Current structure: A technical rebound, but price has not broken the descending trendline yet ⇒ no confirmed bullish reversal.
2️⃣ Resistance
4,520 – 4,525: Strong resistance
Confluence of: previous highs + Fibonacci 1.618 + descending trendline.
Prefer sell-on-rejection if bearish price action appears.
3️⃣ Support
4,395 – 4,400: Key support zone
Confluence of: range low + demand zone.
A clear break below this area ⇒ breakdown risk, price may slide further.
4️⃣ Scenarios
Priority: Trade the breakout.
Bullish scenario: Break and close above the descending trendline & above 4,525 ⇒ opens the path for further upside.
Bearish scenario: Break and close below 4,395 ⇒ confirms bearish continuation, favor sell-with-trend setups.
👉 The market is at a decision zone – avoid FOMO and wait for clear confirmation at the boundaries.
Trade Plans
BUY GOLD: 4,398 – 4,400
Stop Loss: 4,388
Take Profit: 100 – 300 – 500 pips
SELL GOLD: 4,523 – 4,525
Stop Loss: 4,533
Take Profit: 100 – 300 – 500 pips

Waiting for 4450 support Price is moving away from a short term inverted head and shoulders on the way to daily highs and a break of 2 day selling if price holds at 4480 into Asia and EU sessions. Tomorrow Friday 1/9 is NFP so choppy markets ahead . Spectating only now until a possible retest of 4450 to act as a support for a push to 4500
XAUUSD: gold decides whether the impulse beginsGold remains in focus as markets reassess Fed rate expectations and macro uncertainty. Slowing economic signals and potential declines in real yields continue to support gold, while its safe-haven role persists without panic-driven flows. This creates consolidation phases before directional moves.
Technically, XAUUSD is trading within a bullish structure after a strong rebound from recent lows. Price holds above a key support zone aligned with former resistance and the 0.5 Fibonacci level. Volatility compression and a developing wedge suggest a pending breakout. EMAs are trending higher and acting as dynamic support, confirming the bullish bias. RSI remains neutral, leaving room for continuation.
The main scenario favors holding above support and breaking higher from the current range. A confirmed breakout opens the path toward the 0.618 and 1.0 Fibonacci targets. A loss of support would invalidate the bullish setup and shift the market into deeper correction.
Gold usually moves first and explains later.

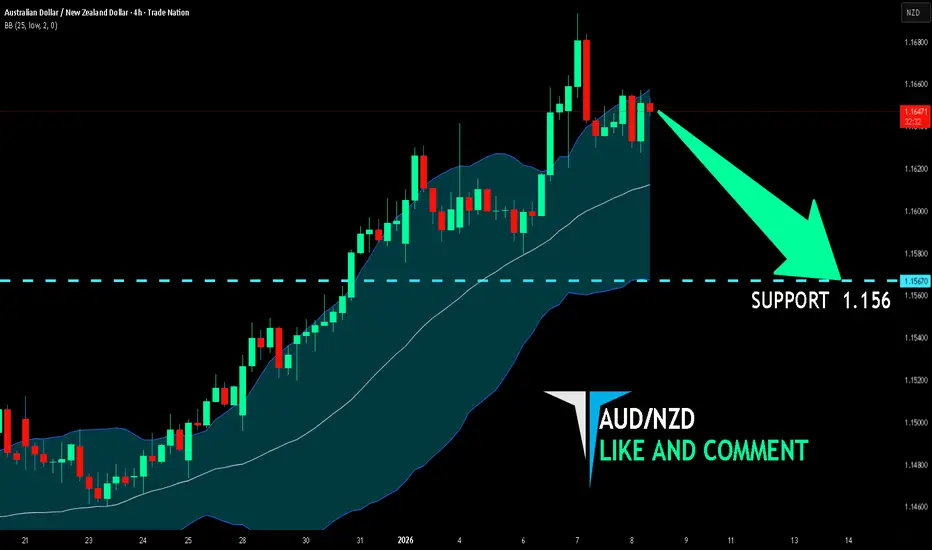
AUD/NZD SELLERS WILL DOMINATE THE MARKET|SHORT
Hello, Friends!
The BB upper band is nearby so AUD-NZD is in the overbought territory. Thus, despite the uptrend on the 1W timeframe I think that we will see a bearish reaction from the resistance line above and a move down towards the target at around 1.156.
Disclosure: I am part of Trade Nation's Influencer program and receive a monthly fee for using their TradingView charts in my analysis.
✅LIKE AND COMMENT MY IDEAS✅
GBP/NZD BEST PLACE TO SELL FROM|SHORT
Hello, Friends!
Bearish trend on GBP/NZD, defined by the red colour of the last week candle combined with the fact the pair is overbought based on the BB upper band proximity, makes me expect a bearish rebound from the resistance line above and a retest of the local target below at 2.327.
Disclosure: I am part of Trade Nation's Influencer program and receive a monthly fee for using their TradingView charts in my analysis.
✅LIKE AND COMMENT MY IDEAS✅

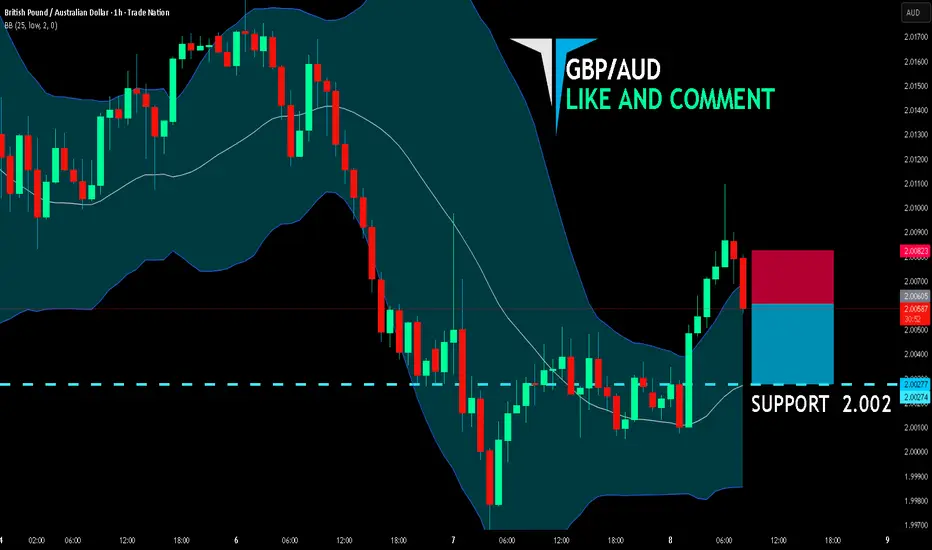
GBP/AUD BEARS ARE STRONG HERE|SHORT
GBP/AUD SIGNAL
Trade Direction: short
Entry Level: 2.006
Target Level: 2.002
Stop Loss: 2.008
RISK PROFILE
Risk level: medium
Suggested risk: 1%
Timeframe: 1h
Disclosure: I am part of Trade Nation's Influencer program and receive a monthly fee for using their TradingView charts in my analysis.
✅LIKE AND COMMENT MY IDEAS✅
NZD/USD SELLERS WILL DOMINATE THE MARKET|SHORT
Hello, Friends!
NZD/USD pair is trading in a local downtrend which know by looking at the previous 1W candle which is red. On the 4H timeframe the pair is going up. The pair is overbought because the price is close to the upper band of the BB indicator. So we are looking to sell the pair with the upper BB line acting as resistance. The next target is 0.576 area.
Disclosure: I am part of Trade Nation's Influencer program and receive a monthly fee for using their TradingView charts in my analysis.
✅LIKE AND COMMENT MY IDEAS✅

USOIL LONG FROM SUPPORT
Hello, Friends!
USOIL is trending up which is obvious from the green colour of the previous weekly candle. However, the price has locally plunged into the oversold territory. Which can be told from its proximity to the BB lower band. Which presents a great trend following opportunity for a long trade from the support line below towards the supply level of 58.46.
Disclosure: I am part of Trade Nation's Influencer program and receive a monthly fee for using their TradingView charts in my analysis.
✅LIKE AND COMMENT MY IDEAS✅

EUR/CHF BEARS WILL DOMINATE THE MARKET|SHORT
EUR/CHF SIGNAL
Trade Direction: short
Entry Level: 0.9302
Target Level: 0.9294
Stop Loss: 0.9308
RISK PROFILE
Risk level: medium
Suggested risk: 1%
Timeframe: 1h
Disclosure: I am part of Trade Nation's Influencer program and receive a monthly fee for using their TradingView charts in my analysis.
✅LIKE AND COMMENT MY IDEAS✅

USOIL SENDS CLEAR BEARISH SIGNALS|SHORT
Hello, Friends!
USOIL pair is trading in a local downtrend which know by looking at the previous 1W candle which is red. On the 4H timeframe the pair is going up. The pair is overbought because the price is close to the upper band of the BB indicator. So we are looking to sell the pair with the upper BB line acting as resistance. The next target is 56.52 area.
Disclosure: I am part of Trade Nation's Influencer program and receive a monthly fee for using their TradingView charts in my analysis.
✅LIKE AND COMMENT MY IDEAS✅

USD/CHF BEARS ARE GAINING STRENGTH|SHORT
USD/CHF SIGNAL
Trade Direction: short
Entry Level: 0.796
Target Level: 0.794
Stop Loss: 0.798
RISK PROFILE
Risk level: medium
Suggested risk: 1%
Timeframe: 1h
Disclosure: I am part of Trade Nation's Influencer program and receive a monthly fee for using their TradingView charts in my analysis.
✅LIKE AND COMMENT MY IDEAS✅

XAUUSD H2 – Trading Around Key LiquidityVolume Profile Trading While DXY Stays Soft Ahead of US Data
Gold is moving in a classic liquidity-driven manner: price is reacting around VAL/POC, and the next expansion is likely to occur only after key liquidity zones are tested.
TECHNICAL CONTEXT FROM THE CHART
After a strong rebound, price is consolidating above the main Volume Profile value cluster.
Current structure favours a pullback into buy zones before the market decides whether to continue higher or distribute.
The chart clearly defines the battlefield: sell liquidity above and buy liquidity below.
PRIORITY SCENARIO – MAIN PLAN
Buy from value zones using Volume Profile
Buy VAL: 4420 – 4422
Value Low area where demand often absorbs sell pressure during a technical pullback.
Buy POC: 4442 – 4445
The Point of Control is the highest-volume zone and typically delivers strong reactions on retests.
Expected flow:
A controlled dip into VAL/POC → bullish defence and absorption → rotation back into balance and potential continuation higher.
ALTERNATIVE SCENARIO – SHORT-TERM SELL ONLY
Sell is preferred only as a scalp at premium liquidity
Sell Liquidity: 4525 – 4527
Upper liquidity zone where price may show rejection and trigger a short-term pullback.
Note:
This is a reaction-based scalp, not a long-term bearish reversal view.
STRONG LIQUIDITY LEVEL TO MONITOR
Strong liquidity: around 4396
If price breaks below VAL and extends lower, this is a key area where a sweep-and-reversal can occur. It also helps define whether the move is a deeper shakeout or a more structural breakdown.
FUNDAMENTAL BACKDROP SUPPORTING GOLD
The US Dollar Index (DXY) remains weak near 98.50 as traders stay risk-on and position ahead of major US releases.
Key releases to watch: US ADP Employment Change and ISM Services PMI, both capable of reshaping near-term Fed expectations.
The safe-haven USD has struggled as markets temporarily look past rising geopolitical tensions following US involvement in Venezuela, keeping gold supported.
SUMMARY VIEW
Focus on buys at 4442–4445 and 4420–4422 using Volume Profile
Consider sell scalps at 4525–4527 only on clear rejection
Expect volatility/spikes around ADP + ISM Services PMI, as liquidity sweeps are common before direction is confirmed
