Techmahindra
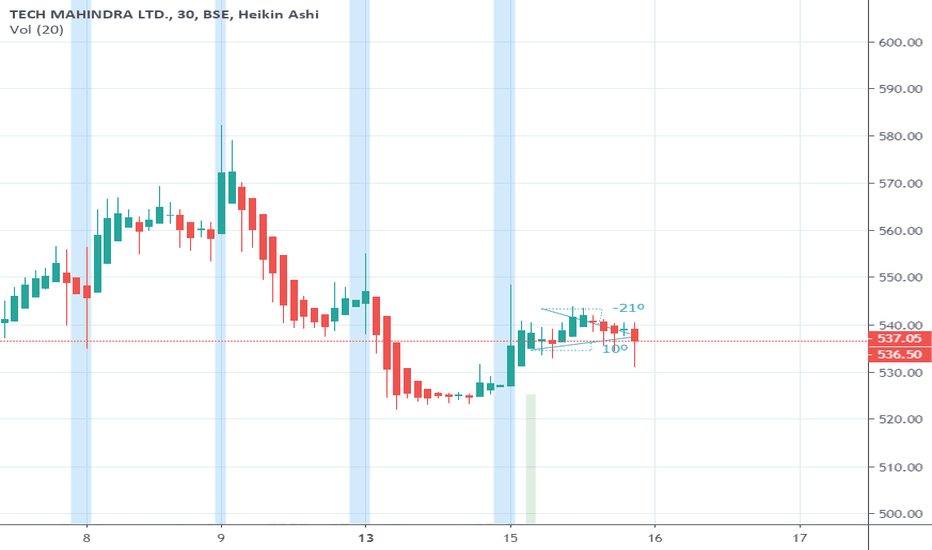
R-0090 A flag pattern breakout in Tech MahindraPrice broke out of a major resistance on July 13 and then the price was stuck in a trading range for the last several days. Price is in a steady uptrend as we see a well-defined sequence of higher high and higher lows. Price saw a range expansion candle which is an outside day and a good quality trend continuation signal. The breakout from consolidation can be considered as a flag breakout pattern. IT as a sector has seen a very good run in recent times. Buy Tech Mahindra around Rs 630 and CMP for a rally to Rs 670 and above that to Rs 700. Keep a stop below Rs 605.
TK cross over + Above VWAP + MACD cross over => indicates bullish trend
TECHM Intraday for 6th Apr 2020Mostly downtrend....Do not go long..
Short below 520.5, tgt 1- 510, tgt 2 - 491...
If price opens below 512, short @ 510 , tgt 491
No long until price reaches above 540, tgt till 580...or follow pivot points....
If price opens gap down and reaches around 490 levels, go long with tgt as pivot points till 520 max...
Tech Mahindra (NSE): Correction in uptrendThe long-term trend is completely intact and unchallenged. However, on the near term the outlook is a bit tiresome; bearish divergence and the lack of significant new highs suggests buyers are exhausted and a correction is around the corner. Tighten stops on existing longs or cover all together. New buying can be done if/once a deeper correction has occurred and prices set a new higher base. The area around 550<>570 would be ideal for such a base.
Primary trend: positive
Outlook: correction in uptrend, moderately negative
Strategy: cover/protect longs and re-enter after correction
Support: 571.70 / 537.50 / 506.10
Resistance: 532.10 / 665
Outlook cancelled/neutralized: n/a
NSE:TECHM
Tech Mahindra can see lower levelsNSE:TECHM ...Tech Mahindra Is under pressure due to BREXIT and Relative weakness in IT sector. Though the Quarterly results were fairly in line with analysts expectations, Sector weakness and BREXIT could lead TechM to lower levels.
Technically TEchM is in Multitimeframe bearish trend. I expect levels of 450 over next few months before any significant support can come in. 510 levels can acts as a stoploss as well as resistance.


