GOLD MARKET – MARKET STRUCTURE in M30 GOLD MARKET – MARKET STRUCTURE (M30)
SELL Zone: 4510 – 4515
TP: 4480 – 4435
SL: 4525
• This is an HTF Supply zone – a supply area on the H1 timeframe where strong selling pressure has previously occurred.
• Suitable for selling based on larger timeframes, prioritizing tight volume management.
• Wait for a clear confirmation signal; avoid blind selling while the price is still rising sharply.
BUY Zone: 4435 – 4440
TP: 4470 – 4505
SL: 4425
• This is intraday demand within a M30 uptrend structure.
• Price is maintaining a higher high – higher low pattern; a pullback to demand is normal in a trend.
• Expect buying pressure to return to this area if a ChoCH/BOS pattern appears on M5–M15.
• Prioritize buy orders with confirmation; avoid entering trades when prices fall sharply and uncontrollably.
➤ Current Market Structure
On the M30 timeframe, the current structure continues to print higher highs and higher lows. However, price is now moving into a sensitive decision area with no clear breakout confirmation yet. The M30 bias remains bullish, but price is currently at a critical decision zone.
➤ HTF Supply (Higher-Timeframe Supply)
4,505 – 4,520
➤ Reaction Zone (Decision Zone)
4,455 – 4,485
This is the area where price is currently trading and acts as a balance zone between supply and demand. Multiple short-term reversals have occurred here, highlighting strong buyer–seller indecision.
• A clean hold and breakout above this zone increases the probability of continuation toward the HTF Supply.
• A clear rejection from this zone increases the likelihood of price rotating back to test lower demand.
➤ Intraday Demand (Short-Term Support)
4,435 – 4,450
This is a short-term demand area where price may pull back within the current bullish move. The zone is suitable for buy-on-pullback setups. If this area is broken, short-term bullish momentum will weaken.
➤ HTF Demand (Higher-Timeframe Support)
4,325 – 4,340
This is a higher-timeframe demand zone and the foundation of the current recovery move. If price returns to this area and buyers fail to defend it, the bullish M30 structure will be invalidated, and the market may shift back to a bearish phase.
➤ Market Scenarios
• Primary scenario: Price holds above Intraday Demand → continues consolidating within the Reaction Zone → breaks out toward HTF Supply.
• Alternative scenario: Price is rejected from the Reaction Zone → breaks below Intraday Demand → deeper correction toward HTF Demand.
Technical

Climbing the Channel — ATH Is the MagnetOANDA:XAUUSD continues to trade inside a well-defined ascending channel, with price respecting both channel support and structure of higher highs – higher lows. Pullbacks remain shallow and are consistently absorbed, signaling sustained bullish control rather than exhaustion.
Momentum remains constructive as price holds mid-channel, keeping the focus on continuation toward the previous all-time high (OLD ATH) rather than a structural reversal.
Key Levels
Resistance: 4,525 → 4,550 (OLD ATH)
Support: 4,460 – 4,470 (channel support)
Structure invalidation: below 4,440
➡️ Primary: hold above 4,460 → grind higher → test 4,525, then OLD ATH.
⚠️ Risk: loss of channel support → deeper pullback toward 4,440 before trend reassessment.

The Euro’s Bullish Blueprint: Identifying the Breakout TriggerHello everyone,
On the H1 timeframe, the key focus right now is not the minor fluctuations around the EMA 50, but how EURUSD is positioning itself within a tight consolidation range between a proven support base and a looming resistance ceiling.
Structurally, the market has transitioned from a sharp impulsive drop into a steady recovery phase, characterized by the formation of higher lows. Price is currently grappling with the EMA 50 and the lower boundary of the 1.1750–1.1760 resistance zone. This area represents a significant hurdle; a successful breach here would signal that the corrective phase is over and that buyers have successfully reclaimed the mid-term momentum.
Following the recent bounce from the 1.1710–1.1720 support zone, EURUSD is showing signs of accumulation. This support area is technically critical as it represents a "demand pocket" where buyers have previously intervened to halt deeper declines. The current price action suggests that the market is gathering liquidity for a potential push higher, rather than preparing for a breakdown.
From a price action perspective, we are seeing a "squeeze" against the resistance. As long as the higher-low structure remains intact, the bias leans toward an upside resolution. The move appears to be a preparation for a trend continuation toward the higher targets identified on the chart, provided the resistance zone is flipped into support.
The projected path on the chart reflects this logic:
- A decisive break above the 1.1760 Resistance Zone to reach Target 1.
- A technical pullback to retest the breached zone, confirming it as new support.
- A secondary rally toward Target 2 (1.1779) and eventually Target 3 (1.1807).
Only a clean breakdown and acceptance below the 1.1710 support zone would invalidate this recovery scenario and shift the focus back to the bearish lows. Conversely, a daily close above the current resistance zone would be the definitive signal that a larger bullish cycle has commenced.
Until the breakout is confirmed, EURUSD remains in a "wait-and see" compression. Patience around these key levels is essential to avoid being caught in a fake-out.
Wishing you all effective and disciplined trading.

ETH Inside the Ascending Channel — Is a $3,400 Breakout ImminentEthereum is currently exhibiting a strong bullish recovery, trading within a well-defined ascending channel after successfully rebounding from its early 2026 lows near $2,970. The market structure is constructive, with price action respecting the channel boundaries and carving out a series of higher lows. Following a five-session rally across major assets, ETH is now consolidating near the $3,220 mark, showing resilience as it absorbs selling pressure at this local peak.
The narrative is shifting toward a potential "breakout" phase. On the H1 chart, the blue projection highlights a textbook "W-shaped" accumulation within the channel, suggesting that after a brief test of the lower boundary, momentum is likely to accelerate. The technical backdrop is further bolstered by a "triple-bottom" formation with a key neckline at $3,475, indicating that the current move is likely the start of a broader impulsive leg.
Technical alignment is healthy, as the price is trading above the EMA 50 ($3,183). This moving average is acting as a dynamic floor, converging with the lower trendline of the channel to create a high-probability demand zone for dip-buyers.
Key Levels
Resistance: 3,280 – 3,320 (Channel Upper Boundary) | 3,396 – 3,475 (Major Supply Wall)
Support: 3,210 – 3,230 (Channel Floor / Pivot) | 3,184 (EMA 50 dynamic support)
Deep Support: 3,010 (Start of 2026 Lows)
Trading Scenarios
➡️ Primary: Minor consolidation or a shallow pullback to test the $3,200 – $3,230 support zone → successful defense of the EMA 50 → a volatile breakout above the channel toward the $3,396 liquidity target.
⚠️ Risk: A failure to maintain the channel floor followed by a sharp hourly close below $3,183 (EMA 50) would signal exhaustion, likely triggering a deeper correction toward the $3,010 psychological level before any fresh accumulation begins.

BTC Hits a Wall: Is a $90k Liquidity Grab Next?COINBASE:BTCUSD is currently testing the upper limits of its recent relief rally, which saw a ~17% recovery from its late-2025 local bottom of $80,600. After a strong five-day streak of gains to start January 2026, momentum is showing signs of exhaustion as price encounters a dense supply wall in the $93,600 – $94,500 range. The market structure on the H1 timeframe reveals a series of failed attempts to break the local high, suggesting a transition from an impulsive phase to a distribution or corrective phase.
The technical alignment remains precarious. While the broader sentiment has improved due to slowing ETF outflows and new institutional positioning for the year, the short-term price action is struggling to maintain its footing above the psychological $93,000 level. The price is currently hovering near the EMA 50, which is the immediate dynamic support. A failure here would likely confirm the bearish projection indicated by the current rejection from resistance.
Key Levels
Resistance: 93,696 – 94,563 (Local High & Supply Zone)
Support: 90,690 – 90,979 (Major Support Zone)
Mid-Level Pivot: ~92,222
EMA 50 Support: ~92,737
Trading Scenarios
➡️ Primary: Rejection at the $93,339 resistance level → downward move to test the $92,222 pivot → eventual deeper correction into the $90,690 – $90,979 Support Zone to gather fresh liquidity.
⚠️ Risk: A decisive breakout and acceptance above $94,563 would invalidate the corrective outlook, potentially triggering a "short squeeze" toward the $97,000 – $100,000 targets.

At Trendline Resistance — Pullback Before the Next Leg?BITSTAMP:BTCUSD is pressing into the descending trendline resistance after a strong impulsive rally. Momentum remains constructive, but price is now at a reaction area, where profit-taking and pullbacks are likely. The broader structure still favors continuation as long as higher lows are maintained.
The EMA cluster is rising and aligning with a strong demand zone, supporting a dip-buying framework rather than immediate reversal.
Resistance: 93,200 – 93,800 (trendline)
Support: 89,200 – 89,800 (strong demand)
EMA support: ~90,600
➡️ Primary: rejection at trendline → pullback into 89.2k–89.8k → higher low → continuation higher.
⚠️ Risk: clean breakout and acceptance above trendline opens extension toward new highs without a deep pullback.

Decision Point — Bounce or Breakdown?EURUSD is trading at a key decision area after a sustained decline from the upper range. Price is now approaching the mid-range support, with momentum slowing, suggesting the market is preparing for either a reaction bounce or continuation lower.
The broader structure remains range-bound, with price capped below the 1.1800–1.1810 resistance zone and buyers historically stepping in near the lower boundary.
Resistance: 1.1800 – 1.1810
Support: 1.1700 – 1.1710
Decision zone: 1.1730 – 1.1740
➡️ Primary: hold above 1.1700 → corrective bounce → rotation back toward 1.1760–1.1780.
⚠️ Risk: clean break below 1.1700 → continuation toward the lower support zone before stabilization.

BTC $94.5K Fatigue: Decoding the $92.3K Line in the SandBitcoin (BTC/USD) Technical Breakdown
Bitcoin recently completed a steep impulsive move, encountering significant selling pressure at the Resistance Zone ($94,400 – $94,600). The appearance of long upper wicks (rejection candles) at this level confirms that profit-taking is underway, pushing price back to test internal liquidity.
The pair is currently trading near the blue EMA, which serves as immediate dynamic support. However, the short-term bias remains tilted toward a deeper "healthy pullback" to re-accumulate buy orders. The Support Zone around $92,300 is the critical "pivot area" where institutional demand is expected to resurface.
Key technical scenarios:
- Base-case scenario: Following the projected path on the chart, BTC is likely to continue its retracement toward the $92,300 support. A bullish reversal signature (such as a pin bar or engulfing pattern) at this level would confirm a Higher Low (HL) and set the stage for a recovery test of $93,300 and beyond.
- Bullish continuation: Should the bulls defend the $92,900 level and decisively reclaim $93,500, the correction may end prematurely, opening the door for an immediate retest of the $94,500 supply zone.
- Bearish risk: A decisive close below the $92,000 psychological level would invalidate the immediate bullish structure. This would expose BTC to a deeper correction toward $91,000 or the $90,000 liquidity pool.
Macro Drivers Impacting Bitcoin
As of January 2026, Bitcoin's price action is heavily influenced by institutional flows and global macro shifts:
- ETF Inflows & Institutional Floor: The maturity of Spot ETFs has created a persistent "floor" for price. Current volatility is likely driven by early-year portfolio rebalancing by major asset managers.
- Monetary Policy & Fed Outlook: Market participants are closely monitoring Fed signals. Expectations of quantitative easing or rate pauses in Q2 2026 continue to support the long-term "debasement trade" narrative, favoring BTC.
- Geopolitical Risk Premium: Ongoing tensions in key global regions (Middle East/Eastern Europe) reinforce Bitcoin’s status as "Digital Gold." Safe-haven flows tend to limit the downside during macro uncertainty.
- Risk-On vs. Risk-Off Sentiment: The Fear & Greed Index remains in "Greed" territory. While the trend is bullish, this high sentiment often precedes "liquidity sweeps" where over-leveraged long positions are flushed out at key support levels.
Summary
Technically, Bitcoin is undergoing a textbook correction after hitting a major resistance ceiling. This phase is essential for market health, allowing for the rotation of capital and the removal of weak-handed leverage.
The $92,300 support is the line in the sand. As long as price holds above this zone, the broader bullish trend remains intact. Traders should remain disciplined, waiting for confirmed price rejection at support rather than chasing the move mid-range.

Gold Bulls Eye the Horizon: Old ATH is the Next DestinationXAUUSD H1 – Market Analysis
1. Current Market Structure
Gold continues to exhibit a powerful bullish structure on the H1 timeframe.
The price action is characterized by a series of aggressive impulsive moves followed by shallow consolidations, maintaining the higher high – higher low sequence.
Currently, the market is holding steady above a freshly established support base, indicating that the uptrend is healthy and not overextended.
2. Key Zones & Market Positioning
Main Support Zone: 4430 – 4437
-> This is the primary demand area where buyers successfully absorbed selling pressure.
Current Trading Range: 4437 – 4499
Resistance / Target Zones:
Resistance Zone: 4499 – 4510 (The final hurdle before the open sky).
Target 2: ~4499.
Target 3: ~4524.
Final Target: 4549 (Old ATH).
The bullish roadmap remains intact as long as the 4430 support level is defended.
3. Liquidity & Price Behavior
The upward slope of the EMAs provides a clear trend filter, acting as dynamic support for every minor dip.
Long lower wicks at the 4437 level confirm that sell-side liquidity is being aggressively harvested by institutional buyers.
Price is currently tightening its range, a classic sign of energy accumulation before a breakout attempt toward the upper resistance levels.
4. Today’s Market Scenario
🔼 Primary Scenario – Bullish Continuation
Expected flow: Price continues to consolidate above the 4437 zone to build momentum.
A decisive breach of the 4499 – 4510 resistance will likely lead to a rapid expansion toward Target 3 (4524) and the ultimate retest of the Old ATH at 4549.
🔽 Invalidation Scenario
A breakdown and sustained close below 4430 would invalidate the immediate bullish thesis, potentially leading to a deeper corrective phase toward 4408.
5. Trading Perspective
Bias: Strongly Bullish – Buy the pullback.
Strategy: Focus on long entries near the 4430 – 4437 support zone.
Avoid chasing the price as it approaches the 4500 psychological level; instead, wait for price action confirmation (rejection of the dip) to enter with a superior risk/reward ratio.
Summary
Gold is in a clear "Buy the Dip" regime.
The 4430 – 4437 zone is the foundation for the next leg up.
As long as this floor holds, the path of least resistance is toward 4549.
Roadmap: Consolidation → Support Hold → Expansion to ATH.

USD/JPY(20260107)Today's AnalysisMarket News:
① Venezuela and the United States are negotiating on oil exports to the US.
② In the early years of Maduro's rule, Venezuela shipped $5.2 billion worth of gold to Switzerland.
③ Shipping data shows that in the past five days, Venezuela's main oil terminals have not shipped crude oil for export to any destination other than Chevron in the United States.
Technical Analysis:
Today's Buy/Sell Threshold:
156.52
Support and Resistance Levels:
157.15
156.91
156.76
156.28
156.13
155.89
Trading Strategy:
If the price breaks above 156.76, consider buying, with a first target price of 156.91.
If the price breaks below 156.52, consider selling, with a first target price of 156.28.

ETH Is Consolidating — Continuation Still Favored.Price remains in a bullish structure after a strong impulsive leg up. Recent candles show range-bound consolidation above support, not a breakdown.
Price Behavior / Momentum
Pullbacks are contained and shallow, with buyers defending the support zone. No aggressive rejection from highs → momentum is cooling, not reversing.
Key Levels
Resistance / Target: 3,260 → 3,310
Support Zone: 3,190 – 3,200
Invalidation: Below 3,180
Scenarios
➡️ Primary: Holding above the support zone opens continuation toward 3,260, then 3,310.
⚠️ Risk: A clean break below 3,180 would signal deeper correction and delay the bullish scenario.
Conclusion
Bias remains bullish, as long as price holds above the support zone.

Market Analysis & Reaffirmation of Trading PlanMarket Analysis & Reaffirmation of Trading Plan
- Today's market is moving exactly as planned yesterday. After a consolidation phase and absorption of liquidity around the 4.38x – 4.40x range, the price has clearly broken out, confirming the return of large capital flows. The market structure on the H4 timeframe has shifted to a higher high – higher low, indicating that the uptrend has been established and is being maintained.
- The price holding above the breakout zone not only reinforces the trend but also proves that following the structure was the correct choice. The current corrections are merely technical, serving to create more liquidity for the market to continue expanding its range.
Message to the community:
- The market is not random. When you correctly read the structure, identify the correct price zone, and patiently wait for confirmation, the advantage will automatically be on your side.
- A correct plan doesn't need fanfare The results are the clearest evidence of a leader's position.
TODAY'S LIMITED STRATEGY JAN 6
Intraday trading: Increase
📌 SET UP 1. Timming Sell Zone
XAUUSD SELL ZONE: 4517 - 4520
💰 Take Profit(TP): 4514 - 4509
❎ Stoploss(SL): 4524
Note capital management to ensure account safety
📌 SET UP 2. Timming Buy Zone
XAUUSD BUY ZONE: 4394 - 4397
💰 Take Profit(TP): 4400 - 4405
❎ Stoploss(SL): 4390
Note capital management to ensure account safety

SHOCKING ETHUSD Update: The 3,200 Level is a Powder KegHello traders! Here’s a clear technical breakdown of ETHUSD (1H) based on the current chart structure.
Market Structure: Ethereum has been in a sustained bullish trend, characterized by aggressive impulse moves followed by shallow consolidations. Price action is consistently making higher highs and higher lows, supported by a steep rising trendline.
Price Action and Support: After the most recent vertical expansion, the market has entered a consolidation phase. Price is currently hovering just above a newly established Support Zone around the 3,200 level. This zone is critical as it aligns with the previous breakout structure and is being reinforced by the blue EMA, which is acting as dynamic support.
Key Levels: The immediate floor is the Support Zone between 3,200 and 3,210. On the upside, the recent local high serves as the first resistance target, with the psychological level of 3,300 being the broader objective if the trend continues.
My Scenario: As long as ETHUSD remains above the 3,200 Support Zone, the bullish bias is firmly intact. I expect a period of sideways accumulation here before another leg higher to test new local highs. However, a decisive break and close below this support would suggest a deeper correction toward the secondary trendline or the red EMA.
Manage your risk!

Bitcoin Is Not Overextended — This Is a Structured Trend Hello everyone,
On the H1 timeframe, Bitcoin remains in a clean, well-respected bullish trend, and the current price action continues to validate trend continuation rather than exhaustion.
Market Structure Breakdown
The chart shows a clear ascending structure, defined by:
Higher highs and higher lows
Price consistently respecting the ascending trendline
Each pullback forming a rounded corrective base, followed by impulsive expansion
Every highlighted orange circle marks a successful reaction at trend resistance, which was later converted into support. This is a textbook example of break → accept → continue, not rejection.
Key Technical Observations
The impulsive leg from ~91,000 to above 92,800 was followed by tight consolidation, not aggressive selling.
Current candles are holding above the prior breakout level (~92,300), confirming acceptance, not a fake move.
Pullbacks remain shallow and overlapping, indicating buyers are in control and sellers lack follow-through.
Scenario Logic
The projected path is structurally sound:
Hold above 92,300 → continuation remains valid
Minor consolidation / flagging → fuel for expansion
Upside continuation toward 93,900, then 94,400+
Importantly, there is no distribution signature:
No sharp rejection from highs
No aggressive bearish displacement
No loss of trendline structure
Invalidation Conditions
This bullish continuation thesis only weakens if:
Price loses 92,300 with acceptance
Followed by a breakdown below 91,800, which would indicate a deeper corrective phase
Until then, any pullback is structural, not directional.
Conclusion
Bitcoin is not “too high” — it is doing exactly what a strong trend should do:
Break levels
Pause briefly
Continue higher
As long as price remains above the reclaimed supports and respects the rising structure, the path of least resistance remains upward.
Trade safe and stay disciplined.

Gold Nears $4,440 — Is This a Real Breakout or ........
OANDA:XAUUSD has extended its rebound aggressively, pushing into the $4,430–$4,440 area after a sharp recovery from the prior sell-off. The speed of the bounce is notable, but price is now approaching a technically sensitive zone where upside momentum historically begins to stall. At this stage, the market is no longer trading in “easy trend” conditions; instead, it is transitioning into a decision area where positioning matters more than direction.
Key Resistance and Price Reaction
The $4,400–$4,440 region is acting as a clear resistance band. This level previously served as a breakdown point and is now being retested from below — a classic role-reversal zone. The most recent candles show reduced follow-through and early signs of hesitation, suggesting that buy-side momentum is slowing as price runs into resting supply. Without a clean impulsive break and acceptance above this level, upside continuation remains questionable.
Gap Structure and Mean-Reversion Risk
Below current price lies a clearly defined inefficiency (GAP) zone, created by the impulsive upside move. Markets rarely leave such gaps unresolved, especially when they form after emotional rebounds. From a structural perspective, this gap represents unfinished business — an area where price may return to rebalance liquidity before choosing a sustained directional move. The highlighted “fill gap” area aligns well with prior consolidation, increasing its technical relevance.
Support Zone and Downside Scenarios
The broader support zone around $4,300 remains the key downside magnet. If price fails to hold above $4,400 and begins to roll over, a controlled pullback toward the gap is the first logical scenario. A deeper retracement into the $4,300 support zone would still be considered corrective rather than trend-breaking, as long as buyers defend that area with structure and volume.
Trend Structure Assessment
Despite the short-term pullback risk, the higher-timeframe structure remains constructive. Higher lows are still intact, and price continues to trade above major dynamic supports. However, from a professional trading perspective, this is no longer a location to chase longs. Risk-to-reward now favors patience — either waiting for confirmation above resistance or looking for reactions at lower, more favorable levels.
Technical Conclusion
Gold is currently at a crossroads. A clean breakout and acceptance above $4,440 would invalidate the gap-reversion thesis and open the door for continuation higher. Conversely, failure at this level increases the probability of a corrective move toward the gap and potentially the $4,300 support zone. Until one of these scenarios confirms, gold remains in a high-risk, low-conviction zone where discipline matters more than bias.

the Fed faces another slew of challenges in the year aheadThe Federal Reserve heads into 2026 facing a slew of political and policy challenges, headlined by a new chair and an economy fed by both tailwinds and headwinds that will make policymakers’ choices all the more important.
Coming off three consecutive interest rate cuts, the central bank is expected to follow a more tepid path for the year ahead in which additional cuts could be hard to come by considering expectations for solid growth and ongoing inflation pressures.
One thing does seem certain: After a year of extraordinary upheaval surrounding the Fed, 2026 looks to offer more of the same.
“I do think there’ll be a big spotlight. There’ll be lots of intrigue,” said Kathy Bostjancic, chief economist at Nationwide. “There’s still a lot of uncertainty that keeps the Fed in the spotlight, and probably in the hot seat too.”
The previous year saw the Fed come under that spotlight in ways that it never had before.
As he started his second term at the White House, President Donald Trump repeatedly threatened to fire Fed Chair Jerome Powell for not being quicker to push for interest rate cuts. Around mid-year, the Fed came under fire again, this time for cost overruns at a renovation project it had undertaken at its Washington headquarters.
In between, Trump tried to remove Governor Lisa Cook over allegations — as yet unproven and not even brought as formal charges — that she committed mortgage fraud. That all came against a backdrop of who would succeed Powell as chair when his term expires in May, with as many as 11 candidates considered during an interview process led by Treasury Secretary Scott Bessent.
If all that sounds exhausting, consider that 2026 begins with a Supreme Court hearing scheduled for Jan. 21 to decide whether Trump has the authority to remove Cook. A week later, the Federal Open Market Committee holds its interest rate vote. At some point during the month, Trump is expected to unveil his choice for Fed chair. And Powell, cagey on the issue so far, also will have to disclose whether he plans on serving out his term on the Board of Governors that runs until January 2028.
There also have been multiple dissents at recent rate votes, and new regional presidents set to come on board at the FOMC have a hawkish bent, meaning they’re likely to resist additional cuts.
“It’s still a tough spot for the Fed,” Bostjancic said.
Focus on policy
Still, when it comes to policy, most on Wall Street expect the Fed to put the noise in the background and continue down the road of lowering its benchmark interest rate just a bit more until it gets closer to a neutral level around 3%. Neutral is considered a spot that neither boosts nor holds back economic activity, and the funds rate is just half a percentage point above where most on the FOMC see the rate landing over the long term.
“Chair Powell helped orchestrate three 25-basis-point rate cuts in a row. It’s not as if he was standing in the way of the FOMC cutting rates,” Bostjancic said. As far as further cuts go, “For us, it’s the economic data.”
Bostjancic sees the data pointing to two cuts this year, one around mid-year and another toward the end. The Fed’s “dot plot” grid of expectations indicates just one cut, while outliers such as Moody’s Analytics chief economist Mark Zandi and Citigroup seeing labor market weakness pointing to three.
Powell and his colleagues have stood by the notion that they won’t be bullied into cuts and indeed will be guided by data.
Torsten Slok, chief economist at Apollo Global Management, thinks the economy will be too strong for the Fed to cut much more, seeing just one reduction ahead.
“The issue is that the winds are really changing for the U.S. economy,” Slok said during a CNBC interview Friday.
Whereas 2025 saw headwinds of tariffs, inflation and a general air of uncertainty, fiscal stimulus and a stabilizing labor market will be pushing on growth, he said.
“It is, in my view, looking like more that the tailwinds are beginning to accumulate and making it more difficult for the Fed to cut rates this year,” Slok added.
The role of AI
One wildcard will be the role that artificial intelligence plays on economic growth.
Seen as both a productivity enhancer and a potential impediment to hiring, assessing the impact AI is having on the economy will be paramount for the Fed, said Joseph Brusuelas, chief economist at RSM.
“The Fed this year has got a real challenge in terms of communicating their strategy,” Brusuelas said. “We have this massive investment flowing into very sophisticated technologies, and the Federal Reserve is going to need to communicate their basic view on what this means.”
After sputtering at the beginning of 2026, the economy grew rapidly in the middle two quarters and is on pace to accelerate at a 3% pace in the fourth quarter, according to preliminary data from the Atlanta Fed.
In addition to helping push along the broader economy, AI-related stocks were a key highlight of another stellar year on Wall Street that saw major averages post double-digit increases.
Calibrating monetary policy in that kind of environment will be tough, Brusuelas said.
“They’re going to need to provide strategic direction for the central bank at a time when the economy is clearly pivoting towards the integration of this sophisticated technology in the production of goods and provision of services,” he said. “This is a really big potential pivot around policy that needs to happen.”

Ethereum Is Pressing the Ceiling — Breakout or Final Rejection Hello everyone,
On the H1 timeframe, the key focus right now is not chasing upside, but evaluating how Ethereum is behaving at a critical resistance cluster after a well-structured recovery. Price has already done the hard work on the downside; the market is now at a decision point.
After the sharp sell-off into the 2,900–2,920 support zone, ETH formed a clean base and transitioned into a step-by-step recovery, printing higher lows and reclaiming multiple intraday levels. The advance has been orderly and controlled, not impulsive — a sign that buyers are rebuilding positions rather than FOMO buying.
Structurally, price has now pushed into the 3,020–3,035 resistance zone, which has historically capped upside. The current candles are reacting directly at this level, confirming it as active supply, not a level the market can ignore. This is exactly where we expect hesitation, consolidation, or a rejection attempt.
From a price action perspective, two valid scenarios are visible directly on the chart:
- Primary scenario: a shallow pullback toward the 3,000–3,010 area to retest demand, followed by another push higher. Acceptance above 3,035–3,050 would confirm a breakout and open the door toward 3,070–3,100.
- Alternative scenario: failure to hold above reclaimed levels, leading to a deeper pullback toward 2,970–2,990, where buyers would need to step in again to keep the bullish structure intact.
Importantly, there is no distribution pattern yet. Pullbacks remain corrective, candles overlap constructively, and price continues to hold above prior breakout levels. That keeps the bias constructive, but not confirmed.
In short, Ethereum is not late, and it is not guaranteed. It is compressing at resistance, and the next few H1 closes will determine whether this move resolves into acceptance and expansion, or a final rejection and reset.
Wishing you all effective and disciplined trading.

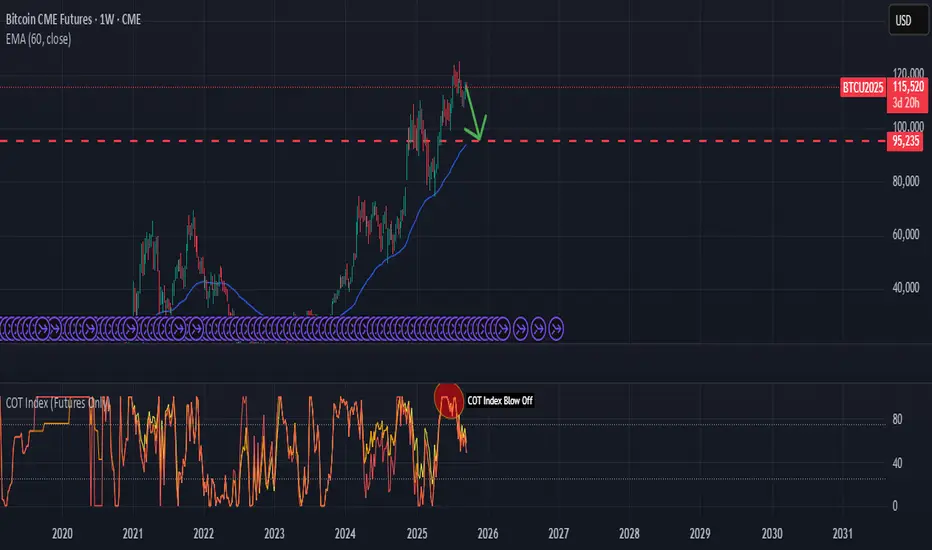
Bitcoin Blow-Off TopBitcoin is showing signs of exhaustion after a strong rally into the $120k region. On the weekly timeframe, several signals point toward a potential corrective leg lower:
📊 Key Technicals
Major Supply Zone: $115k–$120k area has acted as resistance, with sellers defending this level.
Trend Structure: Price has broken momentum after the blow-off move and is now trading below recent highs.
EMA Support: Price is extended above the EMA 60 (94k), leaving room for mean reversion.
COT Data: Commercials are heavily net short with a COT Index blow-off signal, indicating distribution from strong hands to weak hands.
🎯 Trade Thesis
The risk-reward favors the short side from current levels.
Initial downside target sits at the $95k region (prior resistance turned support + EMA alignment).
A break of that level could open the door toward the $80k handle in the medium term.
📌 Plan
Entry: 114k–116k
Stop: Above 120k
Targets:
TP1: 95k
TP2: 80k
💡 This setup combines market structure, supply zone rejection, and institutional positioning via COT. The technical picture suggests Bitcoin is vulnerable to a deeper pullback before any further sustainable rally.
Ethereum Is Not Ready to Rally — This Is a DistributionHello everyone,
On the H1 timeframe, the key focus right now is not upside continuation, but the fact that Ethereum is stalling below a well-defined resistance zone after a completed impulsive move. The current price action suggests distribution and rebalancing, rather than the start of a new bullish leg.
After the strong impulsive rally that pushed ETH sharply above 3,000, price was rejected from the upper resistance near 3,030, triggering a fast corrective sell-off. That initial drop was aggressive and directional, signaling that buyers who entered late were forced to exit. Since then, ETH has recovered partially but has failed to regain acceptance inside the resistance zone around 2,980–3,000.
From a structural perspective, the market is now printing lower highs beneath resistance, with price compressing in the middle of the range. This behavior indicates that upside momentum has weakened and that buyers are no longer in control. The consolidation here is not constructive it is occurring below resistance, which favors another leg lower rather than a breakout.
Technically, the current structure aligns with a bearish corrective sequence. The sideways-to-lower drift suggests that ETH is building a base for continuation down toward the 2,900–2,880 support zone, which has acted as a demand area previously. The projected path on the chart reflects this logic clearly: a shallow bounce, followed by renewed selling pressure into support.
Resistance zone: 2,980–3,000 — repeated rejection, sellers active.
Major resistance: ~3,030 — prior impulse high and supply.
Support zone: 2,880–2,900 — next area where buyers may step in.
Only a clean breakout and sustained acceptance above the 3,000–3,030 resistance would invalidate this pullback scenario and reopen bullish continuation. Until that happens, ETH remains in a post-impulse correction phase, where downside tests are more likely than upside expansion.
Wishing you all effective and disciplined trading.

EUR/USD Is Not Trending — This Is a Controlled Liquidity RangeMarket Analysis (EUR/USD – H1)
EUR/USD is currently trading inside a well-defined sideways range, with price repeatedly rotating between support around 1.1760–1.1770 and resistance near 1.1804, while the upper extension at 1.1819 remains untouched. The structure is clear: lower highs capped by resistance and consistent demand absorption at support, signaling balance rather than directional conviction.
From a technical perspective , the repeated rejections at 1.1804 confirm the presence of resting sell liquidity, while buyers continue to defend the support zone aggressively, preventing a breakdown. Volume remains relatively stable without expansion, reinforcing that this is range rotation driven by liquidity sweeps, not trend continuation.
Macro-wise, EUR/USD remains sensitive to USD yield stability and expectations around Fed policy normalization. With no fresh catalyst shifting rate differentials, price action reflects indecision and positioning cleanup, not a new macro leg. Until either USD strength accelerates or Euro demand improves via data surprise, this range is likely to persist.
Key takeaway:
As long as price holds above 1.1760, downside remains limited. However, a clean breakout above 1.1804–1.1819 with volume is required to unlock bullish continuation. Until then, EUR/USD remains a mean-reversion environment, favoring patience over prediction.

EURUSD Is Coiling — One Clean Break Will Decide the Next MoveEURUSD (1H)
1) Market Structure
Price is in a sideways accumulation range after a prior bullish leg.
Repeated higher reactions from the same base indicate buyers are absorbing supply near support.
Upper wicks near 1.1800+ show sell pressure overhead → market needs a clean break to expand.
2) Key Levels
Support Zone: 1.1760 – 1.1770
Structural base of the range. Holding this zone keeps bullish scenarios valid.
Target 1 / Resistance: 1.18040
First breakout trigger. Needs a clear H1 close above to confirm strength.
Target 2 / Resistance: 1.18197
Range ceiling. Acceptance above this level confirms a true breakout.
3) Trading Scenarios
Scenario A (Preferred): Buy from Support
Condition: Price sweeps 1.1760–1.1770 and reclaims 1.1775–1.1780 with rejection.
Targets:
TP1: 1.18040
TP2: 1.18197
Scenario B (Breakout Buy):
Condition: H1 close above 1.18040, followed by a shallow pullback holding above 1.1800.
Target: 1.18197, then reassess for extension.
Invalidation:
A clean H1 close below the support zone invalidates bullish structure and opens downside risk.
4) Macro Drivers to Watch
USD strength: Rising US yields, hawkish Fed tone, strong US data → EURUSD capped or pushed lower.
EUR strength: ECB staying restrictive, improving Eurozone data, risk-on sentiment → supports breakout.
High-impact catalysts: CPI, PCE, NFP, PMI, FOMC/ECB speeches, and moves in DXY & US10Y.

Breakout Ahead or Another Trap Inside the $85K–$90K Range?Bitcoin is currently trading inside a well-defined consolidation range between $85,000 and $90,000, and the latest price action confirms that this zone remains highly respected by both buyers and sellers. On the 1H timeframe, price was aggressively pushed into the upper boundary near $89,500–$90,000, but the immediate rejection shows that sell-side liquidity and profit-taking are still concentrated at this resistance zone. This behavior is typical of a mature range market, where impulsive moves toward the extremes are often faded unless strong follow-through volume appears.
From a technical structure perspective, Bitcoin has failed to establish a clean series of higher highs above resistance. Instead, the market continues to print range highs with weak continuation, while the EMA 34 and EMA 89 remain relatively flat, reinforcing the sideways environment. The lack of trend expansion indicates that momentum is being absorbed rather than extended. As long as price remains below the $90,000 supply zone, upside attempts should be treated as range tests, not trend breakouts.
On the downside, the $86,000–$85,500 support zone remains the key level to monitor. This area has repeatedly attracted buyers and represents the lower liquidity pool of the range. The projected move on the chart suggests that, after rejection from resistance, price may rotate lower toward this support zone to rebalance liquidity. A reaction from this area would likely result in another mean-reversion move back toward mid-range or resistance, keeping the market rotational rather than directional.
From a macro standpoint, Bitcoin is currently lacking a strong catalyst to break out decisively. U.S. macro data remains mixed, with Federal Reserve rate-cut expectations still uncertain, keeping risk assets in a cautious state. Liquidity conditions are stable but not expanding aggressively, which aligns with Bitcoin’s current consolidation rather than trend acceleration. Without a clear shift in monetary policy expectations or ETF inflow momentum, the market is more likely to continue respecting this range.
In conclusion, Bitcoin remains neutral and range-bound, not bearish but also not yet bullish. Traders should remain disciplined, focusing on selling near resistance and buying near support until a confirmed breakout occurs. A daily close above $90,000 with strong volume would invalidate the range and open the door toward higher targets. Until then, patience is key, the market is building structure, not direction.

ETH/USD – H1 Technical Analysis DetailETH/USD – H1 Technical Analysis
Ethereum has just delivered a strong impulsive breakout from the consolidation structure around 2,950–2,980, pushing price decisively above the prior balance area and reclaiming the psychological $3,000 level. This move is technically significant because it comes after an extended period of compression, where liquidity was building on both sides of the range.
From a structure perspective, ETH has flipped the former resistance zone around 2,980–3,000 into a new support zone. The impulsive bullish candle was accompanied by a clear volume expansion, confirming that this was not a false breakout but rather active participation from buyers. As long as price holds above this reclaimed support, the bullish structure remains intact.
The next key levels are clearly defined:
Immediate support: 2,980–3,000
Resistance 1: ~3,033
Major resistance: ~3,073
A healthy pullback into the 3,000 zone would be structurally bullish, allowing the market to build a higher low before attempting continuation toward 3,030 → 3,070. A clean break and acceptance above 3,073 would open the door for a broader upside expansion on higher timeframes.
On the macro backdrop, ETH is benefiting from a stable risk-on environment, with crypto sentiment supported by expectations of easier monetary conditions in 2026, declining US real yields, and continued institutional positioning in large-cap digital assets. As long as Bitcoin holds its higher range and the USD remains capped, Ethereum retains upside potential.
Conclusion:
This is no longer a range trade. ETH has shifted into a bullish continuation phase, with pullbacks likely to be corrective rather than trend-reversing. The market now favors buying dips above $3,000, not chasing breakouts blindly, while respecting that failure back below 2,980 would invalidate the bullish scenario.
