USDCAD 1 MIN Chart Sell TrendHello,
I’m like a ghost, I come every so and so. Ready for some free trades?
USDCAD 1 MIN chart is showing a sell trend.
Please use risk management as sometimes they trends keep going up or down until they go with the trade.
I will advise you at the comments below when to close the trades.
So please follow for any notifications.
Thanks,
P.S… Should I start a trading community within TradingView? What’s your thoughts?
Technical

[INTRADAY] #BANKNIFTY PE & CE Levels(12/05/2025)Today will be gap up opening in banknifty. Expected opening above 54000 level. After opening if banknifty sustain above this level then expected further extension in this rally towards the 54450 and this can give another 400-500+ points targets if starts trading above 54550 level. Any downside now only expected below 53950 level.

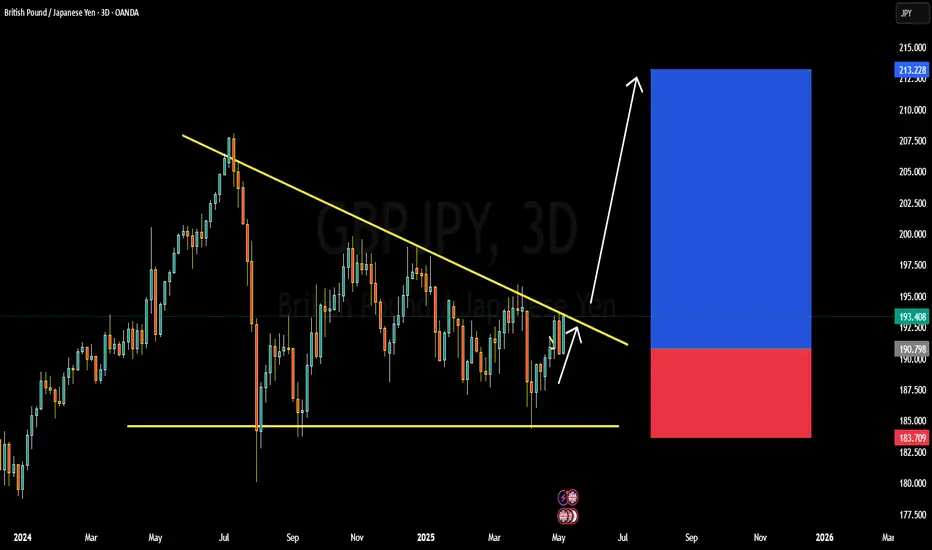
GBPJPY BULLISH OR BEARISH DETAILED ANALYSISGBPJPY is currently trading near 190.80 and is forming a significant breakout structure on the 3-day chart. After months of consolidation under a descending trendline, the pair is now coiling tightly, signaling a potential bullish breakout. The pair has respected the lower support range near 183.70 while pushing up against descending resistance multiple times. This squeeze pattern often precedes a major directional move, and with bullish momentum building, GBPJPY could be primed for a rally toward the 210.00 zone.
Fundamentally, the British pound is finding strong support from the latest hawkish commentary by the Bank of England, which has hinted that inflation remains sticky, keeping rate cut expectations delayed. On the other hand, the Japanese yen remains under consistent pressure due to the Bank of Japan's ultra-dovish stance and yield curve control policies. The BoJ’s reluctance to shift its policy outlook, coupled with soft macro data from Japan, is weakening the yen across the board.
Technically, a breakout and close above the descending trendline around 194.00 will be a key confirmation point. If this happens, bulls could dominate and push GBPJPY toward the 210.00 resistance zone in the medium term. The R\:R on this setup remains favorable with stops safely tucked below 183.70, giving this trade strong upside potential.
This pair is currently one of my top watchlist setups for May as both the technical and fundamental landscapes align. With bullish sentiment driving GBP strength and JPY weakness being a prevailing macro theme, GBPJPY could deliver a powerful upside continuation if the breakout confirms.
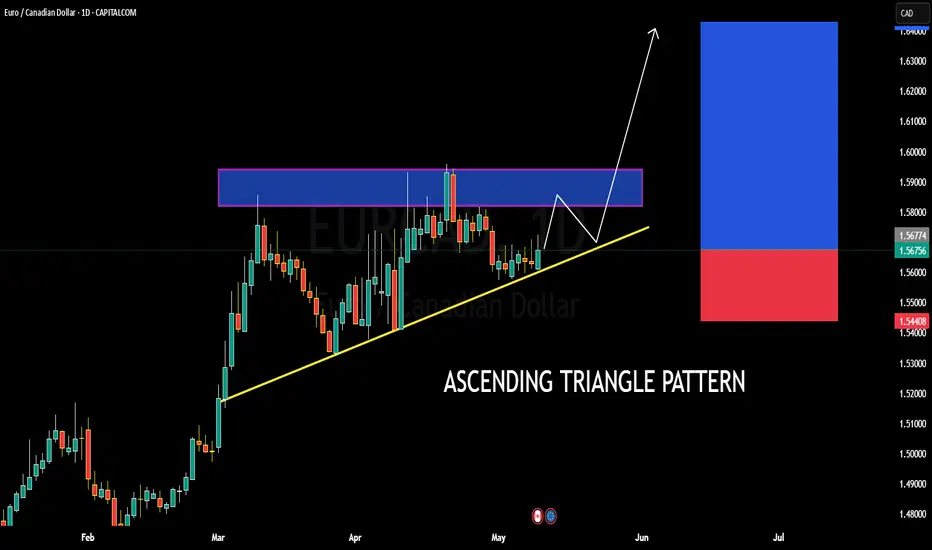
EURCAD BULLISH OR BEARISH DETAILED ANALYSISEURCAD is currently trading around 1.5600 and is consolidating within a textbook ascending triangle pattern on the daily timeframe. This setup signals a strong bullish bias as the pair continues to form higher lows, tightening under a key horizontal resistance zone between 1.5730 and 1.5770. Price is respecting the ascending trendline very well, indicating buyer strength. A breakout above this resistance zone could open the doors for a clean rally toward the 1.6400 psychological level, offering a strong risk-to-reward opportunity.
From a fundamental standpoint, the euro is gaining traction as recent Eurozone economic indicators suggest improving sentiment and a potential shift in ECB tone toward neutral. Meanwhile, the Canadian dollar remains pressured by falling crude oil prices and softening domestic data, including disappointing employment numbers this week. This divergence in fundamentals aligns well with the bullish technical structure for EURCAD, creating a high-probability scenario for buyers.
Looking ahead, a confirmed breakout above 1.5770 with volume could trigger a strong bullish impulse. The measured move from the triangle’s base supports a projection toward the 1.6400 area, making this setup attractive for swing traders aiming to ride the next leg higher. Risk should remain controlled below 1.5440, where the ascending structure would be invalidated.
I’m closely monitoring the price action near the breakout zone. Patience is key, but once we see bullish momentum pushing through the resistance, this trade setup has the potential to deliver a solid upside run. EURCAD remains one of my top bullish forex plays going into mid-May.
SUI ANALYSIS📊 #SUI Analysis
✅There is a formation of Descending Channel Pattern in daily time frame in #SUI .
Also there is a perfect breakout and retest. Now we can expect a bullish move. If the price successful retest the major support zone then we will see more bullish move
👀Current Price: $3.89
🎯 Target Price : $4.25
⚡️What to do ?
👀Keep an eye on #SUI price action and volume. We can trade according to the chart and make some profits⚡️⚡️
#SUI #Cryptocurrency #Breakout #TechnicalAnalysis #DYOR

EUR/AUD Forms Bearish Lower High for Next Leg Down!Timeframe: 1-Hour (H1)
Ideal for swing or position-based intraday trades.
Entry Area (Supply Zone):
Price is reacting from 1.75850 – 1.75970 — strong resistance from prior structure.
Bearish Pattern:
Clear lower highs and supply test failure with rejection — confirms sellers' control.
Stop Loss:
Placed just above the resistance zone near 1.75976.
Target Zone (Demand):
Final green demand zone around 1.73880 – 1.74000 — key support and recent low.
Bearish Wave Projection:
Marked by consistent lower lows and tight bearish continuation structure.
Risk-to-Reward:
Very healthy setup with approx. 1:3+ RRR (ideal for professional entries).
==================================================================
Disclosure: I am part of Trade Nation's Influencer program and receive a monthly fee for using their TradingView charts in my analysis.

GBPUSD BULLISH OR BEARISH DETAILED ANALYSISGBPUSD is currently trading around 1.33400 and is displaying a promising bullish setup. The price action is coiling within a symmetrical triangle, which typically signals a potential breakout. A clear bullish structure has already formed following the recent impulse wave, and with the consolidation tightening, we are now closely watching for a breakout to the upside. The expected bullish breakout aligns with the projected target of 1.36000, offering a strong risk-reward opportunity for trend-following traders.
From a fundamental standpoint, the British pound is showing resilience despite broader dollar strength. Recent comments from the Bank of England have maintained a cautious yet firm tone regarding inflation control, hinting at the potential for rates to stay elevated longer than markets previously priced in. Meanwhile, the U.S. dollar index has seen some pressure amid mixed economic data and increasing speculation that the Federal Reserve may hold rates steady in the upcoming sessions.
Technically, GBPUSD remains well-supported above the 1.32500 level, with buyers defending key horizontal and trendline support areas. The recent compression in price suggests that volatility is about to expand, typically favoring the direction of the initial trend, which in this case remains bullish. Momentum indicators are beginning to curl higher, further supporting a breakout scenario.
In summary, GBPUSD is setting up for a high-probability bullish continuation. A confirmed breakout from the triangle could ignite a fresh rally toward 1.36000, especially if supported by dovish Fed rhetoric and firm UK economic sentiment. This setup is one to watch closely as it aligns both technically and fundamentally, positioning it as a favorable opportunity for medium-term swing trades.

Watching carefully USDCAD this weekWith the abundance of US & CAN data this week, we may see some interesting action in USDCAD pair.
Let's dig in.
Let us know what you think in the comments below.
Thank you.
77.3% of retail investor accounts lose money when trading CFDs with this provider. You should consider whether you understand how CFDs work and whether you can afford to take the high risk of losing your money. Past performance is not necessarily indicative of future results. The value of investments may fall as well as rise and the investor may not get back the amount initially invested. This content is not intended for nor applicable to residents of the UK. Cryptocurrency CFDs and spread bets are restricted in the UK for all retail clients.

AUDJPY, our risk on/off monitor, is near a key resistance areaAUDJPY has been on a good run lately. The driving force behind it was the improved market sentiment due to the calming moment in the tariff wars. Can this be sustained?
Let's look at the technical picture of AUDJPY.
Let us know what you think in the comments below.
Thank you.
77.3% of retail investor accounts lose money when trading CFDs with this provider. You should consider whether you understand how CFDs work and whether you can afford to take the high risk of losing your money. Past performance is not necessarily indicative of future results. The value of investments may fall as well as rise and the investor may not get back the amount initially invested. This content is not intended for nor applicable to residents of the UK. Cryptocurrency CFDs and spread bets are restricted in the UK for all retail clients.

USDCAD BULLISH OR BEARISH DETAILED ANALYSISUSDCAD is currently trading around 1.3820, exhibiting a bullish bias as it approaches the upper boundary of a consolidation range. The pair has been forming a symmetrical triangle pattern, indicating potential for a breakout. A decisive move above the 1.3850 resistance level could pave the way toward the 1.3920 target.
Fundamentally, the U.S. dollar has gained strength due to stronger-than-expected manufacturing data, with the ISM PMI rising to 48.7 in April, surpassing forecasts. This data has bolstered U.S. yields and supported the dollar. Conversely, the Canadian dollar has faced pressure from weaker domestic manufacturing activity, with the S\&P Global Canada Manufacturing PMI falling to 45.3, marking the sharpest contraction since May 2020 .
Additionally, recent U.S. tariff announcements on Canadian goods have introduced further uncertainty, potentially impacting Canada's export-driven economy. The Bank of Canada may consider easing monetary policy to counteract these challenges, which could further weaken the Canadian dollar.
In summary, USDCAD is poised for a potential breakout above 1.3850, driven by a combination of technical patterns and fundamental factors favoring the U.S. dollar. Traders should monitor key resistance levels and economic indicators to confirm the continuation of this upward trend.

OG ANALYSIS🔮 #OG Analysis 🚀🚀 Update
💲 #OG is trading in a Rising Broadening Wedge Pattern and currently retesting the major support zone. Now we can expect a bullish move after the retesting of support zone.
⁉️ What to do?
- We have marked crucial levels in the chart . We can trade according to the chart and make some profits. 🚀💸
#OG #Cryptocurrency #DYOR

USD/JPY(20250502)Today's AnalysisToday's buying and selling boundaries:
144.67
Support and resistance levels:
147.49
146.44
145.75
143.58
142.90
141.84
Trading strategy:
If the price breaks through 145.75, consider buying, the first target price is 146.44
If the price breaks through 144.67, consider selling, the first target price is 143.58
XAUUSD DETAILED ANALYSIS TECHNICAL AND FUNDAMENTALS XAUUSD is currently trading around the 3256 level and is clearly respecting a descending channel on the 1-hour timeframe. The price is now pushing higher from the lower boundary of the channel, suggesting short-term bullish momentum. Based on the current technical structure, I am anticipating a clean breakout above the channel resistance, with the next key target at 3300. The marked purple resistance zone around 3310–3320 also acts as a magnet for price once the breakout is confirmed.
On the fundamental side, gold remains supported by ongoing geopolitical uncertainty and speculation around the Fed's next rate decision. With recent U.S. economic data showing mixed signals—strong labor market figures but slowing inflation momentum—the market is pricing in fewer rate hikes, which weakens the USD and favors upside in XAUUSD. Additionally, central bank gold demand remains strong globally, acting as a long-term support for bullion.
Traders are currently reacting to a softening dollar index and treasury yields, which further underpins bullish sentiment in gold. A clear break above the upper boundary of this channel, ideally with strong volume confirmation, could set the stage for a swift move to retest the 3300 psychological level. From a risk-reward perspective, the breakout trade setup here aligns well with institutional strategies that favor trend continuation post-consolidation.
In summary, XAUUSD is trading inside a clean descending channel, with buyers stepping in aggressively near the support zone. A breakout above the structure could trigger a bullish continuation move toward 3300, backed by strong macro tailwinds and technical confirmation. This setup offers an excellent opportunity for swing traders to capitalize on short-term momentum. Are you also tracking gold fundamentals this week?

USD/JPY(20250430)Today's AnalysisMarket news:
The European Central Bank expects prices to rise 2.9% over the next 12 months, up from 2.6% in February, according to a monthly survey released on Tuesday. This is the highest level since April 2024. The three-year indicator rose slightly to 2.5%. The ECB's first five-year forecast was 2.1%.
Technical analysis:
Today's long-short boundary:
142.32
Support and resistance levels:
143.13
142.83
142.63
142.01
141.81
141.51
Trading strategy:
If the price breaks through 142.32, consider buying, the first target price is 143.00
If the price breaks through 142.01, consider selling, the first target price is 141.81

EURGBP DETAILED ANALYSIS TECHNICAL AND FUNDAMENTALSEURGBP is currently trading around 0.85, having completed a successful breakout and retest of the previous resistance-turned-support level. The price action aligns with a classic bullish continuation pattern, suggesting that the pair is poised for another upward move. My target for this bullish wave is 0.88, which corresponds to the next significant resistance zone.
Technical indicators support this outlook. The formation of a falling wedge pattern on the 4-hour chart has been confirmed, with the breakout leading to a sustained upward trajectory. The retest of the breakout level has held firm, indicating strong buyer interest and the potential for continued bullish momentum.
From a fundamental perspective, the euro is gaining strength due to improved economic indicators in the Eurozone, while the British pound faces headwinds amid ongoing fiscal policy uncertainties in the UK. This divergence in economic outlooks is contributing to the euro's relative strength against the pound, further supporting the bullish case for EURGBP.
In summary, the combination of technical patterns and fundamental factors suggests that EURGBP is well-positioned for a move toward 0.88. Traders should monitor key support levels to manage risk and look for confirmation of continued bullish momentum as the pair approaches the target zone.

GBPJPY DETAILED TECHNICAL AND FUNDAMENTALSGBPJPY is currently trading around the 191.00 zone, and price action is forming a classic bullish flag pattern on the 4H chart. This follows a strong impulse leg, suggesting a potential continuation to the upside. The consolidation is tight and healthy, showing market participants are preparing for a breakout. My upside target stands at 193.000, which aligns with the descending trendline resistance.
From a fundamental perspective, the British Pound remains supported by recent hawkish signals from the Bank of England, which is facing persistent inflation pressures. Meanwhile, the Japanese Yen continues to weaken across the board due to the Bank of Japan’s ultra-loose monetary stance and its defense of yield curve control, which makes it less attractive in a high-interest environment.
Technically, this setup aligns with key momentum indicators and market structure. If price breaks above the flag pattern with volume confirmation, we can expect buyers to take control, pushing price toward the 193.000 resistance zone. This level also coincides with a key liquidity area where prior sellers may be trapped.
Overall, GBPJPY continues to offer a solid bullish bias in the short term. The pair is fundamentally and technically aligned for a push higher. Breakout traders should monitor closely as the price approaches the upper trendline of the flag. This is one of the most watched JPY pairs right now—momentum is building.

USD/JPY(20250429)Today's AnalysisMarket news:
The U.S. Treasury Department raised its second quarter debt forecast to $514 billion. U.S. Treasury Secretary: The "X Day" for the debt ceiling issue will be announced soon.
Technical analysis:
Today's long-short boundary:
142.62
Support and resistance levels:
144.52
143.81
143.35
141.89
141.43
140.72
Trading strategy:
If the price breaks through 142.62, consider buying, the first target price is 143.35
If the price breaks through 141.89, consider selling, the first target price is 141.43

USD/JPY(20250428)Today's AnalysisMarket news:
The Fed's subsequent policy path considers two scenarios: First, there is no substantial progress in the negotiations between the United States and its trading partners. After 90 days, the US tariffs are still high. Weakened economic demand may prompt the Fed to cut interest rates starting in July, and the annual rate cut may reach 100 basis points; second, the negotiations are fruitful, tariffs are reduced, and the demand shock is small, but inflationary pressure continues. The Fed may postpone easing and only cut interest rates slightly in December. For the market, although the easing comes early in the first scenario, the "recession-style" rate cut may suppress risky assets.
Technical analysis:
Today's buying and selling boundaries:
143.40
Support and resistance levels:
144.89
144.33
143.97
142.83
142.47
141.91
Trading strategy:
If the price breaks through 143.97, consider buying, the first target price is 144.33
If the price breaks through 143.40, consider selling, the first target price is 142.83

GBPJPY NEXT WEEK BULLISH OR BEARISH ??GBPJPY is setting up for a major breakout on the weekly timeframe. After weeks of consolidation under a clear descending trendline, price action is now approaching a decisive point where a bullish breakout could trigger a strong rally. With the current price holding firm at 191.00 and clear resistance overhead, a successful breakout could open the doors for a powerful bullish wave targeting 205.000 and beyond.
Fundamentally, the yen remains weak due to continued Bank of Japan dovishness and ongoing yield curve control policies. Meanwhile, the British pound is finding strength as the Bank of England maintains a relatively hawkish stance with the possibility of delaying rate cuts compared to other major central banks. This fundamental divergence between GBP and JPY heavily favors bullish momentum for GBPJPY.
Technically, the pair has formed a solid base of support and is squeezing toward the apex of a descending triangle. If the breakout confirms with strong bullish volume, GBPJPY could enter a fresh bullish cycle, offering a great risk-reward setup for medium to long-term traders aiming for the 205.000 area.
Overall, GBPJPY remains one of the hottest pairs on watch right now with excellent bullish potential. Traders should watch for a clean breakout above the trendline with strong candlestick confirmation to ride the wave higher. Staying patient and disciplined around this breakout zone could deliver highly profitable results.

Berger Paints at Make-or-Break Point:Descending Triangle PatternBerger Paints is currently testing the upper boundary of a long-term Descending Triangle on the weekly chart — a pattern known for sharp breakouts or breakdowns.
📊 Resistance Zone: 600 – A breakout above this level could trigger a powerful upside rally towards 825+, supported by the pattern's height projection.
🔻 Support Level: 543 – A breakdown below this level may lead to a sharp fall towards 400 levels.
⚠️ Bearish Pin Bar Candle at resistance signals caution; confirmation is key before entering any trade.
📌 Watch closely for a decisive move – this zone is critical for trend reversal or continuation.
This setup offers a high-reward opportunity for positional traders, with clear entry and exit zones. Manage your risk wisely and follow with volume confirmation.

USD/JPY(20250425)Today's AnalysisMarket news:
Federal Reserve-①Hamack: If economic data is clear, the Fed may cut interest rates in June
②Waller: It will take until July to get a clearer understanding of how tariffs affect the economy. If tariffs lead to higher unemployment, interest rate cuts may be initiated. ③The Atlanta Fed GDPNow model predicts that the US GDP growth rate in the first quarter will be -2.5%. ④Kashkari: The frequent announcements from Washington have brought challenges to policymakers and everyone.
Technical analysis:
Today's buying and selling boundaries:
142.79
Support and resistance levels:
143.94
143.51
143.23
142.34
142.06
141.63
Trading strategy:
If the price breaks through 142.79, consider buying, the first target price is 143.23
If the price breaks through 142.34, consider selling, the first target price is 142.06

btc . w4 . fancy SHORTthe 'OTF - one time frame' Break of the monthly is still due.
There was no chance for LONGS during the week for retail buyers, only late buyers.
We've traded 2 days just under resistance, accumulating:
- late LONGS
- early SHORTS
I'm willing to SHORT now on friday, once the OTF has been hit.
Scalling in from cwHigh upwards
Invalidation would be to keep pumping and then potentialy SFP on monday for downside.
R:R is alright! I like to give myself a 3% invalidation range till SL.

USDJPY Buy UpdateUSDJPY Buyers stepping in fully...
Analyzing the information from what the yearly candle printed a strong buy is building up at these level
