EURAUD 1D Analysis - Demand Zone + Bullish Continuation 📊 EURAUD – Detailed Price Action Analysis (Reversal Context)
This chart highlights EURAUD price behavior around a higher-timeframe demand zone, where selling pressure has slowed and a bullish reaction is already visible. The analysis focuses on market structure, volume reaction, and confirmation-based continuation rather than prediction.
🔍 Higher-Timeframe Context
Price has been trading in a broad range for several months, respecting clear highs and lows.
Recent price action shows a strong bearish leg pushing into a previously respected demand area.
This area has historically acted as support, making it a high-probability reaction zone.
📉 Bearish Push & Exhaustion
The most recent down-move is impulsive, suggesting liquidity targeting below recent swing lows.
Sellers pushed price aggressively into the lower range, triggering:
Stop-losses
Late sellers entering at discount
This behavior often precedes temporary exhaustion.
🟩 Reversal Zone + Volume Burst
The highlighted Reversal Zone marks a high-interest demand area.
A volume burst occurred at this level, signaling:
Absorption of sell orders
Potential smart money participation
Price responded immediately with bullish candles, confirming buyer presence.
📌 Note: The chart clearly shows “Pattern Already Comes”, meaning the initial confirmation has already formed.
🔄 Market Structure Shift (Early Signs)
Short-term structure shows:
Higher low formation
Strong bullish rejection from the zone
While this does not yet confirm a full trend reversal, it strongly supports a corrective upside move.
📈 Bullish Continuation Scenario
If price continues to hold above the reversal zone:
Expect a pullback-and-continuation structure
Upside targets may include:
Previous internal highs
Range equilibrium
Upper resistance zones if momentum sustains
This scenario favors buy-on-pullback strategies, not chasing.
📉 Failure Scenario
If price breaks cleanly below the demand zone:
Bullish bias is invalidated
Expect continuation toward deeper range lows
This reinforces the importance of risk management and confirmation
🧠 Trading Insight
This setup emphasizes:
Letting price confirm intention
Trading reaction, not anticipation
Respecting zones where volume and structure align
Patience remains the edge.
Technical Analysis

XAGUSD Analysis - Strong Sell-Off & Bullish Reversal Is Loading 📊 XAGUSD (Silver) – 30 Minute Chart Detailed Analysis
This chart presents a 30-minute timeframe analysis of XAGUSD, highlighting a sharp bearish displacement, a key reaction zone, and the potential for a short-term bullish reversal if confirmation appears.
🔍 Market Structure Overview
Price was previously in a clear bullish structure, forming higher highs and higher lows.
After topping near the 64.50 – 64.70 area, the market printed a strong impulsive bearish candle, breaking the prior structure decisively.
This move qualifies as a Break of Structure (BOS) to the downside, indicating aggressive sell-side participation.
📉 Impulsive Move & Liquidity Sweep
The large bearish candle suggests:
Liquidity grab above recent highs
Institutional selling pressure
The move also fulfilled a measured move (≈ 2x range expansion), often seen at temporary exhaustion points.
🟦 Reversal Zone (Key Area of Interest)
The highlighted blue box represents a demand / mitigation zone around 61.70 – 61.95.
This area aligns with:
Previous minor consolidation
Reaction after strong displacement
Potential order block / imbalance mitigation
Price is currently consolidating inside this zone, indicating hesitation and reduced momentum from sellers.
🔄 What the Market Needs (Confirmation Logic)
At this level, the market does NOT justify immediate entries. A valid trade requires confirmation, such as:
Bullish engulfing candle
Strong rejection wicks from the zone
Break and close above short-term internal highs
Change of character (CHOCH) on lower timeframes
👉 The chart explicitly notes “Need Pattern”, emphasizing patience and discipline.
📈 Bullish Scenario
If confirmation occurs:
Expect a pullback-reversal toward:
62.80
63.50
Potentially the previous high zone if momentum builds
This would be a corrective move, not yet a full trend reversal unless higher structure confirms.
📉 Bearish Scenario
If price fails to hold the reversal zone:
Continuation toward:
61.20
60.80
This would confirm sellers remain in control and the zone has failed.
🧠 Trading Psychology Insight
This setup rewards:
Patience
Confirmation-based entries
Risk management over prediction
The market has already moved aggressively — the edge lies in waiting, not chasing.

EURJPY 30M: Bullish Structure Testing Premium Supply Area🔷 Possible Reversal Setup at Premium Zone (EURJPY – 30M)
📌 Market Overview
The EURJPY pair on the 30-minute timeframe is currently trading in a strong bullish structure, characterized by higher highs and higher lows. Price has respected demand areas well and continues to push upward with momentum, showing that buyers are still in control in the short term.
However, the chart clearly highlights a premium supply / reversal zone above current price, where previous institutional selling pressure exists. This zone is marked as a key decision area rather than an immediate sell.
📊 Price Action & Structure Analysis
Price previously formed a range consolidation, followed by a strong bullish breakout, confirming buyers’ strength.
After the breakout, the market created a sequence of impulsive bullish legs and corrective pullbacks, maintaining structure.
Current price is approaching the upper liquidity zone, where smart money may look to distribute positions.
This area is not a blind-entry zone. The chart explicitly notes “Need Pattern Here”, emphasizing that confirmation is required before any reversal trade.
🔄 Reversal Zone Logic
The highlighted zone acts as a high-probability reaction area due to:
Previous rejection from this level
Price reaching a premium range
Potential liquidity grab above recent highs
Once price enters this zone, the market may:
Sweep liquidity above highs
Form a bearish confirmation pattern
Shift short-term structure to the downside
Without confirmation, bullish continuation is still possible.
🕯️ Confirmation to Watch
Traders should wait for clear bearish price action, such as:
Bearish engulfing candles
Long upper wicks (rejection)
Lower high formation
Break of internal bullish structure
Only after confirmation does a short setup become valid.
🎯 Trade Expectations (Scenario-Based)
Primary Scenario:
Price taps the reversal zone → forms bearish confirmation → corrective move downward toward the marked support area.
Alternate Scenario:
Price breaks and holds above the zone → bullish continuation remains intact.
This approach keeps risk controlled and avoids emotional or early entries.
🧠 Trading Psychology Insight
This setup teaches patience. The zone itself is not the signal—
price behavior inside the zone is the signal.
Professional traders wait for the market to show its hand before committing capital.

Airbnb: Proof that even stocks love to traveThe analysis of Airbnb (ABNB) stock reveals an intriguing setup following the breakout and retest of a key resistance level, which previously acted as a trendline on the daily chart. After successfully breaking above this line and confirming it with a retest, the price is now showing potential for further upside — aligning with a bullish scenario that targets the $164 area, which also coincides with the 1.0 Fibonacci level (164.12).
The current structure suggests the beginning of an upward movement after a period of consolidation, with both the 50-day and 200-day moving averages (MA50 and MA200) positioned to support further growth, reinforcing the overall bullish outlook.
Notably, trading volume has increased in line with the breakout and continued price movement, adding confidence to the scenario playing out toward the higher targets. Key Fibonacci resistance levels to watch next include 0.786 (150.37) and 1.272 (181.61), with a long-term extension target at 1.618 (203.85).

LULU 1D - stretching into a comebackOn the daily chart of Lululemon Athletica (LULU), a clean AB=CD pattern is forming, signaling a potential end to the correction and the beginning of a new upward wave. The price has tested the strong buy zone between 164–167, aligned with a major daily support level and rising volume - a classic setup indicating that buyers are regaining control.
Technically , the structure is highly symmetrical, RSI shows a bullish divergence, and the 50-day moving average is starting to turn upward - all suggesting a possible trend reversal. The first upside target for this pattern is $230, followed by a second target at $340, which corresponds to the 1.272 and 1.618 Fibonacci extensions.
From a fundamental standpoint, Lululemon remains a powerhouse in the premium activewear market, maintaining strong brand loyalty even amid competition from Nike and Alo. The company continues to expand its men’s line and footwear segment, which now accounts for over 25% of total revenue. International growth remains robust, with new stores opening in South Korea, the UAE, and Germany. Lululemon’s shift toward higher-margin online sales and more efficient logistics continues to strengthen its profitability.
In the latest quarterly report (September 2025), revenue grew by 9% year-over-year, and EPS came in above Wall Street expectations. High customer retention - over 90% repeat purchase rate - and stable gross margins create a solid foundation for a mid-term recovery in the stock.
Tactical plan: watch for entries within the 164–167 buy zone, consider partial profit-taking near $230, and target $340 if momentum extends. Just like in yoga, patience and balance lead to the best results.

Clean vs Trap Pullbacks — Don’t Get FooledIn trading, a pullback can be an opportunity…
but it is also one of the most common traps that causes traders to lose money.
Some pullbacks allow you to enter with low risk, clean RR, and follow the trend smoothly.
Others look perfectly reasonable… until the market reverses and wipes out your stop loss.
So how do you tell a clean pullback from a trap pullback?
1. Clean Pullback – A Pause Before Continuation
A clean pullback is a healthy correction within a strong, intact trend.
Think of it as the market catching its breath before the next push.
Key characteristics of a clean pullback:
◆ The main trend remains clear
Higher highs – higher lows (uptrend)
Lower lows – lower highs (downtrend)
◆ The retracement is weaker than the impulse move
Smaller candles, shorter bodies, long wicks
No structural break
◆ Volume decreases during the pullback
Selling (or buying) pressure is not aggressive
The market is simply “resting”
◆ Price pulls back into a logical area
Previous support/resistance
Structural zones
Common Fibonacci levels (38.2 – 50 – 61.8)
👉 A clean pullback does not damage the trend’s integrity — it only tests it.
2. “Trap” Pullback – Looks Like a Retracement, Acts Like a Reversal
Trap pullbacks usually appear after a trend has extended too far or when momentum starts to fade.
They make traders think:
“It’s just a normal pullback…”
But in reality, smart money is already distributing.
Signs of a trap pullback:
◆ Trend strength is clearly weakening
New highs fail to exceed previous highs
Previous lows start getting broken
◆ The retracement is strong and aggressive
Large-bodied candles closing deep
Price moves confidently against the trend
◆ Volume increases during the pullback
This is no longer a technical retracement
Real money is changing direction
◆ Market structure breaks
Key highs/lows are violated
Break → retest → continuation in the opposite direction
👉 Trap pullbacks exploit a trend trader’s overconfidence.
3. A Common Mistake: “Price Pulls Back = Enter Trade”
Many traders don’t lose because of bad analysis,
but because they enter too early.
Familiar thoughts:
“It pulled back to support — buy.”
“The trend is still bullish.”
“That candle is just a retracement.”
But the market doesn’t care what you think.
It only cares about where the money is flowing.
4. How to Avoid Trap Pullbacks – Survival Rules
If you remember these three rules, you’ll avoid most pullback traps:
◆ Never enter just because price pulls back
Wait for confirmation:
rejection candles
small break & retest
clear reaction at structure
◆ Always check market structure first
Is the structure intact or broken
Are key highs/lows still respected?
◆ Compare impulse vs retracement
Strong impulse – weak pullback → trend is alive
Strong pullback – weak impulse → reversal risk
XAUUSD: Bullish Momentum StrengthensGold is entering a highly promising bullish phase as the market shifts strongly to the buy-side following the Fed’s decision to cut interest rates. The emerging risk-on sentiment aligns perfectly with a technical setup that is paving the way for a potential breakout — creating an exceptionally attractive environment for traders in the coming days.
1. Fundamental Drivers Supporting Gold’s Uptrend
• The Fed cut rates by 25 bps, something the market had been waiting for weeks. This immediately pushed the USD down to its lowest level in eight weeks.
• With a weaker USD, gold becomes cheaper for global buyers → strong inflows into XAUUSD.
• President Donald Trump continues to support low interest rates, a long-term policy signal that reinforces expectations that gold still has room to rise.
• Markets are now watching the December 16 NFP report, but given the current backdrop, this data will likely bring short-term volatility rather than change the broader bullish trend.
=> The macro landscape is clearing the path for gold to continue rising in the mid-term.
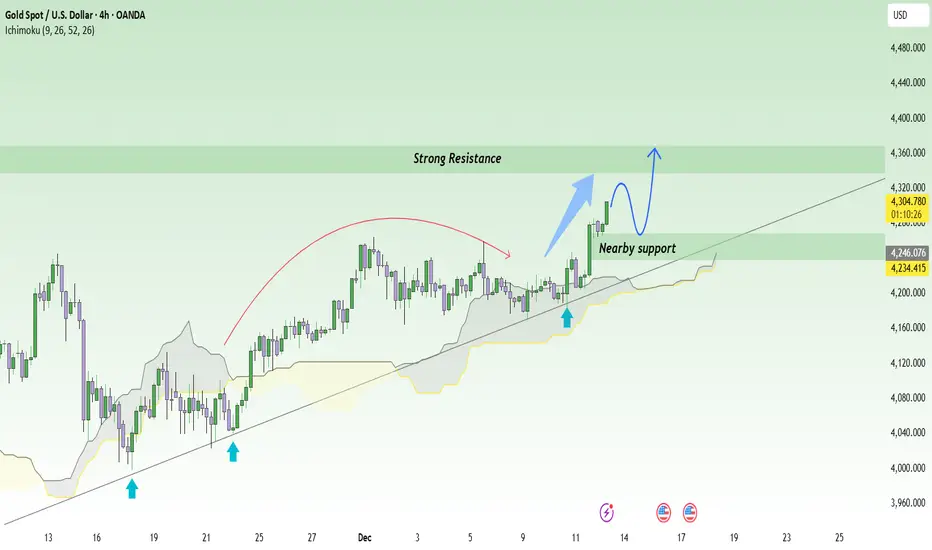
2. Technicals: Gold Holds Its Uptrend and Is Approaching Strong Resistance
Looking at the chart:
• XAUUSD is maintaining its position above the ascending trendline established since mid-November.
• Each time price touched the trendline, it bounced sharply — showing that buyers remain active.
• The nearby support at 4,270 is acting as a strong dynamic floor.
• Price is now approaching a major resistance zone at 4,360 – 4,370. With the current momentum, the likelihood of a slight pullback followed by a breakout is very high.
• If the breakout succeeds, the next target sits around 4,400 – 4,420.
=> A clean uptrend structure, nearby support, and strong momentum — buyers are fully in control.
3. Suggested Trading Setup
Prioritize buying with the trend.
Wait for a potential retest at 4,270 – 4,290 for an optimal entry.
A break above 4,370 will serve as a confirmation signal to scale in further.
FED Turns Hawkish — Bitcoin Drops HardBitcoin has begun to move exactly in line with the projected downside structure. After rejecting the resistance zone around 91,543, price has broken below the short-term support and is now entering a clean retracement phase.
At this stage, BTC is likely to continue following the descending path toward the key liquidity zones highlighted on your chart:
Target 1: 89,068
Target 2: 87,794
Target 3: 86,386
The market structure shows clear lower highs and lower lows, signaling that sellers are currently in control. Until BTC can reclaim the mid-range zone above 90,800–91,000, the bearish outlook remains valid.
This corrective move is healthy for the broader trend, helping sweep liquidity and rebalance price before any larger directional expansion.

ETH Holding the Trendline - Bulls Aiming for the Resistance Zone1. MARKET CONTEXT
Macro sentiment remains stable, with crypto recovering after minor pullbacks. No major bearish catalysts risk assets are still supported as liquidity conditions remain favorable.
2. TECHNICAL ANALYSIS
Price is riding a clean ascending trendline.
A support zone sits directly below current price, providing a strong demand base.
Market structure remains higher highs – higher lows, confirming bullish control.
Expectation: a small pullback into trendline + support → continuation move upward.
3. TRADE IDEA
Bias: Long on retracement into support/trendline
Target: Resistance zone at 3440–3450
Invalidation: Break below the support zone
ETH is primed for a trend-continuation move as long as price respects the ascending structure.

ETH/USD Just Found Key Support - Is the Next Breakout Coming?🔹 MARKET BRIEFING – ETH/USD (1H)
Market State:
– Ethereum is holding strong above the key support level around 3,050, showing bullish momentum after bouncing from this level. A retest of the support zone seems to have set up the potential for another leg higher.
Key Levels:
– Support Zone: 3,050
– Target 1: 3,100
– Target 2: 3,150
– Resistance Zone: 3,200
Next Move:
– With price respecting support at 3,050, ETH/USD is poised for another rally toward 3,100 and 3,150, aiming for a test of the 3,200 resistance.

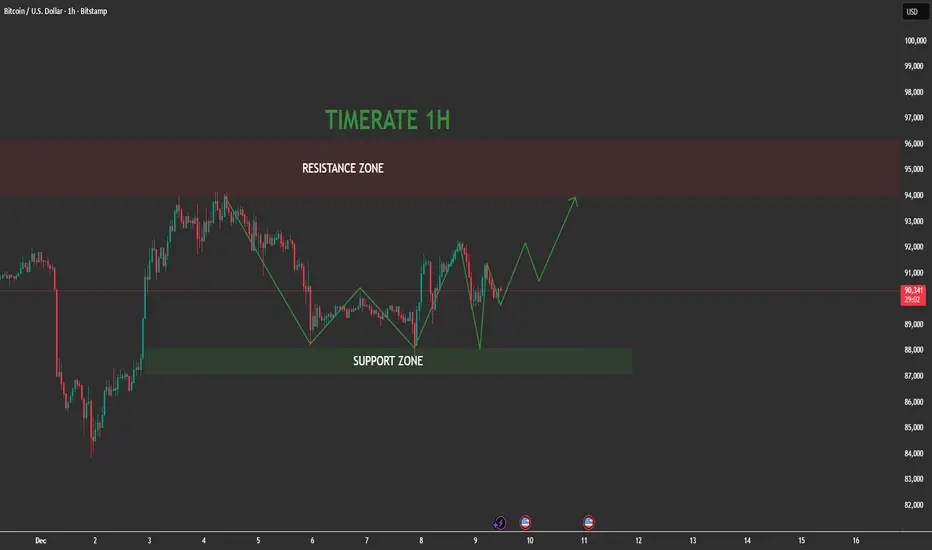
BTC Isn’t FOMO — But It’s Not Ready to Drop EitherIf we look at BTC right now as a tug-of-war, the buyers are winning slightly — and consistently . Recent news continues to support a moderate risk-on environment , institutional capital has not exited Bitcoin , and the market lacks a shock strong enough to trigger a deep sell-off. As a result, the most reasonable scenario over the next 1–2 days is a gradual, controlled upside rather than a sharp vertical breakout.
From a technical perspective, the overall trend still leans bullish . Price is holding above a rising trendline and continues to find support on pullbacks. The 90,000 level stands out as a key psychological support and has repeatedly acted as a reliable base for rebounds. Ichimoku analysis shows price hovering around short-term equilibrium, suggesting the current move is more about accumulation and slow continuation than an aggressive rally.
The plan for a mild bullish bias is clear: prioritize BUY setups on pullbacks toward the 90,000–90,300 zone, especially if price shows strong holding behavior. If BTC regains momentum and stabilizes above this area, the next upside target sits near 94,000 as the upper resistance zone. Conversely, a clean break below 90,000 would weaken the bullish-light scenario and increase the likelihood of a deeper pullback for renewed accumulation.
In short, BTCUSDT is in a healthy, moderate bullish phase — not euphoric , but structurally supported. The real question now isn’t “will it go up?”, but rather: will you wait for a clean pullback to 90,000 for a safer entry, or step in as price starts pushing higher?


EURGBP Analysis - Bearish Supply Loading + Reversal Zone📊 EURGBP – Detailed Structural Analysis (2H Timeframe)
The current EURGBP chart shows a well-defined sequence of structural shifts, liquidity sweeps, and supply–demand interactions that build a compelling bearish narrative—but only if the market respects the highlighted zone. Here's an expanded breakdown of what the chart communicates:
🟦 1. Major Supply Zone (Primary Reaction Area)
Price has pushed into a clearly marked bearish supply zone, formed by a previous displacement move to the downside.
This zone represents the origin of the earlier impulsive sell-off, meaning institutional orders may still reside here.
Inside this zone:
A Pattern Must label marks the exact sub-level where the reaction is expected.
A red highlight indicates the precision entry or rejection area within the broader supply range.
The market is attempting a retest of this supply after reclaiming short-term highs.
The reaction from this zone will determine whether the pair continues lower or attempts a deeper pullback.
🟩 2. Reversal Zone (Demand Base)
Lower on the chart, a large demand region is labeled Reversal Zone, showing where price consolidated and reversed previously.
Key insights:
This zone captured liquidity through several wick rejections.
Buyers stepped in aggressively, initiating the bullish move that is now challenging the upper supply.
This zone becomes an important downside target, should bearish structure confirm.
📉 3. Market Structure Overview
The sequence leading into the supply zone shows:
A series of higher highs and higher lows, indicating bullish momentum.
However, much of this movement appears corrective as it climbs into a previously unmitigated supply.
The sharp arrow drawn downward indicates a bearish expectation, anticipating that supply may overpower current bullish correction.
This aligns with a classic “rally into supply” distribution pattern.
🔍 4. Liquidity Considerations
The chart reflects:
Sweeps of internal liquidity during the climb.
A likely hunt for liquidity above the minor swing before reacting at the supply.
Clean equal lows below—perfect targets for a downside continuation.
The market may be engineering a liquidity trap before reversing.
🔄 5. Expected Scenario
If the supply zone holds:
A bearish rejection from the marked “Pattern Must” area could trigger a structure break to the downside.
Sellers may then push price toward the Reversal Zone to rebalance inefficiencies left during the rally.
If price invalidates the supply zone:
Expect continuation into a deeper premium region before reassessment.

EURUSD Analysis | Reversal Zone + Bullish Zone IdentifiedEURUSD Analysis | Reversal Zone + Bullish Zone Identified
1. Market Structure Overview
The EURUSD 30-minute chart is currently showing a clean bearish structure, with consistent lower highs and lower lows forming after a strong impulsive move downward.
Following the sharp drop, price has been pulling back in controlled corrective waves, indicating sellers are still dominant.
A key observation is the vertical impulsive bearish leg, which was followed by a series of small consolidation phases, each breaking downward and continuing the trend. This confirms a well-maintained downtrend.
2. Demand / Reversal Zone Highlighted
Price is now approaching a marked Reversal Zone (Demand Zone) drawn between the last significant rally base before the strong upside move.
This zone is important because:
It was the origin of the previous impulsive bullish move
Price dropped back into this zone for the first retest
Liquidity beneath recent lows may get tapped inside this area
Institutional footprints (order block structure) are present here
If buyers are going to re-enter, this is the most probable zone.
3. Current Candlestick Behaviour
As price taps into the zone, the latest candles show:
Momentum slowing down
Smaller body candles signaling exhaustion
Potential wick reactions forming
Market preparing for possible reversal attempt
However, no confirmed bullish pattern has formed yet.
4. What We Need to See Before Entering
The chart annotation “Need Pattern Confirmation” correctly notes that traders should wait for:
✓ A bullish engulfing
✓ A break of minor structure
✓ A rejection wick or pin bar
✓ Shift of character (ChoCH)
✓ Increase in bullish volume
Without confirmation, the zone can still break downward.
5. Possible Scenario Outlook
Bullish Reversal Scenario
If confirmation appears inside the green highlighted zone:
Price may bounce and move back toward the mid-range
Short-term upside targets:
1.17350 → 1.17500 → 1.17620
Structure may shift into a short-term bullish correction phase
Bearish Continuation Scenario
If the zone fails:
A clean break below the base may signal continuation
Downside targets would extend toward:
1.17050 → 1.16880
This keeps the overall bearish trend intact
6. Trade Idea Summary
Bias: Short-term bullish only if confirmation appears
Main Zone: Reversal/Demand Zone (highlighted)
Invalidation: Break and candle close below zone
Conservative Approach: Wait for structure shift
Aggressive Approach: Enter lower-timeframe patterns inside the zone
7. Final Thoughts
EURUSD is positioned at a high-value zone, but patience is essential. Institutional levels often trap early entries before making a move. Let the market show strength before committing.
A clean, disciplined approach will yield the best results here.

USDJPY Analysis - Bullish Target + Targeting Unmitigated SupplyUSDJPY 2H – Reversal Zone Reaction & Targeting Unmitigated Supply
1. Market Structure Overview
USDJPY is currently trading inside a corrective phase after a strong bullish rally that topped out around the 156.7–157.0 region. After that peak, sellers stepped in aggressively, creating a deep displacement to the downside that shifted the market temporarily into a bearish structure.
The decline formed a clean QL (Liquidity Run) and then stabilized as price entered a deeper retracement.
2. Key Liquidity Events
The chart highlights two important liquidity operations:
• Liquidity Grab (QL)
Price swept liquidity below a major structural low, triggering a strong reaction from buyers.
This confirms that smart money was accumulating positions around this region.
• Volume Burst Above (Unmitigated Supply)
There is a visible imbalance and unmitigated supply zone higher above, marked by a wide green zone.
This zone is likely to attract price as institutions tend to push markets back into these inefficient areas to fill remaining orders.
This creates a bullish short-term target even if the larger structure remains mixed.
3. Reversal Zone Reaction
Price dipped into the Reversal Zone (Demand Zone), where:
Previous selling pressure weakened
Multiple rejection wicks formed
A bullish engulfing structure signaled buyer aggression
Price reclaimed minor structure levels
This confirms the zone as a valid demand region and explains the strong bullish reaction seen on the 2H timeframe.
4. Intraday Structure Shift
After tagging demand, price broke above a minor swing with a clean iBo (Internal Break of Structure).
This is significant because:
It validates the bullish continuation toward the next major target
It signals that intraday momentum has shifted upward
It gives buyers a roadmap toward the unmitigated supply zone
This upward move is the rally currently in progress.
5. Target Zone (First Objective)
The chart highlights a Target Zone just below the Volume Burst area.
This is the first take-profit region for longs because:
It contains unfilled imbalance
Short-term liquidity sits above recent highs
Supply exists at the base of the previous major sell-off
Once price reaches this area, traders should watch for:
Exhaustion candles
Bearish confirmation patterns
Failure swings
Rejection wicks
This zone is crucial for potential trend reaction.
6. Volume Burst Zone (Major Reversal Supply)
The upper green zone (Volume Burst) represents a high-probability reaction area where the previous heavy selling originated.
Expect possible behavior such as:
Sudden rejection
Liquidity sweep and reversal
Consolidation before a deeper drop
Bearish confirmation patterns (engulfing, MS shift, etc.)
This zone is likely where the next major short opportunity may form, as indicated by the arrow pointing downward.
7. Expected Price Path
Based on the chart's arrows and structure:
Short-Term:
Price continues pushing upward to fill inefficiencies and tap into the target zone.
Mid-Term:
Depending on flow, price may reach the deeper Volume Burst zone.
Reversal Scenario:
A bearish pattern in these upper zones would signal a potential move back toward the mid-range or even the Reversal Zone again.
Patience is key—confirmation is required before entering any short position.

BTCUSD Analysis - Major Supply Zone + Reversal1. Higher-Timeframe Context
BTC is currently trading inside a broad consolidation range after a strong impulsive leg to the upside followed by an equally sharp corrective decline. The market has created clear liquidity pockets both at the top and bottom of the range, suggesting price is hunting for inefficiencies rather than trending cleanly.
The current structure shows that BTC is in the middle of a retracement phase after rejecting the lower boundary of the range.
2. Impulse Move & Liquidity Grab
A significant vertical bullish impulse can be seen near the left side of the chart, creating a sharp displacement candle. This move broke short-term structure and left behind a clean imbalance.
After the rally, price failed to maintain directional continuation and rotated back lower, indicating the move acted more like a liquidity sweep rather than genuine trend continuation.
This is important because markets typically return to revisit these inefficient zones before deciding the next major direction.
3. Reversal Zone (Key Supply Area)
The highlighted green zone represents a high-probability supply area where:
Volume Burst: Indicates aggressive buy-side activity that may have come from late buyers or trapped longs.
Reversal Zone: This is the last major bearish origin block that caused the breakdown. Price re-entering this area signals a likely reaction.
A reaction here is expected because this zone contains both:
Unmitigated supply
Liquidity engineered above recent swing highs
This combination often creates a magnet for price and a turning point afterward.
4. Expected Price Behavior
Price is currently climbing back toward the Reversal Zone.
The chart suggests two possible scenarios:
Scenario A – Pattern Confirmation Before Short
Price taps the reversal zone, forms a bearish confirmation pattern (e.g., bearish engulfing, 2-candle reversal, break of intraday low), and begins trending downward.
This aligns with the diagram arrows showing rejection and continuation down.
Scenario B – Liquidity Grab Then Rejection
Price may wick slightly above the zone to collect liquidity, then sharply drop.
This is common behavior in areas with heavy wick rejections on history.
A clear message noted on the chart: “Need Pattern Here” – meaning that entries should only be attempted once the market shows clear reversal structure, not by blindly shorting the zone.
5. Short-Term Targets if Rejection Happens
If rejection confirms, potential downside targets include:
Return to mid-range
Retest of intraday support around recent consolidation
Lows near 90,800–91,200
Possible extension toward the range bottom if momentum increases
These levels are visible on the chart where previous structural lows were formed.
6. Market Psychology at This Zone
This area is important because:
Buyers who bought late in the impulse are trapped
Short sellers are waiting for optimal entries
Liquidity accumulates above swing highs
Institutions often push price into such zones to fill large orders
This creates a high-probability reversal environment, but confirmation is essential.

Silver Extends Gains as Wave Structure Points HigherSilver broke higher last week sharply and decisively, while gold has not followed to the upside as strongly. However, with the gold–silver ratio falling, silver remains the stronger performer at this stage. Because of this relative strength, the move could be wave (3) of an ongoing five-wave bullish impulse, especially given the strong extension higher and the fact that gold is also approaching an all-time high.
Silver may continue to grind higher, and there appears to be room toward the 261.8% Fibonacci extension and the 68–70 zone to complete a lower-degree impulse within wave (3). Currently it can be trading in subwave 3 with room for more gains, just be aware of subwave 4 pullback before a bullish resumption within subwave 5 of (3).

Dow Jones: Potential Explosive Move!Hey Traders,
In today's trading session we are monitoring US30 (Dow Jones) for a buying opportunity around the 48,400 zone. The index is trading in a strong uptrend and is currently in a correction phase, approaching the trend area at 48,400 support and resistance.
Trade safe,
Joe.

EURUSD Is About to Surprise Everyone…1. Market Structure
- EURUSD is currently respecting a well-defined ascending channel, with price bouncing consistently from the lower trendline and rejecting the upper boundary.
This confirms a strong bullish structure.
2. Key Zones
🔹 Strong Support Zone (Bottom Green)
This is the origin of the current bullish reversal.
As long as price stays above this zone, the macro bullish bias remains valid.
🔹 Weak Support Zone (Middle Green)
Price recently tapped this area again and produced a bullish reaction exactly at the lower channel support.
This confirms buyers are actively defending the trendline.
🔹 Resistance Zone (Top Red)
This is the next major area that could cause a temporary pullback before continuation.
3. Price Reaction
Your chart marks a bullish signal at the channel’s lower boundary. this is a textbook continuation setup:
-Higher lows
-Higher highs
-Trendline support respected
- No structural break to the downside
The circle highlight shows a successful retest, signaling fresh buying pressure..
4. Expected Move
If price holds within the channel:
✔️ Pullback into support
✔️ Bounce from lower trendline
✔️ Break above resistance
✔️ Extension to the top of the channel
The green zig-zag projection on your chart perfectly illustrates this bullish wave sequence.
5. Bullish Scenario
As long as price stays above the lower trendline → EURUSD remains in a clean uptrend.
Next targets: 1.1680 – 1.1700 (Resistance Zone)
Breakout above → Move toward upper channel extension
6. Bearish Invalidation
The outlook fails only if:
❌ Price breaks below the channel
❌ Closes under the weak support zone
As of now — this has NOT happened.
Stay patient and trust the structure — clean price action inside a rising channel often leads to explosive continuation moves.

Is Bitcoin Quietly Building Power for a Breakout?📌 1. Market Structure
Bitcoin on the 1H timeframe is forming a clear higher-low structure off the support zone.
Price rejected the green support block aggressively, showing buyer absorption.
The current structure is transitioning from a consolidation phase into a potential bullish continuation leg.
📌 2. Key Zones
Support Zone (Strong Demand):
- Located around the $88,800 – $89,400 region.
- Price has tapped this zone multiple times and continues to bounce — clear demand.
Resistance Zone (Major Supply):
- The large red block at $94,000 – $97,600.
- This is the target zone for the next impulse move.
📌 3. Price Action
- Price formed a V-shaped recovery from support.
- Followed by a sequence of HL → HH attempts, signaling trend resumption.
- The latest pullback is shallow — a bullish sign showing sellers are weak.
- The green projection aligns perfectly with standard bullish market flow:
higher low → push up → correction → strong breakout leg.
Momentum is slowly shifting from neutral to bullish.
📌 4. Technical Confirmation
-Buyers defended support with strong reaction wicks.
-No breakdown beneath the key swing low — bullish structure intact.
-Mid-range is now acting as a local accumulation zone.
-Liquidity above $91,200 and $92,500 is likely to be targeted next.
This setup aligns with classic trend continuation inside a wide range.
📌 5. Trading Plan (Entry – SL – TP)
🎯 Long Setup
Entry: 90,300 – 90,450
Stop Loss: 89,650 (below last swing low & support zone)
Take Profit 1: 92,500
Take Profit 2: 94,800
Final Target: 97,500 (top of resistance zone)
Why this works:
You’re entering on a bullish higher low, with low risk and high reward as price moves toward the resistance block.
XAU/USD Technical Analysis: Breakout & Bullish Target Senario📈 XAU/USD (Gold) 30M Technical Analysis: Breakout & Two Key Scenarios
📌 Summary of Current Setup
The XAU/USD pair has recently shown a clear break to the upside out of a well-defined short-term consolidation pattern, suggesting a bullish shift in immediate momentum. The price is currently resting right at the top of a crucial short-term resistance level, which is being tested by a high-momentum candlestick.
📝 Detailed Analysis
1. Consolidation Breakout
Previous Pattern: The chart highlights a period of sideways movement within a downward-sloping channel (or bullish flag/pennant in a larger context, though locally defined as a channel). This channel, visible from the late hours of the previous day into the current day's trading, represented a period of accumulation/distribution.
The Break: Price has successfully broken above the upper boundary of this consolidation channel/zone around the 4,275 - 4,280 area. This breakout is a significant bullish signal, indicating that buyers have overpowered sellers at this stage.
2. Key Price Levels & Zones
Current Price Action: The price is trading right around 4,288.49 (Ask), positioned above the previous structure.
Mixed IFC Candle: The chart points to a "Mixed IFC Candle" (likely referring to an Institutional Flow Candle or a candle indicating indecision after a move). This candle, placed near 4,290.00, suggests a momentary pause or a minor struggle at the immediate resistance before the potential move higher.
Central Zone (Resistance/Target 1): The first major resistance area, marked as the "Central Zone," is identified roughly between 4,303.00 and 4,308.00. This zone is crucial as a near-term target for buyers and a potential turning point for a bearish reversal if the rally loses steam.
Target (Target 2): The ultimate bullish target for this specific setup is clearly marked around 4,335.00.
🔭 Two Potential Scenarios (Conditions)
The analysis correctly outlines two primary paths based on how the price interacts with the immediate resistance near 4,290.00 and the Central Zone.
Scenario 1: Bullish Continuation (Condition 1 - Preferred Path)
Trigger: Price manages to close decisively above the Central Zone (4,308.00) or successfully tests the immediate support/retest zone and pushes through the Central Zone without a deep pullback.
Action: This confirms strong bullish momentum and targets the ultimate price objective.
Target: 4,335.00 (Potential extension towards 4,340.00)
Invalidation: A decisive break and close below the recent breakout level (around 4,275.00).
Scenario 2: Short-Term Pullback/Retracement (Condition 2)
Trigger: The price rejects the immediate resistance near 4,290.00 or, more likely, rejects the Central Zone (4,303.00 - 4,308.00).
Action: A pullback towards the recently broken consolidation channel's upper boundary for a retest of support (the breakout level) is expected.
Retest Zone: A likely retest area would be near 4,275.00 - 4,280.00. A successful defense of this retest zone would re-establish Scenario 1.
Risk: If the retest fails and price drops back into the consolidation channel, the bullish bias is temporarily negated, and the pair may revisit the lower end of the previous range.
💡 Trader's Mindset & Strategy
Entry Strategy: Look for entries on a successful breakout above the Central Zone (4,308.00) or, more conservatively, look for a confirmation of support holding during the anticipated retest (Scenario 2) near 4,275.00.
Risk Management: A stop-loss should be placed logically below the established breakout level (e.g., below 4,270.00) to protect against a false breakout.
Profit Taking: Partial profits can be taken at the Central Zone (4,303.00 - 4,308.00), with the remainder targeting 4,335.00.

SP500: Ready to Break Out and Forge New All-Time Highs S&P 500 indicates that the recent complex downward correction is complete, having bottomed at 6501.7.
The market is currently rallying and is testing the major upper trendline resistance. The analysis projects a minor, temporary pullback to gather momentum, potentially to the 6775.0 area. Following this consolidation, a decisive breakout above the trendline is anticipated. This will confirm the launch of a major new upward wave, expected to drive the S&P 500 to new all-time highs above 6928.
Stay Tuned :)
@Money_Dictators

This Is Why GBPUSD Could Spike Hard USD Fundamentally Broken!Hey Traders, in today’s trading session we are monitoring GBPUSD for a buying opportunity around the 1.33500 zone.
GBPUSD is trading in a clear uptrend and is currently in a correction phase, approaching the trend area at 1.33500, which acts as a key support and resistance zone.
On the fundamental side, the US Dollar remains under pressure after the Fed’s recent 25 bps rate cut, which aligns with a broader shift toward easing. With markets now hyper-focused on labor market data, any sign of softness could increase expectations for another cut. The January FOMC isn’t fully priced for additional easing yet — which leaves room for more USD weakness, supporting GBPUSD’s bullish bias.
Trade safe,
Joe.
