TradeCityPro | AVAXUSDT Analysis Buyer Resistance👋 Welcome to TradeCityPro Channel!
Let’s analyze AVAXUSDT triggers for the upcoming week and prepare for opportunities outside the global market’s regular hours to avoid chasing moves after they occur. 😊
🌍 Market Overview
First, as always, let’s glance at Bitcoin. BTC recently bounced from the 94,661 support level after a drop and is now struggling with the crucial 101,878 resistance. It also faces the psychological $100K level, which remains a significant barrier for traders.
For next week, a breakout above 101,878 could present a long opportunity. Setting a stop-buy order now with a stop loss at 98,857 might prevent missing any whale-driven moves, as the market currently aligns more with the Asian trading session.
If this resistance breaks and Bitcoin dominance drops, consider switching focus to altcoins for potential long trades. However, the next move for Bitcoin might be swift, with higher dominance and deeper pullbacks. Analyze it closely on the daily timeframe.
🕒 Weekly Time Frame
On the weekly chart, AVAX shows strong performance, rallying from $8 to $58 before this bull run. Additionally, it formed a higher low at $20.78 in 2023, a positive sign for this coin.
The trigger for a long position was the breakout above 32.48 on lower timeframes. If you’ve been following, it’s better to wait for a better entry or accept a stop loss to avoid missing out.
This weekly candle isn’t my favorite unless it turns green, confirming buyer strength for a potential hold. A new entry could be considered at a weekly breakout of 58.73, but this carries high risk and requires a wide stop loss. Lower timeframes may present better opportunities.
📊 Daily Time Frame
On the daily timeframe, AVAX recently broke 29.35 and 35.7, triggering spot buy entries. Current positions have returned 76% and 42%, respectively. These figures are shared not to induce FOMO but to encourage consistent market engagement and emotion management. Even if you miss an opportunity, other triggers will emerge.
AVAX has completely recovered from its recent drop, showcasing buyer strength, and formed a bullish V-pattern. This pattern’s breakout confirms its bullish nature. The current resistance stands at 54.01, with an additional key level at 60.37. Of these, 54.01 is the primary level to watch. Managing positions after breaking this resistance is crucial, though reactions at 60.37 are still possible.
Long-term members know this zone was previously a no-trade area. Back then, breaking 54.01 often led to stop-outs, while breaking 60.73 indicated whale activity. Depending on your risk tolerance, consider positioning accordingly. Personally, I prefer buying above 54.01 and accepting a stop loss.
🕒 4-Hour Time Frame
On the 4-hour chart, AVAX has retested its 54.01 resistance and recovered from recent corrections. A breakout above this level could continue its bullish momentum.
📈 Long Position Trigger
Long positions after the breakout are valid, with stop-buy orders and a relatively large stop loss. Above 69.14 RSI, momentum may increase significantly.
📉 Short Position Trigger
For short trades, I’d recommend holding off. As long as Bitcoin trades above 80K, I wouldn’t consider shorting. 😊
💡 BTC Pair Insight
Against BTC, AVAX has broken a significant weekly trendline and rebounded from strong support. It’s currently testing its trendline trigger, with bullish continuation expected after breaking 0.0005403 BTC. RSI above 70.35 confirms the momentum, boosting confidence in the USDT pair if the market remains bullish.
📝 Final Thoughts
Stay calm, trade wisely, and let's capture the market's best opportunities!
This analysis reflects our opinions and is not financial advice.
Share your thoughts in the comments, and don’t forget to share this analysis with your friends! ❤️
Technical Analysis

CADJPY Potential UpsidesHey Traders, in today's trading session we are monitoring CADJPY for a buying opportunity around 107.600 zone, CADJPY is trading in an uptrend and currently is in a correction phase in which it is approaching the trend 107.600 support and resistance area.
Trade safe, Joe.

TradeCityPro | EURAUD Analysis Buyers in Control👋 Welcome to TradeCityPro Channel!
Let’s step outside the crypto space to analyze the EURAUD entry triggers for the coming week, examining both technical and fundamental aspects.
🌍 Fundamental Overview
The EURAUD pair highlights the ongoing divergence between the Eurozone and Australian economic conditions. The ECB’s hawkish stance, supported by persistent inflation, strengthens the Euro, while the RBA’s dovish policies amid cooling inflation and a softening housing market weigh on the Australian Dollar.
Additionally, Australia’s dependence on Chinese demand for commodities has created vulnerabilities due to China’s weaker-than-expected industrial growth.
Geopolitical tensions, such as the Middle East conflicts, have supported the Euro, reinforcing its stability as a safe-haven currency. In contrast, Australia’s economic slowdown and labor market weakness are adding pressure on the AUD.
The balance may shift as Europe's energy prices stabilize and China introduces economic stimulus measures.
🕒 4-Hour Time Frame
On the 4-hour chart, buyer momentum is evident, particularly as the pair rebounded strongly from the 1.63584 support level after rejecting the 1.65469 resistance twice. This renewed bullish strength signals active buyers in the market.
📈 Long Position Trigger
The 1.65469 level remains a strong trigger for a long position. Breaking above this resistance with volume could target the 1.684 zone, supported by RSI confirmation at 69.96.
📉 Short Position Trigger
Despite the bullish momentum, a failed breakout or lower high near resistance could set up a short opportunity. A more reliable entry would be a breakdown of the 1.6358 support and trendline, targeting the 1.6016 level for a pullback.
The pair’s trajectory will likely depend on macroeconomic developments and shifting risk sentiment in the week ahead.
📝 Final Thoughts
This analysis reflects our opinions and is not financial advice.
Share your thoughts in the comments, and don’t forget to share this analysis with your friends! ❤️

GOLD -- Fell below 2650 with negative fundamental driversOANDA:XAUUSD continued its downward trajectory, dipping to $2,648, underpinned by adverse fundamental drivers. The key question now is whether a retracement is on the horizon or if the decline will deepen further.
Optimism about Chinese stimulus faded due to growing concerns over the U.S.-China trade war. In a closed report, the Wall Street Journal (WSJ) stated that China has begun retaliating against President-elect Donald Trump’s upcoming tariffs by implementing non-tariff measures.
The market now believes that the Fed might send a hawkish signal by indicating a pause in January after the anticipated 25 basis points (bps) rate cut at the December 17-18 policy meeting, especially following the release of higher-than-expected U.S. Producer Price Index (PPI) data.
Technically, gold remains confined within its current channel, with the consolidation phase still intact. The primary focus lies on the key support zone between 2636 and 2634, below which a large liquidity cluster could serve as a potential target for prices.
The 2636 support level could trigger a retracement, depending on forthcoming market developments. If the retracement appears shallow and prices quickly return to this level, the likelihood of a break below support increases, potentially driving prices down to levels like 2612 and 2580. However, if gold can stabilize above 2682 and consolidate above local highs, it could pave the way for a retest of higher levels.
Regards Bentradegold!

Gold is nearing the retrace area.Hey Traders, In today's session we’re closely monitoring Gold for a potential buying opportunity around the 2655 zone. The price has broken through the 2655 resistance and is now in a corrective phase, approaching a key retracement area.
Stay vigilant and trade wisely!
– Joe

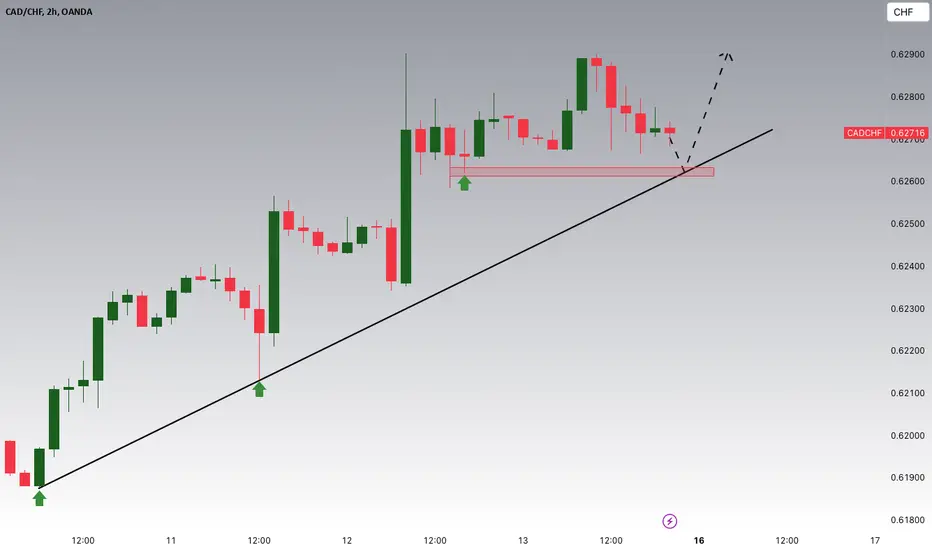
CADCHF Potential UpsidesHey Traders, in the coming week we are monitoring CADCHF for a buying opportunity around 0.62600 one, CADCHF is trading in an uptrend and currently is in a correction phase in which it is approaching the trend at 0.62600 support and resistance area.
Trade safe, Joe.
USDCHF Is Nearing An Important Support With CHF WeaknessHey Traders, in today's trading session we are monitoring USDCHF for a buying opportunity around 0.88650 zone, USDCHF is trading in an uptrend and currently is in a correction phase in which it is approaching the trend at 0.88650 support and resistance area.
Trade safe, Jie.

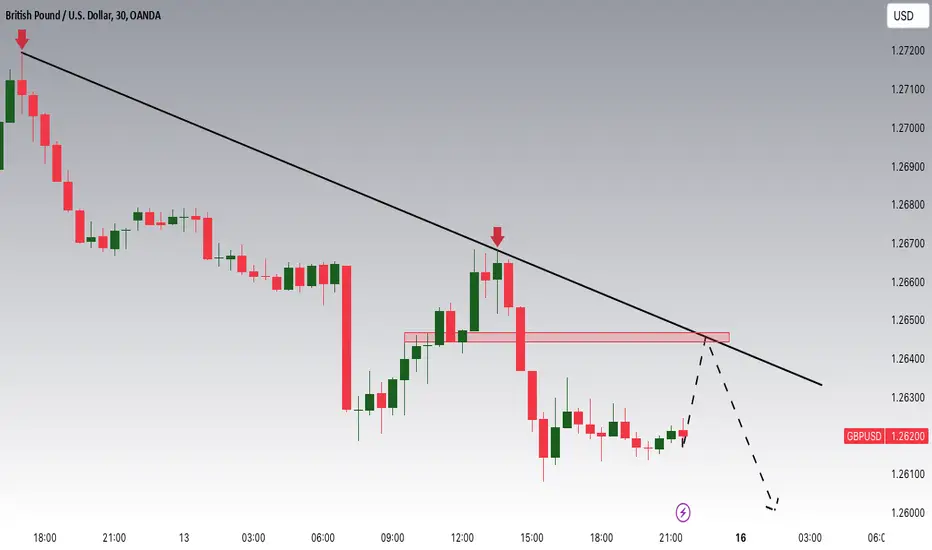
GBPUSD Is Nearing 1.26450 Resistance Along With The TrendHey Traders, in today's trading session we are monitoring GBPUSD for a selling opportunity around 1.26450 zone, GBPUSD is trading in a downtrend and currently is in a correction phase in which it is approaching the trend at 1.26450 support and resistance area.
Trade safe, Joe.
USDJPY Potential UpsidesHey Traders, in today's trading session we are monitoring USDJPY for a buying opportunity around 152.500 zone, USDJPY is trading in an uptrend and currently is in a correction phase in which it is approaching the trend at 152.500 support and resistance area.
Trade safe, Joe.

GOLD → Wedge has formed. What next?OANDA:XAUUSD consolidation has been completed as investors rush to take profits after the precious metal’s consecutive price increases, reaching the highest level in more than 5 weeks earlier in the session. Prices are currently testing the gap around 2683 - 2670 (FVG). What’s next?
Focusing on policy guidance related to the future of U.S. policies is crucial to determining the certainty of the market's next bullish wave. According to the CME FedWatch tool, there is a 98% probability that the Federal Reserve will cut interest rates at next week's policy meeting. Alex Ebkarian, CEO of Allegiance Gold, notes that the Fed is in a very difficult position as the likelihood of a rate cut next week increases, but inflation remains elevated.
From a technical perspective, gold is attempting to escape the battlefield, crossing a key resistance level. A breakout at 2687 has already been established. In theory, the development tends to push prices higher. If gold breaks out of the resistance size, it will provide distribution momentum. Conversely, prices may consolidate further. Ultimately, everything depends on the dollar.
Best regards,
Bentradegold !

GOLD--> Testing $2700: What Awaits with Upcoming PPI?OANDA:XAUUSD at the time of writing, prices are fluctuating around $2706, down 0.42% for the day, with not enough momentum to break the $2711 level.
Meanwhile, buyers seem to have paused as the market prepares for the upcoming Producer Price Index (PPI) on Thursday. This report is expected to shed more light on the Federal Reserve’s rate-cut trajectory, keeping investors cautious.
While prices are currently hovering around a minor pullback, some fundamental factors suggest that any drop may only be short-lived. Treasury yields have steadily declined throughout the year, a trend that typically supports gold. Moreover, persistent geopolitical tensions remain a strong driver for safe-haven demand, reinforcing the allure of the yellow metal.
On inflation, while consumer prices have stopped rising aggressively, they remain stable. This stability makes it almost certain that the Federal Reserve will proceed with a 25 basis-point rate cut at its December 17-18 policy meeting. In fact, traders are pricing in a 96% probability of this move, up from 86% before the recent inflation report.
From a technical perspective, gold is attempting to escape its main range, breaking key resistance. The focus is on $2700 and $2670. If buyers hold their ground in this region even after the news, prices will continue to grow in the future, as key liquidity zones remain untested. This projected growth is expected to reach levels such as $2758 and $2790.
Always stay ahead of the market with Bentradegold—your trusted source for analysis and deep insights!

NASDAQ Potential UpsidesHey Traders, in today's trading session we are monitoring NAS100 for a buying opportunity around 21700 zone, NASDAQ is trading in an uptrend and currently is in a correction phase in which it is approaching the trend at 21700 support and resistance area.
Trade safe, Joe.

EURGBP Potential DownsidesHey Traders, in today's trading session we are monitoring EURGBP for a selling opportunity around 0.83200 zone, EURGBP is trading in a downtrend and currently is in a correction phase in which it is approaching the trend at 0.83200 support and resistance area.
Trade safe, Joe.

$TXN down 15% from ATHsInteresting setup here. $200 is the target. $200c March 2025. Could see a run up into earnings JAN 28th.
WSL

GBP/USD on the Move – Will the Bulls Take Charge?OANDA:GBPUSD - 1Hr Chart
Current Price:1.27664
Executive Summary:
The price is currently trading within an ascending channel after finding support during the London session on Friday, Nov 22. A breakout above the 1.26953 level, now acting as strong support, suggests continued upward momentum toward the ultimate resistance at 1.29395, offering a potential profit of 171 pips.
Detailed Analysis:
After analysing the chart, we observed that the price found support during the London session on Friday, Nov 22, and has since been trading upward within an ascending channel. The resistance at 1.26953 was broken and now serves as a strong middle support or equilibrium. This level acts as a balancing point, where price often pauses, retests, or consolidates before continuing its trend. It works as a critical area of decision-making for traders, offering opportunities for price rebounds in an uptrend or potential breakdowns in case of bearish pressure. The price is expected to rise toward the ultimate resistance at 1.29395, as highlighted on the chart, with a potential profit of 171 pips.
Bearish Scenario:
In the bearish scenario, if significant selling pressure drives the price below the 1.26953 middle support, it could signal a potential shift in market sentiment. This middle support currently acts as a critical level, maintaining the upward momentum. A break below it may invalidate the bullish structure, leading to further declines. In such a case, the price is likely to target the next key level at the ultimate support of 1.24512. This level represents a strong foundational support where buyers might step in to stabilise the price and counteract the bearish momentum.
Key Levels to Watch:
• Middle Support: 1.26953 (Strong support and potential bounce level).
• Ultimate Resistance: 1.29395 (Target level for upward momentum).
• Ultimate Support: 1.24512 (Potential downside target if support breaks).
Thank you for taking the time to read this analysis. Wishing you the best in your trading journey! Remember to always follow proper risk management strategies to ensure long-term success in the markets. Good luck with your trades!

EURJPY Potential DownsidesHey Traders, in today's trading session we are monitoring EURJPY for a selling opportunity around 162.300 zone, EURJPY is trading in a downtrend and currently is in a correction phase in which it is approaching the trend at 162.300 support and resistance area.
Trade safe, Joe.

Gold Is Approaching An Important SupportHey Traders, in today's trading session we are monitoring XAUUSD for a buying opportunity around 2635 zone, Gold is trading in an uptrend and currently is in a correction phase in which it is approaching the trend at 2635 support and resistance area.
Trade safe, Joe.

USOIL is Near The UptrendHey Traders, in tomorrow's trading session we are monitoring USOIL for a buying opportunity around 70.60 zone, USOIL is trading in an uptrend and currently is in a correction phase in which it is approaching the trend at 70.60 support and resistance area.
Trade safe, Joe.

AAVE/USDT 4-Hour Chart Analysis- Trend Analysis: The AAVE/USDT pair is currently in an uptrend, as indicated by the series of higher highs and higher lows. The price has recently broken above several key resistance levels, now acting as support.
- Support Levels:
$344.42: Previous resistance turned support after the breakout.
~$332.81: Fibonacci retracement level at 0.236.
~$323.56: Fibonacci retracement level at 0.382, which has also acted as support in the past.
- Resistance Levels:
~$389.06: Current price level, acting as immediate resistance.
~$397.51: Next psychological resistance, slightly above the current price.
- Fibonacci Retracement Levels:
The chart shows Fibonacci retracement levels drawn from the recent swing low at $246.10 to the swing high at $397.51.
Key levels include:
0.236 at $332.81
0.382 at $323.56
0.5 at $315.06
0.618 at $306.23
0.786 at $293.42
- Volume: There's a noticeable increase in volume during the uptrend, indicating strong buying interest. Volume spikes are particularly evident at breakout points.
- Moving Averages:
The chart includes moving averages, which are not explicitly labeled but seem to be guiding the price action, with the price staying above these averages during the uptrend.
- Strategy:
-- For Buyers: Consider buying on pullbacks to the support levels, especially if the price holds above the $344.42 mark. Keep an eye on the volume for confirmation of buying interest.
-- For Sellers: Wait for a clear break below the $344.42 support to target lower levels, possibly aiming for the Fibonacci retracement levels as potential targets.
- Risk Management:
Always use stop-loss orders below key support levels for long positions to manage risk.
For short positions, set stop-losses above resistance levels to protect against unexpected breakouts.
- Outlook:
Bullish if the price maintains above $344.42, with potential targets at $397.51 and beyond.
Bearish if the price breaks below $344.42, with initial support at $332.81 and further potential downside to $323.56.
Note : This analysis is based on current market conditions and should not be considered as financial advice. Always do your own research or consult with a financial advisor before making trading decisions.
This text provides a detailed analysis of the AAVE/USDT chart, focusing on key technical levels, trends, and potential strategies for traders, which can be useful for those looking at this chart on TradingView or similar platforms.

SWING IDEA - THE RAMCO CEMENTS Ramco Cements , one of India's leading cement manufacturers, is showing a promising swing trade setup with compelling technical signals.
Reasons are listed below :
Cup and Handle Pattern Breakout : The price is breaking out from a classic cup and handle pattern, which indicates a continuation of the upward trend.
1050 Resistance Zone : This level has been tested multiple times and is now showing signs of a breakout, suggesting strong bullish sentiment.
2.5+ Year Consolidation Break : The stock is emerging from a prolonged consolidation phase, which often signals a significant trend reversal or continuation.
Bullish Engulfing Candle : A bullish engulfing candle on the daily timeframe highlights strong buying momentum.
Target - 1150 // 1215 // 1340
Stoploss - weekly close below 925
DISCLAIMER -
Decisions to buy, sell, hold or trade in securities, commodities and other investments involve risk and are best made based on the advice of qualified financial professionals. Any trading in securities or other investments involves a risk of substantial losses. The practice of "Day Trading" involves particularly high risks and can cause you to lose substantial sums of money. Before undertaking any trading program, you should consult a qualified financial professional. Please consider carefully whether such trading is suitable for you in light of your financial condition and ability to bear financial risks. Under no circumstances shall we be liable for any loss or damage you or anyone else incurs as a result of any trading or investment activity that you or anyone else engages in based on any information or material you receive through TradingView or our services.
@visionary.growth.insights

Risk-On or Risk-Off? Stocks vs. Bonds Introduction:
With stocks reaching new all-time highs and market sentiment edging into euphoria, it's an opportune time to revisit a classic risk-on/risk-off indicator: the ratio between stocks AMEX:SPY and long-term bonds NASDAQ:TLT . This ratio provides a clear view of investor sentiment:
Risk-On: When SPY outperforms TLT, investors favor equities for their higher potential returns.
Risk-Off: When TLT outperforms SPY, it reflects rising risk aversion and a move toward safer assets like bonds.
Analysis:
Uptrend Intact: Currently, the SPY-to-TLT ratio remains in a clear uptrend, defined by a series of higher-highs and higher-lows. This sustained upward momentum signals continued confidence in equities.
Ascending Channel: The ratio is also rising within an ascending price channel, a bullish continuation pattern. As long as this structure holds, the market can be interpreted as firmly in risk-on mode.
What to Watch:
Channel Support: A breakdown below the channel’s lower boundary would be the first sign of caution.
Higher Highs: If the ratio continues to push upward, it would confirm further bullish sentiment in equities.
Conclusion:
The SPY-to-TLT ratio is a key barometer for risk appetite, and its sustained uptrend within the ascending channel is a clear signal of the market’s risk-on posture. As long as this trend holds, equities remain in a favorable position. However, traders should stay vigilant for any signs of a breakdown, which could hint at rising market caution. Are you aligned with this risk-on outlook, or do you see potential cracks forming? Share your thoughts below!
Charts: (Include charts showing the SPY-to-TLT ratio, the ascending price channel, and key trendlines for support and resistance)
Tags: #SPY #TLT #RiskOn #RiskOff #Stocks #Bonds #TechnicalAnalysis #MarketTrends

EURUSD: Bearish Trading Dominates!EUR/USD fell again on Friday, dropping another 0.5 percent to drop below 1.0500.
Fiber fell slightly for the fifth consecutive trading day after the European Central Bank cut interest rates by another 25 basis points, with overall market sentiment remaining firmly in the greenback on the day, making EURUSD even more difficult.

Gold Trading Idea: Is a New ATH on the HorizonGold prices took a breather on Thursday, snapping a four-day rally and dropping over 1%. This pullback comes amid mixed US economic data, with softer-than-expected job reports and higher producer prices creating uncertainty. Profit-taking ahead of next week’s Federal Reserve meeting further pressured prices, with XAU/USD currently trading around $2,684.
Fundamental Insight
Despite the recent dip, Gold remains a safe haven asset in the face of geopolitical tensions and central banks’ dovish monetary stance. The European Central Bank’s third consecutive rate cut and expectations of the Federal Reserve reducing rates by 25 basis points next week could set the stage for renewed upside momentum.
As we edge closer to year-end, political tensions and easing monetary policies globally could fuel Gold’s potential to challenge new all-time highs.
Technical Outlook
On the charts, Gold respected the $2,720 key level, forming a double-top pattern reminiscent of a "batman face." Key levels to watch are:
Resistance: $2,720
Support: $2,689 and $2,610
A break above $2,720 could signal a bullish continuation, while a dip to $2,610 may offer a strong buying opportunity for long-term traders.
Stay tuned for more trading insights and strategies!
