Gold Is Entering a Danger Zone—A Sharp Drop May Hit Before....📌 SETUP SIGNAL (GOLD – 4H)
Strategy: Sell the Downward Channel – Follow the Correction
1️⃣ Sell Setup
Entry: 4188–4175 (after a confirmed 4H close below 4188)
Stop-Loss: 4240
Take Profit:
TP1: 4120
TP2: 4050
Main Target: 4000–3990
Reason:
- Price is moving cleanly inside a descending correction channel.
- Repeated sell-offs + weak bullish reactions show sellers are still in control.
- Breaking 4188 confirms continuation toward the lower liquidity zone.
2️⃣ Alternative Scenario (Low Probability)
Bullish invalidation: Only if price breaks above 4280 (4H close).
→ Then the market may shift upward toward 4365–4370 liquidity.
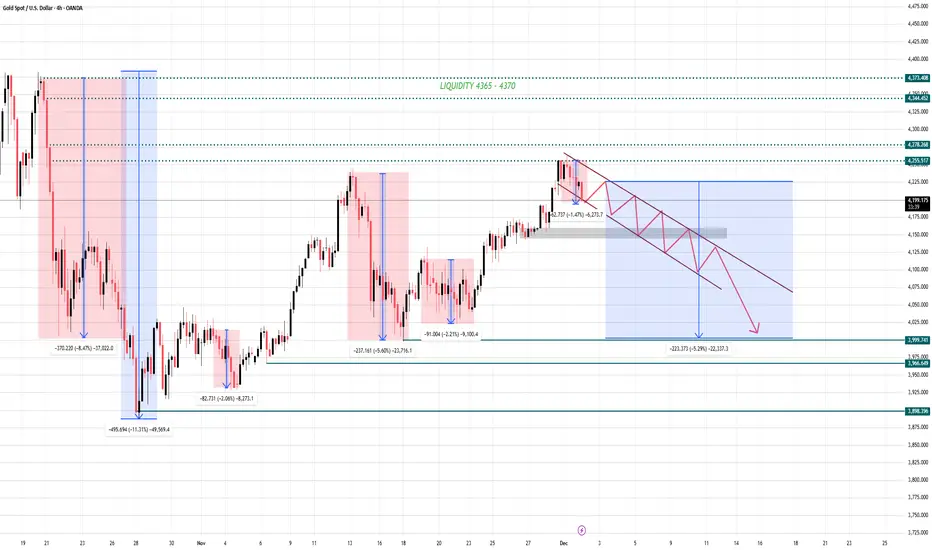
📉 QUICK MARKET OUTLOOK – GOLD 4H (Rejection + Bearish Channel Forming)
Based on the current 4H structure, Gold is showing a clear pattern of repeating deep corrections every time it reaches major resistance/liquidity zones.
The latest price action continues to repeat this same behavior:
Key Observations
- Price has once again rejected strongly from the 4270–4280 zone (same rejection region as previous drops).
- A descending bearish channel is forming → indicating controlled distribution.
- The recent downward legs are consistent with past moves:
-8.47%, -11.31%, -5.60%, -2.21% → the market has a clear history of sharp sell-offs.
- Current structure suggests a continuing corrective wave until deeper support.
📌 Bearish Scenario (High Probability)
Price continues moving inside the descending channel and breaks the short-term support.
Targets → 4120 → 4050 → 4000
Major liquidity & demand zone sits at 3990 – 3980
→ where large buyers historically step in.
If panic selling accelerates, price may extend toward: → 3888 – 3900
📌 Bullish Scenario (Low Probability)
Only activated if Gold breaks OUTSIDE the descending channel and reclaims: → 4280
This invalidates the bearish outlook and reopens the path to 4365 – 4370 liquidity.
🎯 FINAL CONCLUSION
Gold is currently in a corrective downtrend, moving exactly within a well-defined bearish channel.
Unless buyers break the structure, the market is likely heading for deeper retracement toward the 4000 zone before any meaningful bullish continuation.
"Stay patient. Stay disciplined. Let the market come to your levels."
Technical Analysis
XAG/USD 2H: High-Probability Sell Entry at Drop-Base-Rally (BRD)📈 XAG/USD 2H: High-Probability Long Entry at Drop-Base-Rally (DBR) Demand Zone
📝 Market Context: Bullish Trend and Retracement
The overall trend for Silver (XAG/USD) is strongly bullish, driven by fundamental factors like tight physical supply and expectations of future US interest rate cuts. The chart shows price has been moving sharply higher, but has recently experienced a significant and necessary pullback from its high. This pullback is being treated as a correction to gather new demand before continuing the primary upward trend toward potential targets like $60 - $65 per ounce.
The current price action has approached a critical area that served as the launchpad for the prior bullish impulse.
🔑 Technical Focus: Unmitigated Demand and Entry Confirmation
The analysis highlights two key zones: a high-quality Demand Zone and the last area of consolidation before the final breakout.
1. Drop-Base-Rally (DBR) Demand Zone 🟢
Zone Location: The green shaded box, spanning approximately $54.00 to $54.50.
Significance : This area is identified as a fresh Demand Zone. It conforms to the Drop-Base-Rally (DBR) structure, where an initial drop was followed by a period of consolidation (the Base), before buyers aggressively took control, leading to the strong rally (the Rally). This zone is considered a Reversal Zone where institutional buy orders are expected to remain unmitigated.
Action Plan: This is the high-probability area to initiate a long (buy) position, anticipating a strong rebound.
2. Liquidity & Stop-Loss Target (Bottom Green Zone)
Zone Location: The lower green box, around $53.50 to $53.80.
Significance : This zone may represent the ultimate base of the prior move. The price of Silver is known for high volatility. Placing the Stop Loss (S/L) safely below this zone (e.g., below $53.50) is crucial to protect the trade from a potential "liquidity sweep" or deeper structural break, providing a healthy buffer.
📊 Trade Plan: Sell the Dip
Trade Direction: Short (SELL)
Entry Strategy: Wait for price to enter the DBR Demand Zone (around $54.00 - $54.50). Confirmation is highly recommended, such as monitoring for a clear bullish reversal pattern (like an engulfing candle or a double bottom) on a lower timeframe (e.g., 30M or 1H) before entry.
Stop Loss (S/L): Place S/L below the entire demand structure, for example, below $53.50.
Take Profit (T/P) 1: The first target is the level of the most recent high that initiated the current drop (a retest of the supply that caused the current pullback).
Take Profit (T/P) 2: A higher-level target is the prior swing high at $56.00, or pushing towards the psychological $60 per ounce level, which is a common projection based on current market dynamics.
⚠️ Risk and Fundamental Caveats
While the technical setup is strong, Silver is highly volatile. Traders must closely monitor upcoming US economic data, as stronger-than-expected US reports could delay expected Fed rate cuts and put temporary downward pressure on non-yielding assets like Silver.
Invalidation: A decisive close below the Stop Loss area (below $53.50) would invalidate this long trade idea, signaling a deeper correction or a structural shift.

EUR/JPY 30M: High-Probability Short Setup & Supply Reversal Zone📉 EUR/JPY 30M: High-Probability Short Setup at Supply Reversal Zone
📝 Market Overview and Trend Context
The EUR/JPY pair is currently in a phase of strong recovery following a significant drop from a prior high established around the 181.400 level. This sharp, corrective rally (indicated by the upward price action starting December 2nd) is now approaching a critical area of unmitigated institutional supply.
The analysis focuses on exploiting the expected resumption of the selling pressure from this proven zone, treating the current bullish move as a deep retracement into an area where prior sellers initiated their positions.
🔑 Key Zones for Institutional Order Flow
The chart highlights two confluent zones that form the basis of the short hypothesis:
1. Reversal Zone / Volume Burst 🔴
Zone Location: This is the combined area (green and light-red boxes) spanning approximately 181.250 to 181.400.
Significance: This area is the precise origin of the prior sharp move down, making it a high-quality Supply Zone where a large concentration of selling orders is expected to reside.
The lower part, labeled "Reversal Zone", is the critical price level where resistance is first expected.
The upper part, "Volume Burst", represents the last opportunity for sellers to defend the price before the structure is broken.
Technical Confluence: The prior structural high is situated just above this zone, making it a key area of defense for existing sellers and a target for liquidity grabs.
2. Order Flow Origin (OFR)
Location: The level around 180.400.
Significance: This marks the point from which the previous aggressive move originated. While not an immediate target, a successful short trade from the supply zone would ultimately aim to break this lower structural point, confirming a shift in market control back to the bears.
📊 Trading Hypothesis: Shorting the Supply Test
The trade plan anticipates a rejection from the institutional supply zone:
Direction: Short (Sell)
Entry Strategy: Entry is optimal upon price tapping the Reversal Zone (starting around 181.250). Crucially, the chart demands a "Bearish Pattern Must" confirmation. This means traders should drop to a lower timeframe (e.g., 5M or 15M) and wait for a clear bearish reversal pattern (e.g., bearish engulfing candle, a double top on the smaller timeframe, or a break of minor structure) before initiating the short trade.
Stop Loss (S/L): The Stop Loss must be placed securely above the entire Volume Burst area (e.g., above 181.450). This placement protects the trade against a clear invalidation of the supply structure.
Take Profit (T/P) 1 (Initial Target): A strong initial target is the current swing low or the next clean demand zone, typically in the 180.700 area.
Take Profit (T/P) 2 (Continuation Target) : If price aggressively breaks T/P 1, the ultimate target is a run towards the OFR low around 180.400, confirming a full reversal of the recent bullish momentum.
⚠️ Risk Management and Invalidation
The greatest risk to this setup is the continuous bullish momentum breaking the prior high. A confirmed close above the Volume Burst zone (181.400) would signal a continuation of the bullish trend and invalidate the short setup. Adherence to the "Bearish Pattern Must" entry condition is paramount for reducing risk and avoiding false early entries.

EUR/GBP 2HR: Anticipating a Reversal from Fresh B-R Supply Zone📉 EUR/GBP 2H: Anticipating a Reversal from Fresh B-R Supply Zone
📝 Overview & Market Context
The EUR/GBP chart is currently illustrating a strong bullish trend on this intermediate timeframe, characterized by a series of higher highs and higher lows. The price has been rising and is now approaching a significant historical level of supply that previously acted as a strong turning point.
The core idea is to identify the origin of the last major bearish drop and wait for the price to retrace into that unmitigated zone for a high-probability short entry, aligning with the concept that supply areas often contain large, pending sell orders from institutional players.
🔑 Key Technical Zones
The analysis highlights three critical price zones based on Supply and Demand principles:
1. B-R Supply (Break-Rally Supply) 🔴
Zone: The large red box spanning approximately 0.87500 to 0.87800.
Significance: This zone represents a fresh, unmitigated supply area—the origin of a prior decisive price drop. The pattern appears to be a Rally-Base-Drop (RBD) or a Break-Rally formation, where buyers absorbed price into a base before sellers took over, causing an aggressive move down.
Trading Thesis: This is the high-probability entry zone for a short position, as institutional sell orders are expected to still reside here. The psychological level of 0.87500 also provides a confluence point for resistance.
2. Demand Entry Origin (D-R-D) 🟢
Zone: The green box around 0.87100 to 0.87200.
Significance: This area acted as a Demand Zone (likely a Drop-Base-Rally or D-R-D base) that launched the current rally. This confirms that the buyers driving the current move are active, but it also provides a potential first Take Profit (T/P) target for the anticipated short trade. A break below this would likely confirm a major bearish reversal.
3. Confirmation/Invalidation Level 🔵
The level marked just below the B-R Supply Zone acts as a confirmation level. A decisive break and close above the entire red supply zone would invalidate the bearish trade setup, indicating that buyers have overwhelmed the institutional supply at this level.
📊 Trade Plan: Shorting the Retracement
Trade Direction: Short (Sell)
Entry Strategy: Wait for price to enter the B-R Supply Zone (0.87500 - 0.87800). Entry should be confirmed by a price action rejection signal, such as an engulfing candle or a pin bar, on a lower timeframe (e.g., 15M or 30M) to minimize risk.
Stop Loss (S/L): Place the Stop Loss just above the distal (furthest) boundary of the B-R Supply Zone (e.g., above 0.87850) to protect against a complete structural break higher.
Take Profit (T/P) 1: The Demand Entry Origin (D-R-D) at 0.87150, offering a quick risk/reward opportunity.
Take Profit (T/P) 2: A lower structural low, targeting areas around 0.86800 if the move proves to be a full trend reversal.
🌐 Fundamental Note
The EUR/GBP pair is primarily influenced by the monetary policies of the European Central Bank (ECB) and the Bank of England (BoE), alongside UK-EU economic ties. Divergence in interest rate expectations or unexpected economic data releases (like UK GDP or Eurozone Industrial Production) could accelerate or invalidate this purely technical setup.
This technical analysis provides a framework for entry; however, confirmation from price action and awareness of fundamental releases are crucial for risk management.
To understand how to correctly identify and use Supply and Demand zones for higher probability trades, you may want to watch this video on How to Master and Trade Supply and Demand.

EUR/USD 30M: Targeting a Mini Zone for a Bullish Continuation🚀 EUR/USD 1H/30M: Targeting a Volume Burst Zone for a Bullish Continuation
🎯 Key Analysis: Seeking Long Entry from Demand
This analysis focuses on the EUR/USD pair on the 1-hour chart (labeled as 1H in the corner, but the title references 30 Mints Analysis—suggesting the core idea is for intraday trading based on a higher timeframe structure). The core strategy is to identify a high-probability Demand Zone after a major market event (the prior spike) and anticipate a bullish continuation.
📉 Prior Price Action and Market Context
The chart shows a significant price movement just before the analysis period:
Strong Upward Move: Price saw a sharp, aggressive rally, creating a new swing high.
Order Flow Reversal (OFR): Following the rally, the price experienced an equally sharp, deep pullback. The level labeled "OFR" (likely standing for Order Flow Reversal or the initiation point of the pullback) marks the immediate distribution that occurred after the high was printed.
Current Status: Price has stabilized following the sharp drop and is now consolidating just above the identified entry zone.
💡 The Bullish Setup: Mini Reversal Zone (Demand)
The trade hypothesis is based on price pulling back into a high-quality demand zone before moving higher.
1. Volume Burst / Mini Reversal Zone (Demand Entry) 🟢
Zone Location: The primary interest zone is the green shaded box, spanning approximately 1.15900 to 1.16050.
Significance: This area is the "Mini Reversal Zone" which coincides with a "Volume Burst" zone. This suggests it's the origin of the aggressive buying that launched the previous rally (the base of the strong move).
Action Plan: This zone is anticipated to be a high-probability area for buyers to step in again, absorbing the selling pressure from the current pullback.
Target Entry: Entry is suggested near the upper boundary of this zone, specifically around 1.16000 (a psychological level) or slightly below, maximizing the risk/reward ratio.
2. The "Need Pattern" 📈
The chart indicates a "Need Pattern" arrow pointing into the entry zone. This suggests the analyst expects a specific candlestick pattern (e.g., an engulfing candle, pin bar, or double bottom) or a clear shift in lower timeframe momentum within this zone to confirm the long entry.
📈 Proposed Trade Plan & Target
Direction: Long (Buy)
Entry: Wait for price to enter the Mini Reversal Zone (~1.16000 - 1.16050) and confirm with a bullish pattern ("Need Pattern").
Stop Loss (S/L): Place the Stop Loss safely below the Volume Burst zone (e.g., below 1.15850) to protect against continuation of the bearish move.
Take Profit (T/P) : The initial target would be a retest of the prior high, or a move back to the OFR level (around 1.16250 - 1.16300) for a strong risk/reward. The long-term target is a break of the previous high, as shown by the upper arrow.
⚠️ Risk Disclaimer
This is a counter-trend move relative to the sharp pullback. Traders must wait for confirmation (the "Need Pattern") in the Mini Reversal Zone to manage risk effectively. Failure to hold the demand zone could signal a deeper move down.

USD/JPY Analysis : Potential Reversal & Supply From Target Zone 📈 USD/JPY 1H: Potential Reversal and Supply Retracement Play
🔑 Key Context: Bearish Trend with Demand Zone Reaction
The chart initially shows a strong downward trend or significant pullback, characterized by lower swing highs and lower swing lows on the 1-hour chart. This bearish movement breached a prior low established around November 27th.
Prior Structure: Price fell sharply, breaking below a level that was part of a previous consolidation or minor distribution phase (the area marked 'D-R Supply' boundary).
Current Action: The price has recently made a strong low and is now showing signs of an aggressive move back up (a recovery rally).
🎯 Identifying Key Zones
The analysis highlights three critical zones based on supply/demand and technical structure:
1. Reversal Zone (Demand) 🟢
This is the lowest green box, around 154.650 - 154.800.
Significance: This zone acted as a strong Demand area, causing the significant bullish reversal/bounce we are currently seeing. It's the point where buyers stepped in aggressively, stopping the immediate bearish momentum. The low of the move touched the upper boundary of this zone before the strong rally began.
2. D-R Supply (Drop-Base-Drop/Rally-Base-Drop Supply) 🔴
This is the overall consolidation area that was previously broken, roughly between 155.600 and 156.400.
Significance: This large area represents where a significant amount of selling pressure entered the market, leading to the large drop. The current move upward is likely a retracement back into this supply structure.
3. Target and Volume Burst Zone 🔵 & 🟢
Target (Blue Box): This level, around 156.350 - 156.450, appears to be the immediate objective for the current bullish move. It lines up with the bottom of the old consolidation area (the D-R Supply).
Volume Burst (Top Green Box): This zone, from approximately 156.450 to 156.650, represents the upper part of the broken supply zone. This is a potential high-probability area where the initial sellers are likely to defend their positions, leading to a strong reaction (a "Volume Burst" of selling/distribution).
💡 Trading Hypothesis: Retracement to Supply
The current price action suggests the following trade setup:
Scenario : The bounce from the Reversal Zone (Demand) is expected to continue as a retracement to test the broken D-R Supply zone above.
Entry: Traders who entered at the Demand Reversal Zone would be looking to hold the position. New entries might look for continuation patterns to join the current rally.
Take Profit: The Target (blue box) and the lower part of the Volume Burst zone are key areas for taking profit on long positions, as price is expected to encounter significant resistance there.
Continuation/New Trade: Once the price reaches the Volume Burst area, a new short trade setup could be considered, anticipating a rejection and resumption of the overall bearish bias or a continuation of the downtrend from that high-resistance level.
⚠️ Caveats and Confirmation
The current rally needs to maintain momentum and successfully break above the CZ (Confirmation Zone) level marked around 156.000 to confirm the target is achievable.
Failure to sustain the rally above the 156.000 area could indicate a shallower retracement or a potential double-bottom/range setup.
Risk Management: Any long trade should place a stop-loss below the Reversal Zone low.

USDCAD: Another Bullish Confirmation 🇺🇸🇨🇦
A quick follow-up for the yesterday's post for USDCAD.
I see another bullish pattern on a 4H time frame now.
The price formed a cup & handle pattern and broke its neckline.
I still expect a move up to 1.402
❤️Please, support my work with like, thank you!❤️
I am part of Trade Nation's Influencer program and receive a monthly fee for using their TradingView charts in my analysis.

BTCUSDT 30M Analysis: Reverse Zone Re-Test Before Major Drop 📊 BTCUSDT 30-Minute Technical Analysis – Reversal Zone Under Pressure
This 30-minute BTCUSDT chart highlights an important bearish setup forming after a sharp downside move. Bitcoin is currently consolidating near a Reversal Zone, suggesting that price may attempt a retest before continuing lower.
🔻 Market Structure Overview
Bitcoin recently experienced:
A strong impulsive sell-off
A brief consolidation phase
A minor recovery back into a previous support now acting as resistance
This structure indicates that sellers are still in control.
🟥 Reversal Zone (Major Resistance Area)
The highlighted red zone is the primary bearish reaction area.
Why this zone matters:
Price broke below this level with strong momentum
It is now acting as a potential supply zone
A bearish candlestick pattern in this area would confirm sellers stepping in
Your chart clearly notes: “Bearish Pattern Need On That Zone.”
A rejection here is the most important bearish confirmation.
🟦 Mini Reversal Zone (Previous Demand Area)
Below current price sits a smaller demand zone.
This zone previously showed:
Buyer reactions
Short-term reversals
Support in the recent downtrend
If price breaks below this mini zone, BTCUSDT may aim for deeper liquidity levels, confirming bearish continuation.
📉 Expected Price Behavior
Based on the projected path drawn on your chart:
Price will retest the Reversal Zone
A bearish engulfing, pin bar, or rejection wick may form
Price may drop aggressively after confirmation
Final target is a deeper zone around the previous swing lows
The downward arrow illustrates the expected continuation if bulls fail to defend nearby support.
⭐ Key Takeaways
Bitcoin remains in a bearish structure on the 30M timeframe
A strong bearish pattern in the Reversal Zone is required for confirmation
Rejection from this resistance may trigger another downside wave
Break and hold above the zone would invalidate the short-term bearish outlook
🧠 Short Summary for Minds
Bitcoin is approaching a key Reversal Zone on the 30-minute chart. If a bearish pattern forms here, BTCUSDT may continue dropping toward lower support levels. Sellers remain strong unless bulls break above the resistance zone.

Gold Holds Its Breath Ahead of PMI: Breakout or Breakdown?If I had to describe gold right now, I’d call XAUUSD a “predator hiding in the bushes” — no longer in a wild breakout phase, but quietly waiting, watching, and preparing for the next news-driven move.
In terms of fundamentals, the market is awaiting the U.S. ISM Manufacturing PMI, forecast at 49.0, slightly higher than the previous 48.7, but still below the 50 threshold . In other words, the U.S. manufacturing sector is expected to look “less bad,” but not strong enough to change the bigger picture. With that backdrop, neither the USD nor gold has a solid reason to break out before the data — sentiment is simply: wait for the actual numbers, then move.
On the H4 chart, gold is pressing against the upper trendline, right at the 4,300–4,310 resistance zone , while support sits below at the 4,220 level overlapping the rising trendline and the Ichimoku cloud . These two areas form a natural “price box”: the top attracts profit-taking from buyers, the bottom attracts fresh dip-buyers — a classic setup for a healthy sideway accumulation phase.
My preferred scenario: XAUUSD may continue oscillating between 4,220–4,310, where spikes toward 4,30 tend to trigger selling, while dips to around 4,22 draw in buyers. As long as price does not clearly break out of either boundary, I consider this a sideway market within a larger bullish structure , ideal for trading the range rather than trying to predict the next breakout.

XAUUSD – Bullish Structure Holding Above EMAsXAUUSD – Bullish Structure Holding Above EMAs
Gold continues to trade in an upward structure, with price respecting both the 7-EMA and 21-EMA on the 15-minute chart. Momentum remains constructive as buyers maintain control above the intraday trendline and volume supports the ongoing push.
The setup highlights a potential continuation zone, with price consolidating above key EMAs and forming higher lows. As long as structure holds, the market may look for liquidity toward the next intraday highs.
This idea focuses on the current price behavior, EMAs alignment, and bullish market sentiment—not financial advice.

XAUUSD Analysis - Trendline Rejection & Potential Bounce Setup📊 XAUUSD 30-Minute Technical Analysis – Trendline Pressure & Key Demand Zone
This 30-minute XAUUSD chart shows gold currently trading under a clear descending trendline, indicating short-term bearish pressure. Price has rejected the trendline multiple times, confirming sellers are still active in the market.
🔻 Current Market Structure
Gold is forming lower highs and lower lows, respecting the downtrend structure. Recent candles show rejection from the trendline once again, suggesting a potential continuation toward the lower support zone.
🟦 Mini Reversal Zone (MRZ)
A key short-term demand area exists between 4,190 – 4,185 (marked in blue).
This zone has previously acted as a minor support, and the price may attempt a temporary bounce from here.
🟩 Major Demand Zone / Volume Burst Area
The stronger reversal area sits below the MRZ, highlighted in green.
This is where the chart indicates:
High buying volume previously entered the market
Bullish reactions were seen earlier
The next impulsive leg may start once price enters this volume burst zone
This zone will be crucial for spotting bullish reversal patterns, such as:
Bullish engulfing
Pin bar / hammer
Break and retest setups
🔍 What We Need
Inside the marked demand zones, we need a positive bullish pattern to confirm buyer strength. Entering without confirmation may be risky due to ongoing trendline resistance.
📉 Expected Price Path
The projected price movement shows:
A drop from current levels toward the MRZ
A potential short pullback
Final sweep into the Volume Burst Zone
A possible bullish reversal from that deeper area
If a strong bullish pattern forms in the green zone, buyers may push back toward the trendline and possibly attempt a breakout.
⚠️ Important Notes
Trendline remains the immediate barrier for buyers
Bearish continuation is possible until the deeper support zone is tested
Only bullish confirmation patterns can validate a reversal
✅ Short Summary (For Minds / Social Posting)
Gold is still under bearish pressure on the 30M chart, moving inside a descending trendline. Price is expected to test the Mini Reversal Zone and possibly drop deeper into the Volume Burst Demand Zone. A bullish reversal is only valid if a strong positive pattern forms in these areas.

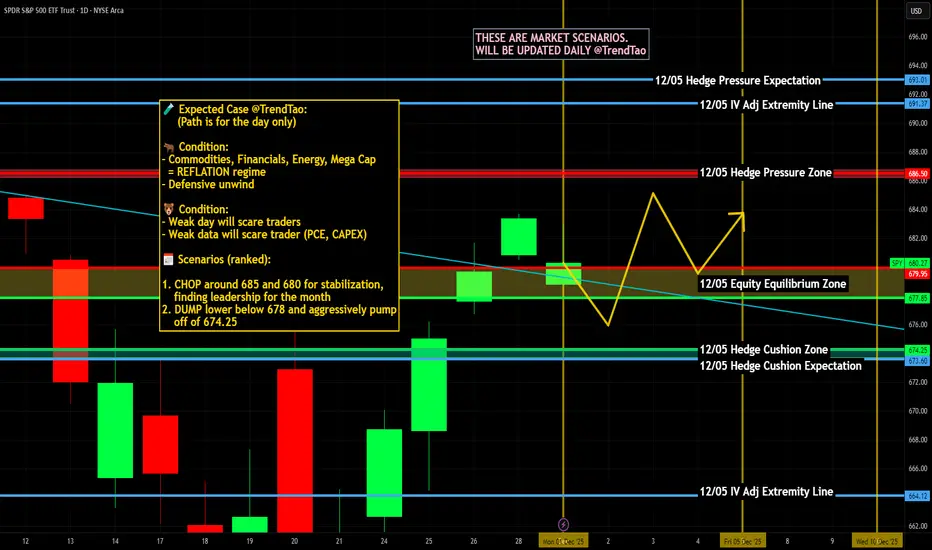
$SPY & $SPX Scenarios — Tuesday, Dec 2, 2025 🔮 AMEX:SPY & SP:SPX Scenarios — Tuesday, Dec 2, 2025 🔮
🌍 Market-Moving Headlines
🎤 Bowman testimony hits at 10 AM — this is the only fixed macro event of the day, and her tone on regulation and economic conditions can nudge yields.
🚗 Auto Sales (Nov) TBA — release time unclear, but this report can move cyclicals if it prints far from expectations. Previous level was 16.4 million annualized.
📊 Key Data and Events (ET)
10 00 AM
• Fed Vice Chair for Supervision Michelle Bowman — Testimony
TBA
• Auto Sales (Nov)
Previous: 16.4 million
Note: Release time is not announced
⚠️ Disclaimer: For educational use only, not financial advice.
📌 #SPY #SPX #stocks #macro #fed #autosales #markets #trading #investing
XAUUSD: Bearish Correction Targets $3822 amidst Uptrend.Scenario: Bearish Corrective Move within a larger Uptrend.
Current Price (Approx.): $4,218.81
Chart Context: Price has already retraced from the recent high of $4,381.73 and is currently hovering near the 0.236 Fibonacci Retracement ($4,249.74) and above the 0.4 Fibonacci Retracement ($4,158.02).
Key Levels
Key Resistance Zone (Potential Reversal): $4,338 (Close to the recent high/start of the pullback).
Primary Target (Take Profit): $3,822 (Coincides with the 1.0 Fibonacci Retracement level of the structure shown, indicating a full retracement of the move from $3,822.46 to $4,381.73).

XAUUSD — Long-Term Bullish Structure Toward 4708.76Market Structure
Gold remains in a strong long-term bullish trend, supported by higher-timeframe momentum and repeated accumulation phases. The current price action is consolidating above major structural supports, keeping the long-term upside target 4708.76 valid.
Key Support Zones
Key Support Zone 1 — 3839
This is the primary structural floor. As long as price holds above 3839, the bullish trend remains intact and the path toward the higher target stays open.
A clean bounce from this zone would reinforce the bullish continuation.
If 3839 Breaks — Key Support Zone 2 — 2775
A decisive breakdown below 3839 would signal a deeper correction toward the secondary support at 2775.
This zone represents a major historical demand area, where large-scale buying interest is expected to reappear. A hold above 2775 would maintain the long-term bullish macro outlook.
Main Target
4708.76
This is the projected long-term extension target based on the broader impulse wave. As long as gold stays above 3839, the probability of reaching this upper target remains high.

MRVL long-term TAMarvell looks somewhat different than the other semis, weekly accumulation just started to enter the positive territory and there's currently a trampoline on mid-term, which means technically the price should go higher. Watch the blue line for support level to hold.

NVDA long-term TANvidia is still keeping up the long-term uptrend but the mid-term is currently in distribution since the last couple of weeks, so let the news won't surprise you, it's healthy for Nvidia to fall lower and that's what it been doing recently. Some time is needed for Nvidia to bottom out, while long-term remains bullish, the mid-term is yet bearish.

NVO long-term TAThere's a good chance that Novo Nordisk will shine again! Technically speaking the volumes and the indicators have not turned bullish yet, but despite of the long downtrend the indicators have been improving for quite some time, weekly accumulation is rising steadily, which signals positive divergence, the current area of $40-45 is good for the support and potential new uptrend in the process. Can it dive even lower? Sure it can but that will push the divergence even higher. In short, keep an eye on NVO.

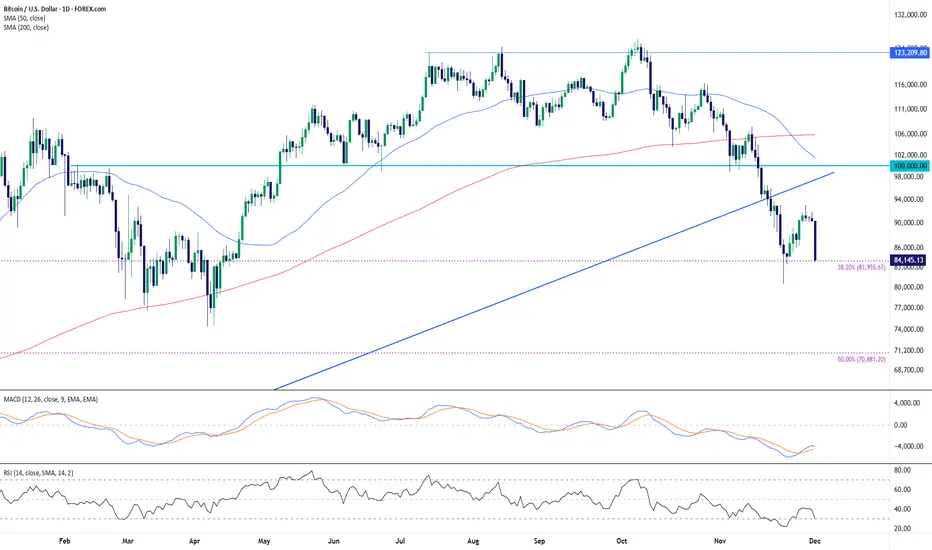
Bitcoin Extends Decline Toward Fibonacci Support as Momentum RemBitcoin continues to trade under clear downside pressure after breaking beneath its long-standing ascending trendline in November. The recent rebound attempt stalled near the underside of that same trendline—now acting as dynamic resistance—and price has since rotated lower again.
The broader structure shifted bearish once price fell below the 50-day SMA and 200-day SMA, both of which are now flattening or turning lower. This places the market in a momentum-cooling environment where sellers remain in control unless a sustained recovery develops above key moving averages.
The chart also highlights confluence around the 38.2% Fibonacci retracement level drawn from the major swing low, which sits near the latest reaction zone. The initial bounce from this area shows that participants are aware of the level, though the follow-through remains limited for now.
Momentum indicators reflect persistent weakness. The MACD remains in negative territory, with both signal lines tracking below zero and only modest signs of stabilization. RSI recently dipped into the 30-zone before attempting to lift, indicating oversold conditions were tested but broader momentum has not convincingly recovered.
Overall, the chart continues to lean bearish as long as the market holds below the broken trendline and the major moving averages. Price behavior around the Fibonacci region will be an important gauge of whether this decline matures into a deeper corrective phase or begins to base out.
-MW
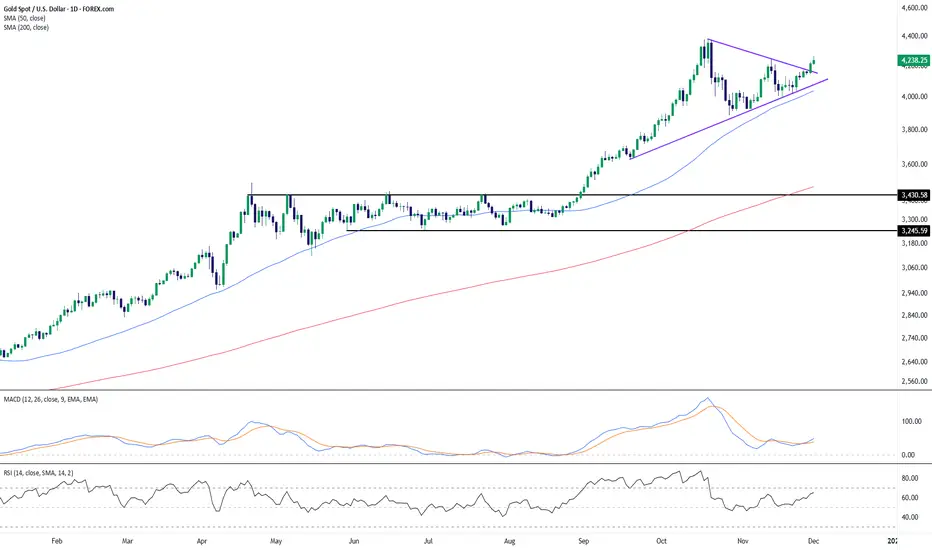
Gold Breaks Out of Triangle Structure as Trend Strength Remains Gold has pushed through the upper boundary of a contracting triangle formation, marking a continuation of the broader uptrend that has been intact since early in the year. The breakout follows several weeks of compression, with progressively higher lows aligning along a rising trendline, while buyers repeatedly tested the upper diagonal boundary.
The moving averages reinforce the constructive bias: price continues to trade well above both the 50-day SMA and the 200-day SMA, with the 50-day maintaining a strong upward slope. This places the current move firmly within a longer-term bullish structure, and the recent expansion in distance from the 50-day SMA highlights renewed upward momentum following the consolidation phase.
Momentum indicators are also showing early signs of improvement. The MACD lines have begun curling higher after a period of easing, suggesting that downside momentum has faded. RSI has climbed back into the mid-60s, reflecting strengthening buying interest without yet indicating overstretched conditions.
Overall, the breakout from the triangle aligns with the prevailing uptrend and indicates a return of bullish pressure. As always, how price behaves on any retest of the breakout area—or near the rising trendline—may provide additional insight into the durability of this momentum shift.
-MW
USDJPY Pulls Back After Retesting Major Resistance, Momentum ModUSD/JPY has retreated from the 157.00 resistance area after a brief attempt to break higher, with price slipping back below the short-term rising trendline drawn from the October swing lows. This marks the first decisive violation of that trendline since the rally began, suggesting that upward momentum may be cooling.
The 50-day SMA continues to trend higher and remains above the 200-day SMA, keeping the broader structure constructive. However, the recent candle rejections near resistance indicate hesitation at the top of the multi-month advance.
Momentum indicators reflect this moderation. The MACD histogram has been flattening, with the signal and MACD lines narrowing after weeks of positive alignment. Meanwhile, RSI has turned lower from the upper 60s, moving toward its mid-range zone, showing that buying pressure has softened without yet indicating oversold conditions.
Overall, the current pullback highlights a shift from aggressive upside momentum toward a more neutral or consolidative posture. How price behaves around the rising moving averages and prior trendline region may offer additional context for whether buyers maintain control or if the pair transitions into a broader corrective phase.
-MW

CL1! — Bullish Above 58 with Target at 62.22Crude oil maintains a constructive bullish structure as long as price holds above the 58.00 key support zone. This level remains the foundation of the current upward bias.
The next meaningful obstacle for buyers sits at the 60.69 resistance, which aligns with a major Fibonacci cluster and has shown strong rejection in previous attempts. A clean breakout and sustained close above 60.69 would confirm renewed bullish momentum.
Above that resistance, the path opens toward 61.71 followed by the main upside target at 62.22, which represents the completion of the current Fibonacci expansion.
As long as price trades above 58, the bullish scenario remains valid. A failure at 60.69 may trigger a temporary pullback, but the broader structure favors continuation toward 62.22 once the level is cleared.

NBIS Bearish ContinuationNBIS on the 1D chart is locked in a clear downtrend since mid-October, rolling over from highs above 140 to consolidate around the 94 area. Price is trading below the 20-day MA (~99.40) and 60-day MA at 106.23, while still holding above the long-term 120-day MA near 81.57. Momentum confirms the bearish tone: MACD is negative with the line below the signal, and Squeeze Momentum is deeply red, showing strong downside pressure. Structurally, price is moving inside a Bear Flag consolidation after a sharp drop, pointing to a potential continuation move lower once the range gives way.
For now, 106.23 is the key resistance, reinforced by the 60-day MA, with an intermediate supply band around 98–100 near the 20-day MA. As long as price stays capped beneath that zone, the primary path favors a downside break. A daily close below 93 and the lower flag boundary would lean toward continuation, opening room toward 90 first and then the stronger demand region around 85. If 81.57 fails on a decisive breakdown, an extension toward 78 cannot be ruled out.
On the flip side, a daily close back above 100 and a clean reclaim of the 20-day MA would start to challenge the bearish narrative, potentially squeezing price toward 102 and even 114 if momentum flips. Until that happens, sellers keep the upper hand and invalidations should be respected with discipline. This is a study, not financial advice. Manage risk and invalidations.
Thought of the Day 💡: The best trades aren’t the loudest setups, they’re the ones with clean levels and clear invalidations.
--------------------------
Thanks for your support!
If you found this idea helpful or learned something new, drop a like 👍 and leave a comment, I’d love to hear your thoughts!

NAS100 — Bearish Below 25,333 with Target at 25,054Price remains capped below the 25,333 key level, keeping the market in a clear bearish structure. As long as price trades under this zone, bullish attempts are likely to fail, and any rebounds should be viewed as corrective only. A sustained move below the intermediate supports at 25,181 and 25,166 strengthens the downside momentum and confirms continuation toward the primary bearish target at 25,054. Momentum and structure remain aligned to the downside while the key level holds.
