When an Uptrend Breaks..Smart Money Doesn’t Hesitate📉 XAUUSD MARKET OUTLOOK (1H)
- Gold has officially transitioned from its previous rising channel into a clear downtrend structure, marked by lower highs, lower lows, and a decisive break below the rising support line. The bullish momentum has faded, and sellers are gradually taking control.
- Price is now moving inside a descending correction channel, and every rally is being absorbed by supply — a textbook shift from accumulation to distribution.
1️⃣ Uptrend Channel Has Been Broken
Gold traded for several days inside a rising channel, respecting both support and resistance.
But price has now:
- Broken below the rising trendline
- Retested it and failed
- Formed a new bearish structure
This confirms the end of the previous bullish phase.
2️⃣ Strong Resistance Zone Holding Firm
The resistance zone around 4,235 – 4,245 has rejected price multiple times.
Each rejection produced:
- Lower swing highs
- Increasing bearish pressure
- Momentum shift toward sellers
This zone is now the ceiling of the new downtrend.
3️⃣ Descending Channel Signals Bearish Continuation
- Price is currently moving cleanly inside a downward-sloping channel.
- Every bounce is shallow → every drop is sharp.
- This is the behavior of a market controlled by sellers.
If the current corrective bounce fails at the upper boundary of the channel, another hard leg down is highly likely.
4️⃣ Key Target: Strong Support Zone Below
The next major liquidity area lies at the 4,105 – 4,120 strong support zone.
This is where buyers previously stepped in aggressively.
If price reaches this zone again, expect:
- Either a strong bullish reaction
- Or a deeper breakdown if momentum remains heavy
➡️ Primary Scenario (High Probability)
Retest of the channel top → rejection → bearish continuation into 4,105 – 4,120 zone.
Sellers remain in control as long as price stays under the broken trendline.
⚠️ Risk Scenario
A clean breakout above the descending channel may trigger a temporary bullish correction, but the overall structure remains bearish unless price reclaims the old resistance zone.
What’s your take on gold’s trend shift?
Technical Analysis

GOLD SHOOK THE MARKET – STRUCTURE STILL UNBREAKABLE!📌 CURRENT MARKET UPDATE (GOLD – 4H)
The market continues to respect the wave structure exactly as projected:
- Wave (1) – (2) has already completed
- Wave (3) tapped into the Liquidity zone 4250–4260, creating a clean corrective reaction
- Price is currently in a technical retest phase, perfectly normal within a strong macro uptrend
🎯 Key Level to Watch
The Swing Zone 4147–4150 remains solid — this is the core foundation of the entire bullish structure.
- Only if this zone breaks will the trend lose strength
- EMA34 & EMA89 continue trending upward, acting as strong dynamic support
✅ Main Scenario (High Probability)
Price makes a mild correction before pushing up to complete Wave (5) of (3).
Expected pullback zones:
🔹 4210 – 4180
🔹 Reaction confirmation → bullish continuation toward:
- 4310 – 4325 (Resistance)
- 4365 – 4370 (Liquidity – Completion of Wave (C))
Current liquidity flow still favors buy setups at support retest.
⚠️ Sub-Scenario (Low Probability)
If a 4H candle closes below 4147 → deeper correction toward EMA200 (4060–4080).
↳ Currently, there is NO sign of this scenario.
✅ TODAY’S TREND SUMMARY
Trend: Corrective – Accumulation
Optimal Buy Zones: 4210 → 4180 → 4150
Targets:
- 4310 – 4325
- 4365 – 4370
Trend invalidation: Break 4147

BTC’s Bounce Looks Weak — Sell Pressure May Hit Harder .....📌 Quick Market Breakdown (BTC – 4H)
Bitcoin is showing a textbook corrective bounce after a sharp breakdown from its rising structure. The current reaction is weak and aligns perfectly with a short-term bearish continuation setup.
Key Points From the Chart
- BTC broke both trendline support and the rising wedge, creating strong downside momentum.
- Price is now pulling back into the previous demand ⇒ now supply zone (the green zone you marked).
- The bounce is losing steam exactly at the SHORT ENTRY zone, signaling a high-probability reversal point.
- Market structure has officially shifted from bullish → bearish short-term.
🎯 Main Scenario (High Probability)
The pullback rejects and BTC heads lower.
Short entry zone: 86,800 – 87,500
Target 1: 84,000 zone (first liquidity pocket)
Target 2: 82,000 zone (deep demand zone)
This fits perfectly with the break-retest-drop pattern.
⚠️ Alternate Scenario (Low Probability)
If BTC closes a 4H candle ABOVE 88,600, the short-term bearish idea is invalidated.
In that case, BTC may retest 89,500 – 90,000, but this is less likely given current momentum.
📌 Final Conclusion
BTC is currently in a bearish correction phase, and the bounce you're seeing now is likely nothing more than a pullback into resistance.
The chart strongly favors continuation to the downside, with sellers ready to step in aggressively from the short-entry zone.

When Support Fails… Price Doesn’t Pull Back - DROPS.📉 GBPUSD MARKET OUTLOOK (1H)
- GBPUSD has formed a clean distribution structure, repeatedly rejecting the same resistance zone and creating lower highs on each swing — a strong sign that buyers are losing control while sellers are stepping in aggressively.
- Price is now retesting the broken support zone, which has turned into a new short-term resistance area, creating a classic bearish continuation setup.
1️⃣ Triple Rejection at Resistance
Price has reacted sharply from the 1.3290–1.3300 resistance zone three times.
Each rejection has produced:
- Strong bearish impulses
- Lower swing highs
- Increasing selling pressure
This confirms that the liquidity above this area is being defended heavily by sellers.
2️⃣ Support Zone is Weakening
The 1.3190–1.3205 support zone has been tested multiple times.
Each rebound has become weaker — a classic sign of support exhaustion.
Now price has broken below it and is retesting the underside of this zone.
This retest is the decisive moment.
3️⃣ Retest Setting Up Bearish Continuation
Price is currently pulling back into the retest zone (as shown in the chart).
If this retest holds, sellers are likely to step in with momentum.
This setup aligns perfectly with:
- Lower high formation
- Market structure shift from bullish → bearish
- Resistance flip behavior
- Momentum favoring the downside
➡️ Primary Scenario (High Probability)
Retest rejects → bearish continuation → strong drop toward the next liquidity zone.
Targets:
Target 1: recent low
Target 2: deeper support area formed earlier on the trend
Target 3: major demand zone below (swing structure dependent)
⚠️ Risk Scenario
If price reclaims the support zone and breaks above the retest level,
then bullish recovery could delay the downtrend — but probability remains smaller.
"If this breakdown–retest setup makes sense to you, or if you have a different view on GBPUSD, drop your thoughts in the comments. Let’s see how you read this structure."

LCID — WEEK 49 TREND REPORT (2D) | 12/03/2025LCID — WEEK 49 TREND REPORT | 12/03/2025
Ticker: NASDAQ:LCID
Timeframe: TWO DAY
This is a reactive structural classification of LCID based on the weekly chart as of this timestamp. Price conditions are evaluated as they stand — nothing here is predictive or forward-assumptive.
⸻
1) Current Trend Condition [ Numbers to Watch ]
Current Price @ 13.56$
• Trend Duration : +45 weeks (Bearish)
• Trend Reversal Level ( Bullish ): 18.35$
• Trend Reversal Level ( Bullish Confirmation ): 14.63$
⸻
2) Position Status :
Unstable (price below both structural layers)
⸻
3) Temperature :
Neutral Phase
⸻
4) Momentum :
Bearish
⸻
Author’s Note
This analysis is fully reactive, not predictive. Market conditions, trend structure, and behavior are classified as they appear in real time. The objective is to identify where directional shifts first occurred, where structural integrity remains intact, and where it would begin to weaken if key levels were breached.
Predictive analysis projects outcomes that do not exist yet. Without price confirmation, prediction is built on baseless assumptions. This framework avoids that entirely by responding only to verified structural changes and live conditions.
The levels shown simply identify where the current trend structure first shifted and where it would begin to lose integrity if breached. Recognizing these boundaries allows for clearer interpretation of market behavior without relying on forward guarantees, speculative projections, or unsupported assumptions.
⸻
Methodology Overview
This classification framework evaluates directional conditions using internal trend-interpretation logic that references price behavior relative to its structural layers. These relationships are used to identify when price movement aligns with the framework’s criteria for directional phases, transition points, or regime shifts. Visual elements or structural labels reflect these internal interpretations, rather than explicit trading signals or preset indicator crossovers. This framework is observational only and does not imply future outcomes.

SPX — 2026 Structural Thresholds and Downside Levels To MonitorThere has been ongoing discussion in broader financial circles about long-term risk conditions. Rather than leaning into narratives or forecasts, the focus here remains strictly on the current structural levels that define the trend.
Recent volatility between November 10–17, 2025 highlighted how quickly structural momentum can shift, and if price were to revisit lower levels, the closest structural areas currently sit near approximately 5,908 and 5,114 on my charting framework.
As long as price remains structurally above the key reversal levels, the trend classification remains intact. At current levels, the nearest line separating trend continuation from structural deterioration sits around 6,721, with deeper confirmation closer to 6,431.
If those areas were ever broken with follow-through, that would represent a confirmed structural change in the existing trend — nothing more, nothing less.
Rather than forecasting outcomes, the goal here is simply to stay aware of the boundaries that define the current market structure. Price only decides direction through confirmation, not speculation.
⸻
1) Current Trend Condition [ Numbers to Watch ]
• Current Price @ 6,850$
• Trend Reversal Level (Bearish):
6,721$
• Trend Reversal Level (Bearish Confirmation):
6,431$
• Pullback Support :
5,908$
• Correction Support :
5,114$
⸻
Author’s Note
This analysis is fully reactive, not predictive. Market conditions, trend structure, and behavior are classified as they appear in real time. The objective is to identify where directional shifts first occurred, where structural integrity remains intact, and where it would begin to weaken if key levels were breached.
Predictive analysis projects outcomes that do not exist yet. Without price confirmation, prediction is built on baseless assumptions. This framework avoids that entirely by responding only to verified structural changes and live conditions.
The levels shown simply identify where the current trend structure first shifted and where it would begin to lose integrity if breached. Recognizing these boundaries allows for clearer interpretation of market behavior without relying on forward guarantees, speculative projections, or unsupported assumptions.
⸻
Methodology Overview
This classification framework evaluates directional conditions using internal trend-interpretation logic that references price behavior relative to its structural layers. These relationships are used to identify when price movement aligns with the framework’s criteria for directional phases, transition points, or regime shifts. Visual elements or structural labels reflect these internal interpretations, rather than explicit trading signals or preset indicator crossovers. This framework is observational only and does not imply future outcomes.

VIX mid-term TAI've been watching VIX closely since September, and the accumulation has been growing since then and it's not stopped yet, it looks like it set double top and currently is cooling down but the indicators are still very strong and they don't get that strong that often on daily time frame, the VIX may look like it's cooling down for a holiday cheer but it didn't go away yet. So be prepared for a possible volatility to hit again.

AMD — WEEK 49 TREND REPORT | 12/03/2025AMD — WEEK 49 TREND REPORT | 12/03/2025
Ticker: NASDAQ:AMD
Timeframe: WEEKLY
This is a reactive structural classification of AMD based on the weekly chart as of this timestamp. Price conditions are evaluated as they stand — nothing here is predictive or forward-assumptive.
⸻
1) Current Trend Condition [ Numbers to Watch ]
• Current Price @ 216$
• Trend Duration: +0 weeks (Bearish)
• Trend Reversal Level (Bullish): 230.68$
• Trend Reversal Level (Bearish Confirmation): 191.07$
• Pullback Support : 217.79$
• Correction Support : 179.09$
⸻
2) Structure Health
• Retracement Phase:
Correction (approaching 61.8%)
• Position Status:
Healthy (price above both structural layers)
⸻
3) Temperature :
Cooling Phase
⸻
4) Momentum :
Neutral
⸻
5) Market Sentiment
Bullish
⸻
Author’s Note
This analysis is fully reactive, not predictive. Market conditions, trend structure, and behavior are classified as they appear in real time. The objective is to identify where directional shifts first occurred, where structural integrity remains intact, and where it would begin to weaken if key levels were breached.
Predictive analysis projects outcomes that do not exist yet. Without price confirmation, prediction is built on baseless assumptions. This framework avoids that entirely by responding only to verified structural changes and live conditions.
The levels shown simply identify where the current trend structure first shifted and where it would begin to lose integrity if breached. Recognizing these boundaries allows for clearer interpretation of market behavior without relying on forward guarantees, speculative projections, or unsupported assumptions.
⸻
Methodology Overview
This classification framework evaluates directional conditions using internal trend-interpretation logic that references price behavior relative to its structural layers. These relationships are used to identify when price movement aligns with the framework’s criteria for directional phases, transition points, or regime shifts. Visual elements or structural labels reflect these internal interpretations, rather than explicit trading signals or preset indicator crossovers. This framework is observational only and does not imply future outcomes.

SOFI — WEEK 49 TREND REPORT | 12/03/2025SOFI — WEEK 49 TREND REPORT | 12/03/2025
Ticker: NASDAQ:SOFI
Timeframe: WEEKLY
This is a reactive structural classification of SOFI based on the weekly chart as of this timestamp. Price conditions are evaluated as they stand — nothing here is predictive or forward-assumptive.
⸻
1) Current Trend Condition [ Numbers to Watch]
• Current Price @ 29.73$
• Trend Duration: +32 weeks (Bullish)
• Trend Reversal Level (Bearish): 28.13$
• Trend Reversal Level (Bearish Confirmation): 23.30$
• Pullback Support : 26.63$
• Correction Support : 21.85$
⸻
2) Structure Health
• Retracement Phase:
Uptrend (operating above 78.6%)
• Position Status:
Healthy (price above both structural layers)
⸻
3) Temperature :
Warming Phase
⸻
4) Momentum :
Bullish
⸻
5) Market Sentiment
Bullish
⸻
Author’s Note
This analysis is fully reactive, not predictive. Market conditions, trend structure, and behavior are classified as they appear in real time. The objective is to identify where directional shifts first occurred, where structural integrity remains intact, and where it would begin to weaken if key levels were breached.
Predictive analysis projects outcomes that do not exist yet. Without price confirmation, prediction is built on baseless assumptions. This framework avoids that entirely by responding only to verified structural changes and live conditions.
The levels shown simply identify where the current trend structure first shifted and where it would begin to lose integrity if breached. Recognizing these boundaries allows for clearer interpretation of market behavior without relying on forward guarantees, speculative projections, or unsupported assumptions.
⸻
Methodology Overview
This classification framework evaluates directional conditions using internal trend-interpretation logic that references price behavior relative to its structural layers. These relationships are used to identify when price movement aligns with the framework’s criteria for directional phases, transition points, or regime shifts. Visual elements or structural labels reflect these internal interpretations, rather than explicit trading signals or preset indicator crossovers. This framework is observational only and does not imply future outcomes.

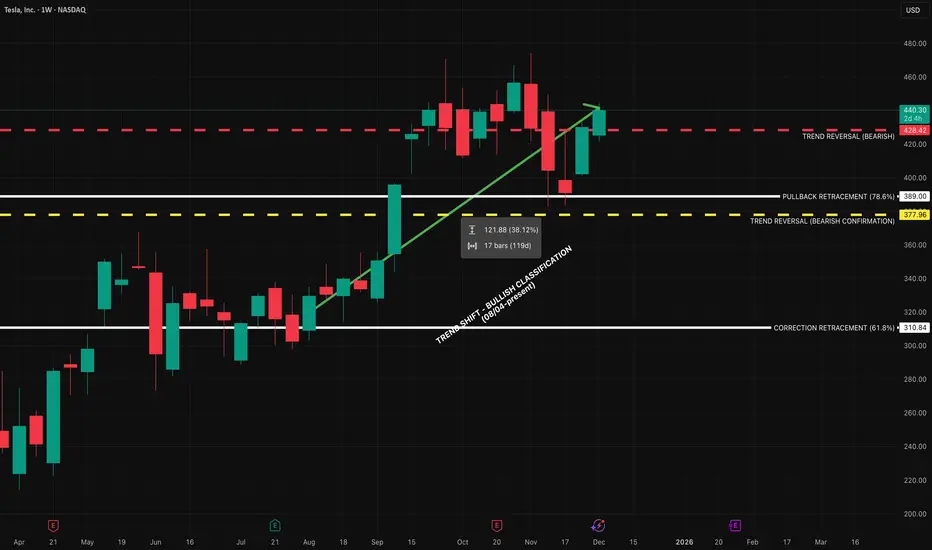
TSLA — WEEK 49 TREND REPORTTSLA — WEEK 49 TREND REPORT
Ticker: NASDAQ:TSLA — 12/03/2025 @ 440.31$
Timeframe: WEEKLY
This is a reactive structural classification of TESLA based on the weekly chart as of this timestamp. Price conditions are evaluated as they stand — nothing here is predictive or forward-assumptive.
⸻
1) Current Trend Condition
• Trend Duration: +17 weeks (Bullish)
• Trend Reversal Level (Bearish): 428.42$
• Trend Reversal Level (Bearish Confirmation): 377.96$
• Pullback Support : 389$
• Correction Support : 310.84$
⸻
2) Structure Health
• Retracement Phase:
Uptrend (operating above 78.6%)
• Position Status:
Healthy (price above both structural layers)
⸻
3) Temperature :
Cooling Phase
⸻
4) Momentum :
Bullish
⸻
5) Market Sentiment (RETAIL TRADER LINE)
Bullish
⸻
Author’s Note
This analysis is fully reactive, not predictive. Market conditions, trend structure, and behavior are classified as they appear in real time. The objective is to identify where directional shifts first occurred, where structural integrity remains intact, and where it would begin to weaken if key levels were breached.
Predictive analysis projects outcomes that do not exist yet. Without price confirmation, prediction is built on baseless assumptions. This framework avoids that entirely by responding only to verified structural changes and live conditions.
The levels shown simply identify where the current trend structure first shifted and where it would begin to lose integrity if breached. Recognizing these boundaries allows for clearer interpretation of market behavior without relying on forward guarantees, speculative projections, or unsupported assumptions.
⸻
Methodology Overview
This classification framework evaluates directional conditions using internal trend-interpretation logic that references price behavior relative to its structural layers. These relationships are used to identify when price movement aligns with the framework’s criteria for directional phases, transition points, or regime shifts. Visual elements or structural labels reflect these internal interpretations, rather than explicit trading signals or preset indicator crossovers. This framework is observational only and does not imply future outcomes.
XAUUSD – The Golden Wave Awaits the Next U.S. TriggerIf there is one asset being favored by the current macro environment , it is undoubtedly gold. The U.S. dollar is weakening due to expectations that the Fed will soon shift toward policy easing, while global investors await key U.S. data such as ADP, ISM, and the Fed meeting next week. This “waiting mode,” combined with the dollar dropping to its lowest level since mid-November , is creating a highly supportive backdrop for XAUUSD to continue its bullish momentum.
Looking at the chart, gold continues to move smoothly within its ascending channel . Price repeatedly rebounds from the lower boundary, rides along the Ichimoku cloud, and forms higher lows — all signatures of a healthy bullish market with real buying pressure . Every small pullback is absorbed almost immediately, showing that buyers remain firmly in control.
My preferred scenario: XAUUSD may fluctuate slightly around 4,180–4,200 to collect liquidity, then continue climbing toward 4,280 — an area aligning with the upper channel boundary and a level where the market has reacted strongly in the past. If ADP and ISM come out weaker than expected , a clean breakout above 4,280 becomes highly likely.
Overall, gold currently has macro momentum, technical alignment, and market sentiment all on its side . As long as you avoid FOMO and wait for minor pullbacks, you’ll find it much easier to ride along with the major flow of capital as the market prepares for the next wave of volatility.

Is Gold Just Resting — or Ready to Rise Again?Hello traders, let’s take a look at XAUUSD together today!
At the moment, XAUUSD looks like a wave pulling back only to gather momentum — not weakening, but preparing for the next upward move . After hitting a six-week high, gold is seeing some light profit-taking, but the macro backdrop still leans strongly toward the bulls: the Fed is sending dovish signals , the USD is weakening, and soft U.S. data continues to support this mild bullish trend .
Looking at the chart, price was previously rejected at the upper resistance zone and has now pulled away from the descending resistance line. Even so, the overall bullish structure remains intact . Gold is heading toward the 4,170 support zone, which aligns with a strong previous reaction area — and may dip slightly deeper into 4,120, a confluence of old lows and a strong rejection zone. These are the two areas where buyers are most likely to return .
The high-probability scenario: XAUUSD taps 4,170, forms a consolidation base, and then rebounds toward 4,250. If sellers push price further to 4,120, this will become the last critical support before gold triggers its next upward wave. Only a clear break below 4,120 would significantly threaten the mild bullish outlook.
For now, the main story remains unchanged: gold is correcting, not reversing . And every pullback toward support continues to be an opportunity to watch for the buyers’ return — to fuel the next bullish leg in the days ahead.

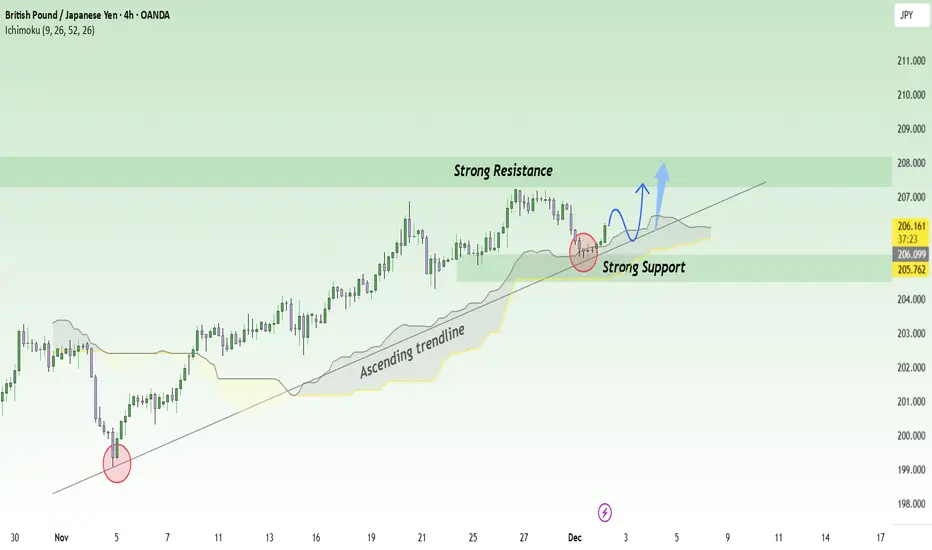
GBPJPY Gearing Up for a New Bullish Wave?If we were to describe GBPJPY at this moment, it would be the picture of a market gathering momentum to climb higher . After a mild pullback, the macro backdrop still leans toward further upside: the JPY continues to weaken as risk-aversion eases, while the GBP remains supported by a stable economy and higher interest rates . This combination forms a solid foundation for the current recovery phase.
Looking at the 4H chart, the uptrend is clearly intact with an ascending trendline that has been respected consistently since early November. Each touch of this trendline has triggered strong buying pressure — a clear sign that bulls are still in control . Most recently, price has bounced again from the 205.6 support confluence , aligning perfectly with the trendline and the nearest support zone.
With the current structure, the primary scenario remains bullish. Price is likely to consolidate slightly above the trendline before moving toward the 207.3 resistance — the next key target of the trend. If buying pressure stays firm, GBPJPY could even extend higher toward 207.8–208.0.
Only a break below 205.5 and a candle close under the trendline would threaten the bullish outlook. But for now, market flow continues to favor the buy side, and every pullback still presents an opportunity to observe the potential continuation of the uptrend .
Fed Turns Dovish – Is the Euro Taking the Throne?In the current environment, the market is expecting the Fed to become increasingly dovish , while the ISM Manufacturing PMI—though forecasted to rise slightly—remains below the 50 mark . This indicates that the U.S. manufacturing sector is still not strong enough to support the USD. As a result, the dollar struggles to generate sustainable bullish momentum, unintentionally giving stronger support to the euro . From a sentiment perspective, as long as the data isn’t overly positive for the USD, capital flow will continue to favor EURUSD.
Looking at the H4 chart, the bullish structure is clear: price keeps forming higher lows , respecting the ascending trendline, and trading above the Ichimoku cloud — all signs that the primary trend remains bullish. The 1.1560 zone, aligned with both the trendline and the top of the cloud, acts as critical support , while 1.1650 stands out as the natural upside target for the current bullish wave.
My preferred scenario: EURUSD may make a small pullback toward 1.1560–1.1580 to retest support before bouncing higher toward 1.1650. As long as price stays above the trendline and doesn’t break below 1.1560, I continue to view this market as leaning strongly toward buying rather than selling.
In summary, with news flow putting pressure on the USD and technical structure supporting the bulls, the short-term trend for EURUSD remains decisively bullish .

GBPUSD Set to Break Higher: Buyers Take Back Control!If I had to pick one currency pair that is “warming up” in the most positive way, GBPUSD would easily be the standout . The news is lining up behind the British pound, and the technicals are opening the door for another bullish leg — everything is aligning perfectly for buyers.
From a news perspective, the market reacted positively to the UK’s Autumn Budget , with the OBR noting that the new fiscal plan helps reduce financial-risk pressure . This strengthens confidence in GBP. Meanwhile, the USD continues to weaken as expectations grow that the Fed may cut rates — a factor that makes it difficult for the dollar to stage a strong recovery. When one currency weakens due to fundamentals, the opposing currency — in this case the pound — naturally gains room to rise.
On the H4 chart, the bullish structure is very clean : price is moving inside an ascending channel, printing higher lows, and consolidating above the Ichimoku cloud — a highly important bullish signal. The 1.3170 zone is a confluence of horizontal support and the cloud’s lower boundary, making it an ideal area for a mild pullback before a continuation move. Above, the 1.3260 region stands as the nearest swing high and the most natural target for the next bullish wave.
My preferred scenario: GBPUSD may dip slightly toward 1.3170 to retest support, then gradually bounce and move upward toward 1.3260 following the channel structure. As long as price holds above 1.3170 and does not close an H4 candle below the cloud, I will continue to prioritize BUY setups , rather than attempt counter-trend sells.

DOGE — WEEK 49 TREND REPORTBINANCE:DOGEUSDT — WEEK 49 TREND REPORT
Ticker: BINANCE:DOGEUSDT — 12/03/2025 @ 0.15$
Timeframe: WEEKLY
This is a reactive structural classification of CRYPTOCAP:DOGE based on the weekly chart as of this timestamp. Price conditions are evaluated as they stand — nothing here is predictive or forward-assumptive.
⸻
1) Current Trend Condition
• Trend Duration: +7 weeks (Bearish)
• Trend Reversal Level (Bullish): .018$
• Trend Reversal Level (Bullish Confirmation): 0.20$
• Structural Support: 0.28$
⸻
2) Structure Health
• Retracement Phase:
Breakdown (establishing price beneath 38.2%)
• Position Status:
Unstable (price below both structural layers)
⸻
3) Temperature :
Cooling Phase
⸻
4) Momentum :
Bearish
⸻
Author’s Note
This analysis is fully reactive, not predictive. Market conditions, trend structure, and behavior are classified as they appear in real time. The objective is to identify where directional shifts first occurred, where structural integrity remains intact, and where it would begin to weaken if key levels were breached.
Predictive analysis projects outcomes that do not exist yet. Without price confirmation, prediction is built on baseless assumptions. This framework avoids that entirely by responding only to verified structural changes and live conditions.
The levels shown simply identify where the current trend structure first shifted and where it would begin to lose integrity if breached. Recognizing these boundaries allows for clearer interpretation of market behavior without relying on forward guarantees, speculative projections, or unsupported assumptions.
⸻
Methodology Overview
This classification framework evaluates directional conditions using internal trend-interpretation logic that references price behavior relative to its structural layers. These relationships are used to identify when price movement aligns with the framework’s criteria for directional phases, transition points, or regime shifts. Visual elements or structural labels reflect these internal interpretations, rather than explicit trading signals or preset indicator crossovers. This framework is observational only and does not imply future outcomes.

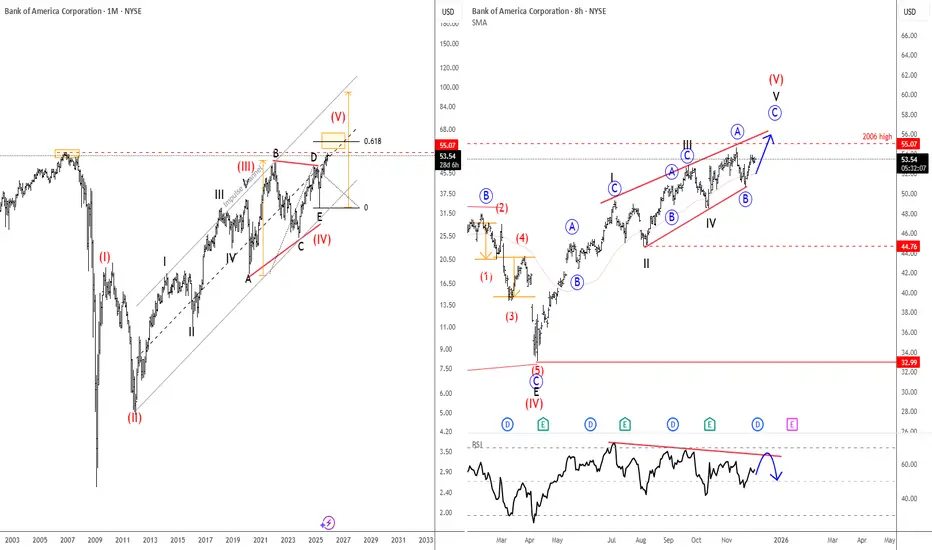
Bank Of America Is Eyeing All-Time Highs From 2006Bank of America is one of the largest banks in the world, serving millions of consumers, businesses, and institutions. It has a broad mix of operations — consumer banking, wealth management, corporate banking, and global markets — which helps keep its earnings stable. The bank has been heavily investing in digital services and technology, aiming to improve efficiency and customer experience. Its size and global reach make it a key player in the U.S. and global financial system.
Bank of America is in an uptrend with a very strong rebound since April 2025, and the price is now approaching the 2006 highs. That area around 55 is extremely important because the current structure looks like an ending diagonal in wave five, meaning we could be in the late stages of a higher-degree bullish cycle. The push up this year also comes out of a very big triangle on the monthly chart, so despite the positive momentum, we should be aware that resistance is getting closer and bullish momentum may slow down. We also see RSI divergence on the daily chart, which is very common when diagonals mature. So while the trend is still up for now, it makes sense to be careful around 55, as a potential reversal in 2026 would not be a surprise.
Highlights:
Trend: Bullish but late-stage (ending diagonal risk)
Resistance: 55-56 area (2006 high)
Invalidation of a bull trend: broken trendline support
Note: Watch RSI divergence and respect the 55/56 zone as potential exhaustion of wave five
MarketBreakdown | USDJPY, EURCAD, Dollar Index, US30
Here are the updates & outlook for multiple instruments in my watch list.
1️⃣ #USDJPY daily time frame 🇺🇸🇯🇵
Correctional movement continues.
The price now formed a falling parallel channel - a bullish flag.
A bullish breakout of its resistance and a daily candle close above
will confirm a completion of a correction and a resumption
of a long-term uptrend.
2️⃣ #EURCAD daily time frame 🇪🇺🇨🇦
The market is in a deep consolidation.
The price is stuck within a wide horizontal range on a daily
for more than a month.
We can expect a bullish continuation to a resistance of the range.
A bearish movement will most likely follow from that.
3️⃣ Dollar Index #DXY daily time frame $
The market reached a significant daily horizontal support cluster.
Due to its historic importance, there is a high probability
to see a pullback from that.
4️⃣ DOW Jones Index US30 daily time frame
The market continues coiling alongside a recently broken
trend line that turned into a strong vertical resistance now.
There is a high probability that we will see a stronger retracement
from that and a bearish movement.
Do you agree with my market breakdown?
❤️Please, support my work with like, thank you!❤️
I am part of Trade Nation's Influencer program and receive a monthly fee for using their TradingView charts in my analysis.

GOLD (XAUUSD): Updated Support & Resistance Analysis
Here is my latest support and resistance analysis Gold.
Vertical Structures:
Vertical Support 1: Rising trend line
Horizontal Structures
Support 1: 4164 - 4172 area
Support 2: 4080 - 4132 area
Support 3: 3996 - 4045 area
Support 4: 3869 - 3930 area
Resistance 1: 4230 - 4264 area
Resistance 2: 4359 - 4382 area
Consider these structures for pullback/breakout trading.
❤️Please, support my work with like, thank you!❤️
I am part of Trade Nation's Influencer program and receive a monthly fee for using their TradingView charts in my analysis.

Gold Potential UpsidesHey Traders, in today's trading session we are monitoring XAUUSD for a buying opportunity around 4,185 zone, Gold is trading in an uptrend and currently is in a correction phase in which it is approaching the trend at 4,185 support and resistance area.
Trade safe, Joe.

EURUSD Potential UpsidesHey Traders, in today's trading session we are monitoring EURUSD for a buying opportunity around 1.15800 zone, EURUSD is trading in an uptrend and currently is in a correction phase in which it is approaching the trend at 1.15800 support and resistance area.
Trade safe, Joe.

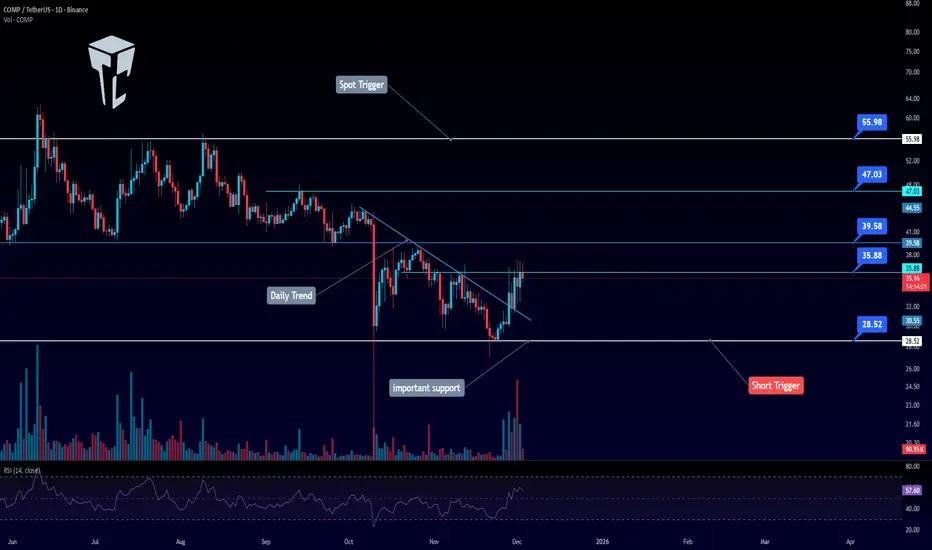
TradeCityPro | COMPUSDT Ready for a Long Setup!👋 Welcome to TradeCityPro!
Let’s dive into the analysis of COMP, one of the active DeFi tokens that has recently been seeing a noticeable increase in its 24-hour trading volume — making it worth paying attention to.
🌐 Bitcoin Overview
Before we begin, let me remind you once again that at your request, we’ve moved the Bitcoin analysis section to a dedicated daily report — allowing us to analyze Bitcoin’s trend, dominance, and overall market sentiment in greater depth each day.
On the daily timeframe, after the sharp decline that broke $39.58, the price dropped toward the major support at $28.52.
Price was supported from that level, and despite several attempts to break below it, the zone held strong — leading to a bounce and eventually a breakout of the daily trendline.
Currently, price is sitting just below the trendline trigger.
Since this trendline break is part of a reversal structure, we still need confirmation.
A break above $39.58 would provide a clear long trigger and open the way for bullish continuation.
However, if you have entered a position anywhere within this range, it’s best to place your stop-loss below the $28.52 support zone, and manage your risk accordingly.
📝 Final Thoughts
Stay calm, trade wisely, and let's capture the market's best opportunities!
This analysis reflects our opinions and is not financial advice.
Share your thoughts in the comments, and don’t forget to share this analysis with your friends! ❤️
Is the Aussie Awakening a Mirage?The Australian Dollar is staging a formidable recovery, driven by a stark divergence in central bank leadership and shifting geopolitical tides. As the pair approaches the critical 0.6600 resistance, we analyze the multi-domain factors fueling this ascent.
Geopolitics & Geostrategy: The Stability Premium
Global capital is currently re-evaluating the "safety" premium. The US grapples with political gridlock and government shutdown threats. Meanwhile, Australia presents a geostrategic anchor in the Asia-Pacific. The AUD is benefiting from a "stability premium" as investors rotate out of the uncertainty plaguing the US Dollar. Furthermore, renewed hopes for European peace deals have buoyed global risk sentiment. This shift disproportionately benefits high-beta currencies like the AUD over the safe-haven USD.
Management & Leadership: Bullock vs. Powell
The divergence in governance between the Reserve Bank of Australia (RBA) and the Federal Reserve drives this trend. RBA Governor Michele Bullock displays assertive leadership, maintaining a hawkish stance to combat sticky inflation. In contrast, the Federal Reserve appears reactive, with markets pricing in a high chance of a December rate cut. This leadership contrast—steadfastness versus capitulation is steering capital flows toward the AUD.
Industry Trends & Innovation: The Infrastructure Boom
A hidden driver of the AUD’s resilience is a surge in high-tech infrastructure. Q3 GDP data revealed that while household consumption slowed, private investment surged 2.9%. This growth relies heavily on machinery, equipment, and renewable energy projects. This is not just a mining story anymore; it is an infrastructure evolution. Tangible capital expenditure in technology sectors provides a structural floor for the currency that speculative flows cannot match.
Macroeconomics: The Two-Speed Economy
Australia currently exhibits a classic "two-speed" economy. The consumer sector softens under the weight of cost-of-living pressures, yet the business sector aggressively expands capacity. The 0.4% GDP growth missed forecasts, yet the currency rallied. The reason is simple: sticky inflation forces the RBA to keep rates higher for longer. In a world where the US cuts rates, Australia’s high-yield status acts as a powerful magnet.
Business Models: Intellectual Property of Policy
Metaphorically, the RBA holds the "patent" on credible inflation targeting in 2025. Other central banks pivot prematurely, but the RBA’s refusal to cut rates preserves the integrity of their monetary policy. This adherence to mandate over market pressure creates a predictable business environment for foreign investors. It distinguishes the AUD as a currency of yield and integrity in a volatile G10 landscape.
Technical Analysis: The Battle Lines
The AUD/USD has executed a V-shaped recovery, bouncing from key support. The pair is now confronting the 2022 trendline at 0.6592/98.
* Bullish Case: A weekly close above 0.6598 invalidates the bearish trend. This opens the door to 0.6651 * and 0.6723 .
* Bearish Case: Failure here triggers a potential "Head and Shoulders" pattern. This targets a retest of 0.6453 .
* Algorithmic Insight: High-frequency traders likely target this specific trendline collision. Expect volatility as human conviction battles automated resistance.
Final Verdict: The fundamental backdrop favors the bulls due to the RBA/Fed policy divergence. However, the technical barrier at 0.6600 is formidable. Traders must watch for a confirmed breakout before chasing this rally further.
