US DOLLAR LIQUIDITY GAMES🇺🇸 US Dollar Range Politics – Liquidity Before Clarity
The dollar isn’t trending — it’s negotiating.
📊 Current Setup
U.S. Dollar Index (DXY): 98.322 → testing the value area high
Range Floor: 96.747 → the value area low
Structure: Bearish range, with liquidity being hunted before any true direction emerges.
🏛️ Macro Backdrop
Tariffs are reshaping global flows.
Fiscal gridlock + shutdown risk clouds investor confidence.
Inflation + Fed policy signals remain mixed.
Every headline feels like an amendment to a bill no one fully understands.
The result: the dollar drifts sideways in a liquidity-seeking phase. Traders should expect chop inside the box until a decisive catalyst (data, Fed action, or policy shift) provides clarity.
🌍 Cross Pair Impact
This stalemate spills into the majors:
EURUSD & GBPUSD → reflecting the same sideways ranges and fake-outs.
USDJPY → volatility compressed, waiting for dollar direction.
Crosses are trading in sympathy — liquidity hunts on both ends, with no clean trend until DXY escapes its range.
🧭 Takeaway: The dollar is boxed in by politics and policy. Patience rules here: trade the range, wait for the breakout.
Technicaltrading

EUR/USD Macro + Technical TargetLiquidity Run Complete
• EUR/USD swept last week’s key high and stalled.
• Dollar Index (DXY) just balanced on its weekly range—classic setup for a euro fade if USD strength resumes.
Macro Undercurrent
• U.S. Side: September core PCE inflation held at 2.8% y/y, keeping the Fed cautious about rate cuts. Futures now price only ~40 bps of easing into Q1.
• Eurozone Side: HICP inflation slowed to 2.4% and the ECB’s minutes flagged “weak growth, sticky wages.” Rate-cut odds for March keep rising.
Levels to Watch
• Resistance near 1.17540,todays High
• Southbound magnets: 1.16455 Lows

Bitcoin Chart Marks Its 2 Big Next Stops: $105K → $98KBitcoin has spent three months consolidating near record highs.
That kind of sideways grind usually ends with a liquidity hunt.
If the dollar finishes its current swing higher, Bitcoin likely tags the mid-range support zone next.
Two major downside targets remain on the map for the coming months.
Probability of a flush lower sits around ~80%
It’s a normal structural move: after heavy consolidation, price seeks liquidity before the next sustained leg.
Dollar drifts lower as U.S. growth stays hot—Q2 GDP +3.8% and a government-shutdown risk on deck.
Bitcoin presses $111K–112K resistance while whales quietly accumulate after recent liquidation spikes.
Price is at the hinge: soft USD supports risk, but volatility is loaded.
Trade the structure, not the noise.

BTC USD PLAN
Bitcoin’s chart is one thing, but the bigger story is what’s driving the money behind it.
The Fed & Yields
The Federal Reserve is still the invisible hand. Every surprise in rates—whether a hotter inflation print or a sudden hint of deeper cuts—moves global risk appetite.
Lower real yields = cheaper capital = stronger bid for assets like BTC.
A hawkish turn does the opposite.
Institutional Flow
Big money isn’t just buying dips—it’s writing new rules.
Case in point: asset manager Strive is set to acquire about 5,800 BTC (≈ $675 million) through a corporate deal.
Moves like this tighten available supply and add a slow, steady demand base.
Bitcoin Technical View
This week’s candle is shaping up bearish, and Monday will tell us if today’s Sunday session finishes the job.
If the market doesn’t fill that daily gap, we’ll be watching Monday’s open closely.
Right now the daily range runs from 113,999 down to 108,644.
If the dollar pushes into higher liquidity zones, Bitcoin could feel the pressure and drift lower.
The plan is simple: wait for a clear shift on the smaller time frames before making any move and calculate risk from there.
Patience matters more than bravado—let the market come to you.
For now, the setup still looks constructive, but it only pays to act when the levels confirm.
Trade small, stay calm, and protect your capital first.

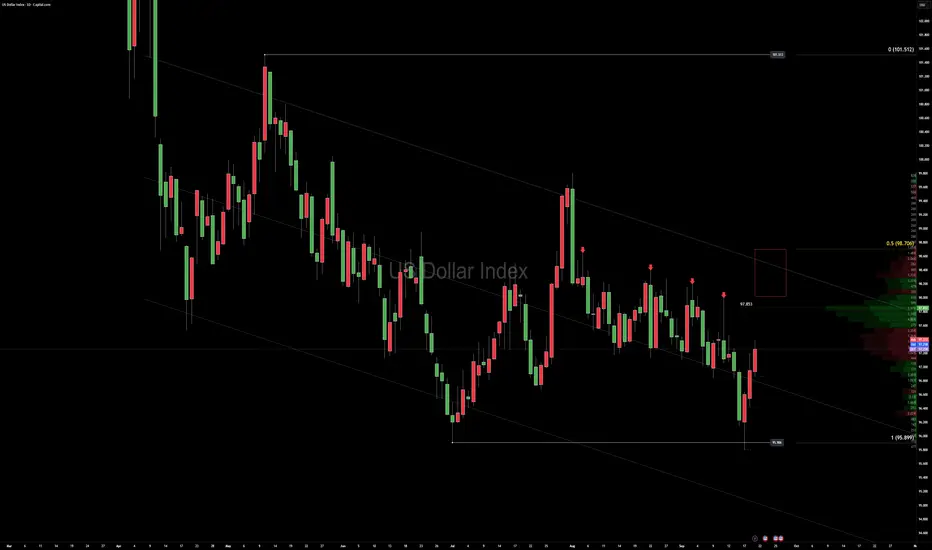
US DOLLAR LIQUIDITY GAMES MAPThe U.S. Dollar is testing traders resolve.
Price action keeps pressing higher, and a daily close above 97.394 would confirm a classic “fractal low” — the kind of structural pivot that lures late buyers before the real move unfolds.
3 Key Insights
Macro Calendar – Stay alert:
Thu – Final Q2 GDP, Weekly Jobless Claims, Durable Goods Orders.
Fri – Core PCE Price Index, Personal Income & Spending, University of Michigan Sentiment (final).
These are the week’s steering currents for USD flows.
A daily close above 97.394 is the key trigger to confirm a fresh leg higher.
• EUR/USD short bias remains valid while DXY stays bid, but expect intraday volatility around data releases.

EUR/USD Technical UpdateEURUSD rejected the 1.1742 monthly high, slipping back into mid-range. Price now sits between well-defined highs and lows, and the next daily close outside this range should set the directional tone for the week.
No need to predict—this is a pure breakout watch.
• Close above the upper band = momentum bias higher.
• Close below the lower band = momentum bias lower.
Until that daily candle settles, stay patient and let the market reveal the winner.

EUR/USD – Volume MapPrice is still holding a bullish lower range between 1.16595 and 1.19187.
The main volume distribution sits mid-range, and today’s action feels like absorption—market makers testing liquidity rather than chasing a breakout.
Key trigger to watch:
If sellers push into the 1.17365 volume node, it opens the door for a deeper move toward the lower end of the range.
Stay nimble; if that node holds, we could just grind sideways.
Macro side-note:
Dollar sentiment remains shaky after a 10% drop in 1H 2025 and growing chatter about fiscal risks and gold hedges.
European investors have been keeping more capital at home, which can add undercurrents of euro support even when U.S. data wobbles.
Bottom line: 1.17365 is the battleground.
Break and hold below → watch for fresh lows.
Hold and absorb → range trade continues.

US DOLLAR War Map stays simple right nowThe dollar’s been sliding for months, but we finally saw the range lows taken out after the FOMC spike, and that sets up the next move.
Here’s how I’m reading it:
Rotation lower is still the logical path unless politics or surprise news change the game.
On the DXY chart, I’m watching for a heavy-volume node to act as a target for a short-term pullback higher.
For cross-pairs, that means I’ll look for short setups while using the recent bullish dollar lows as day-to-day reference points.
Key level to watch: around 98.7, where heavy bearish order-flow has been building.
If the market keeps moving, it’s a straightforward trade plan: stay positive, take intraday signals, and let the bigger down-cycle play out.
BTCUSD – Liquidity Sweep & Weekend Fractals
Key Levels
• Major liquidity pocket tagged at 117,898.79.
• After that sweep, price printed a string of bearish fractals.
• Market makers are now likely eyeing the cluster of minor fractals at 117.4k, 118.6k, and 119.3k.
Trade Recap
All our targets were reached over the weekend.
I’m flat now, but in hindsight a trailed stop would have captured more of the move as price kept running.
Plan Forward
Watching how price reacts around the 118k–119k zone for clues on the next leg.
A decisive rejection here could open a deeper retrace; sustained acceptance sets up a fresh structure.
Not financial advice—pure market structure analysis using the CORE 5 lens.

BTCUSD – Target Hit: $116,833.25Bitcoin has reached the upside objective I mapped from the prior point of structure, tagging $116,833.25 in today’s session.

BTCUSD Eyes 116,833 While Dollar Flexes Pre-NewsGood morning traders—
Bitcoin is pressing toward 116,833.25 while the U.S. Dollar Index grinds into a fresh bullish range ahead of key U.S. data.
Notably, there’s a major volume node near 11,861. We could see price hover or even dip into that pocket on the headline drop before any attempt at the higher target. Classic market-maker mind games: build liquidity, shake stops, then decide the real direction.
Macro backdrop
U.S. CPI tomorrow keeps rate-cut odds alive.
Treasury yields firm, adding fuel to the dollar bid.
Equity futures soft, hinting at defensive flows.
Plan
Keep stops tight and trailing, only ride trades backed by strong volume.
Patience until post-news—let the data show the hand before sizing up.
Stay nimble and let the market makers reveal their move. Happy trading.

GBPUSD – London Session TargetsThe new week opens with momentum carried from Friday’s close.
On the 1-hour chart we have upside targets at 1.35952 and 1.36194 for the London morning session.
Price action shows a tight pre-market coil with minimal retracement expected if buyers step in early.
Key focus is on how London reacts to these levels—
quick acceptance could drive a clean run to target,
failure to hold the first impulse could signal a deeper pullback.

Bitcoin: Institutions Still Buying — Bullish Fuel Stays HotMetaplanet just added 775 BTC — now holding nearly 19K.
They’re not betting — they’re positioning.
No debt, no hopium. Just conviction.
You don’t stack like that if you think price is done.
Fundamentals? Semi-mixed.
Still inside a low-probability range.
Invalidation: $111,903.68
No need to flip bias until that breaks.
Dollar weakness could rip BTC out of this chop.
Until then — scalp, don’t gamble.

USDJPY Analysis : Bearish Setup from Reversal Zone + Target⚠️ Overview:
The USDJPY 4H chart reveals a smart money-driven bearish setup, unfolding precisely from a major Reversal Zone, which aligns with a key supply area. Price action is now offering high-probability short trade opportunities, supported by structural breaks, clear CHoCHs (Change of Character), and BOS (Breaks of Structure).
🔎 Detailed Technical Breakdown:
🔹 Bearish Pattern + Channel Formation:
The pair formed a bearish price pattern earlier, which initiated the previous downtrend. This move developed into a well-formed descending channel, showing controlled distribution from the institutional side. The channel break marked a liquidity grab below previous lows, trapping retail sellers before shifting structure.
🔹 Channel Insider Demand + Breakout:
After reaching the Channel Insider Demand, USDJPY made a strong bullish push, causing a Minor BOS — a sign of temporary bullish pressure. However, this move served to rebalance price into a premium zone, which is the current Reversal Zone. This zone lies near previous imbalance/fair value gaps and coincides with a supply structure, making it a high-reaction area.
🔹 Reversal Zone (Premium Area):
Price tapped the Reversal Zone and began rejecting aggressively. This reaction indicates the presence of large sellers and order blocks. The current price action now displays a Minor CHoCH, suggesting a short-term bearish shift in order flow.
This is a textbook case of premium vs. discount pricing, where price seeks liquidity above recent highs before reversing to more balanced zones.
🔹 Price Flow Expectations (Downside Targets):
The first confirmation of bearish continuation will come with a clean break below the Minor CHoCH level (~144.400). Following that, momentum is expected to carry USDJPY toward:
🥇 Target 1: 144.00 – Local support / liquidity pocket
🥈 Target 2: 143.00 – Key psychological & structural support
🥉 Target 3: 142.00–142.50 Zone – Marked as the Next Reversal Zone, which could act as demand
This setup remains valid as long as the price remains below 147.200, which is the high of the Reversal Zone. A breakout above this invalidates the bearish thesis.
🧠 MMC (Mind Market Curve) Interpretation:
The chart clearly respects Mind Curve Theory structure:
CHoCH/BOS confirms internal order flow
Reversal zone is placed at a curve top (premium)
Support base (discount zone) is yet to be revisited
The curve shape guides a possible rounded rejection scenario, pushing price down into the major support, aligning with smart money liquidity grab behavior.
📊 Strategic Insight:
This is a classic smart money trap — fake bullish breakout, quick grab of early breakout traders’ stops, followed by a decisive turn from supply.
Traders should monitor:
Candle structure at current levels
Reaction to minor CHoCH zone (~144.400)

Learn Your EDGE - Trust Your EDGEYou can learn a methodology trust the methodology and be consistent.
This weekly planning session is based on the H4 Indices, the idea is to do another major basket analysis after Tuesday trading. This analysis examined the AUD/USD, GBP/USD, USDJPY & USDCAD.
H4 Indices Portfolio Selection
BULLISH: AUD, JPY, GBP, CAD, NZD
BEARISH: USD, EUR,
-------------------------
BUY PAIRS: AUDUSD, GBPUSD, NZDUSD
SELL PAIRS: EURAUD, USDCAD, USDJPY

The profitability of TA trading rules in the Bitcoin market█ The profitability of technical trading rules in the Bitcoin market
The Bitcoin market, known for its wild fluctuations, poses a unique challenge for traders: Is it possible to consistently profit using technical trading rules?
Recent research analyzing Bitcoin's price data from July 2010 to January 2019 has shed light on this question, focusing on the effectiveness of seven trend-following indicators.
The research was conducted by Gerritsen et al. Notably, the trading range breakout rule emerged as a promising strategy, often outperforming the traditional buy-and-hold approach.
█ Some Background into the Bitcoin Market
Bitcoin's price path suggests market inefficiency, likely due to its short history and the erratic behaviors of market participants. Previous studies on Bitcoin's efficiency mainly focused on its predictability from a random walk perspective, leaving the performance of technical trading rules on Bitcoin prices largely unexplored.
The core aim of this study is to examine the profitability of technical trading rules, specifically to determine if these rules can surpass a basic buy-and-hold strategy.
By applying seven well-documented trading rules and analyzing their performance through the Sharpe ratio, the study seeks to provide practical insights for Bitcoin traders.
█ Methodology
The study uses daily price data from July 17, 2010, to December 31, 2018, totaling 3,084 daily observations. Gerritsen and team removed a brief period in 2011 due to a Mt. Gox hack and integrated data from Coinmarketcap starting April 28, 2013. The research also considers the risk-free rate, using 3-month US Treasury bill returns for its analysis.
█ Trading Rules Analyzed
1. Moving Averages (MA): This strategy issues buy signals when the recent price or its short-term average exceeds a longer-term average and sell signals in the opposite scenario. It tested combinations like 1-day vs. 50-day, 2-day vs 150-day, and 5-day vs 200-day averages.
2. Trading Range Breakout (TRB): It looks for price breakouts beyond the highest and lowest prices of a predefined period (50, 150, 200 days), signaling buys for breakouts above the high and sells below the low.
3. Moving Average Convergence Divergence (MACD): The MACD rule uses two exponential moving averages (EMAs), and triggers buy signals when the MACD line (the difference between a 12-day and a 26-day EMA) is above zero, and sell signals when it is below zero. It also examines the MACD signal line and MACD histogram as additional signals.
4. Rate of Change (ROC): This rule compares the current price with the price n days ago (commonly 10 days) to determine market momentum and issue buy/sell signals. The rule suggests buying when the ROC is positive, indicating upward momentum, and selling when it is negative, indicating downward momentum.
5. On-Balance-Volume (OBV): This volume-based indicator predicts price movements based on volume flow, asserting that volume changes precede price changes. The study applied MA rules to the OBV to generate signals, buying when the short-term MA of OBV crosses the long-term MA from below, and selling when it crosses from above.
6. Relative Strength Index (RSI): A momentum oscillator that identifies overbought or oversold conditions, suggesting buy signals when below 30 and sell signals above 70.
7. Bollinger Bands (BB): This strategy uses a moving average with upper and lower bands based on standard deviations from the MA, issuing buy signals when the price touches the lower band and sell signals at the upper band.
█ Strategies and Evaluation
The study applied each trading rule in three distinct strategies:
Literal Interpretation: Buying or selling Bitcoin directly based on the signal, including short positions.
Long Positions Only: Considering only buy signals due to the practical challenges of shorting Bitcoin on many exchanges.
Default Long Position with Adjustment on Signals: Maintaining a default long position, doubling investment on buy signals, and moving to risk-free assets on sell signals.
The performance of these strategies was evaluated using the Sharpe ratio, comparing the excess returns of the trading strategies over the risk-free rate to their volatility. A higher Sharpe ratio indicates a more efficient risk-adjusted return. The study used bootstrapping to assess the statistical significance of the Sharpe ratio differences between each trading rule strategy and a benchmark buy-and-hold strategy.
█ Key Findings
The study finds mixed results across different technical trading strategies when applied to Bitcoin.
Notably, the trading range breakout (TRB) rule consistently offers higher Sharpe ratios than a buy-and-hold strategy, signifying its superior performance.
On average, TRB strategies yield a Sharpe ratio of around 0.08, marking them as statistically significant against the buy-and-hold benchmark. This rule's success is further highlighted in specific periods, such as 2011–2012, 2013–2014, and 2017–2018, where its Sharpe ratios were notably higher than those of the buy-and-hold approach. The significant outperformance in these periods underscores the TRB rule's adaptability to market dynamics.
While most other technical trading rules did not consistently outperform the buy-and-hold strategy, certain strategies like MACD showed significant outperformance in specific applications (Strategy 2), illustrating the nuanced effectiveness of technical trading rules in the Bitcoin market.
Counter-trend indicators, such as the Relative Strength Index and Bollinger Bands, generally underperformed compared to the buy-and-hold benchmark, sometimes yielding negative Sharpe ratios.
█ Sensitivity to Market Conditions
The effectiveness of the TRB strategy, in particular, seems to be highly dependent on the prevailing market conditions. During periods of strong trends (either bull or bear markets), the TRB rule demonstrated notable outperformance.
However, during more stable periods, like 2015–2016, the TRB rule and most other trading rules did not show a significant advantage over the buy-and-hold strategy, aligning with the adaptive market hypothesis suggesting that the performance of trading strategies is contingent upon environmental factors.
█ Limitations and Future Research
One notable limitation is the focus solely on Bitcoin, leaving the question of whether these findings can be generalized to other cryptocurrencies.
Additionally, the analysis does not account for transaction costs, potentially affecting the trading strategies' profitability. Future research is encouraged to extend the investigation to other leading cryptocurrencies and to consider the impact of transaction costs on the profitability of the trading range breakout rule and other technical trading strategies.
█ Reference
Gerritsen, D.F., et al. (xxxx). The profitability of technical trading rules in the Bitcoin market. Finance Research Letters, xxx(x), xxx-xxx.
-----------------
Disclaimer
This is an educational study for entertainment purposes only.
The information in my Scripts/Indicators/Ideas/Algos/Systems does not constitute financial advice or a solicitation to buy or sell securities. I will not accept liability for any loss or damage, including without limitation any loss of profit, which may arise directly or indirectly from the use of or reliance on such information.
All investments involve risk, and the past performance of a security, industry, sector, market, financial product, trading strategy, backtest, or individual's trading does not guarantee future results or returns. Investors are fully responsible for any investment decisions they make. Such decisions should be based solely on evaluating their financial circumstances, investment objectives, risk tolerance, and liquidity needs.
My Scripts/Indicators/Ideas/Algos/Systems are only for educational purposes!

USDJPY Bull Flag PatternHi Traders!
There is a bull flag pattern developing on the USDJPY 1D chart.
Here are the details:
The price action looks bullish, and the market is currently in a consolidation phase in the flag's channel as the flag pattern is in its early phase. The market is still above the 20 EMA, which is a bullish signal. As long as the market remains above the EMA and flag channel support, we will remain bullish on this pair.
Preferred Direction: Buy
Resistance (FLAG CHANNEL): 148.830
Support (FLAG CHANNEL): 146.680
Technical Indicators: 20 EMA
Please make sure to click on the like/boost button 🚀 as your support greatly helps.
Trade safely and responsibly.
BluetonaFX

SILVER Neckline BreakHi Traders!
SILVER has broken below the neckline break in its head-and-shoulders pattern, and there is a possibility for a continuation to the downside if the market continues to stay below the neckline.
Here are the details:
After the initial momentum break below the neckline, the market is now retesting the neckline as resistance, and the 20 EMA has lined up perfectly with it.
We are looking for the market to stay below both the neckline and 20 EMA and look for exit targets near the 21.90 level.
Preferred Direction: Sell
Technical Indicators: 20 EMA
Resistance: 23.650
Support: 22.681
Please make sure to click on the like/boost button 🚀 as your support greatly helps.
Trade safely and responsibly.
BluetonaFX

EURUSD Downside ContinuesHi Traders!
EURUSD looks to be continuing to the downside, and there is potential for a support price break.
Here are the details:
The market continues to swing lower with lower highs and lower lows; the price has also broken below the 20 EMA recently.
We are looking for the market to remain below the 20 EMA to continue downwards towards the support area. Should the market reach the support area, there may be some demand there as the market will not have been that low in a month.
If there is a break below the support area, then the target level is 1.08300.
Preferred Direction: Sell
Technical Indicators: 20 EMA
Resistance: 1.09547
Support Area: 1.08929–1.08700
Target Level: 1.08300
Please make sure to click on the like/boost button 🚀 as your support greatly helps.
Trade safely and responsibly.
BluetonaFX

EURUSD Double Top OpportunityHi Traders!
EURUSD is forming a potential double-top pattern, and there is great risk-reward potential for shorting opportunities near the resistance.
Here are the details:
The market tested the previous month's high of 1.10173, but the bears are holding very strongly around this level, which has currently formed a double-top pattern on the chart.
Preferred Direction: Sell
Entry Level: 1.09960
Stop Level: 0.65089
Target Level: 1.10771
Technical Indicators: 20 EMA
Please make sure to click on the like/boost button 🚀 as your support greatly helps.
Trade safely and responsibly.
BluetonaFX

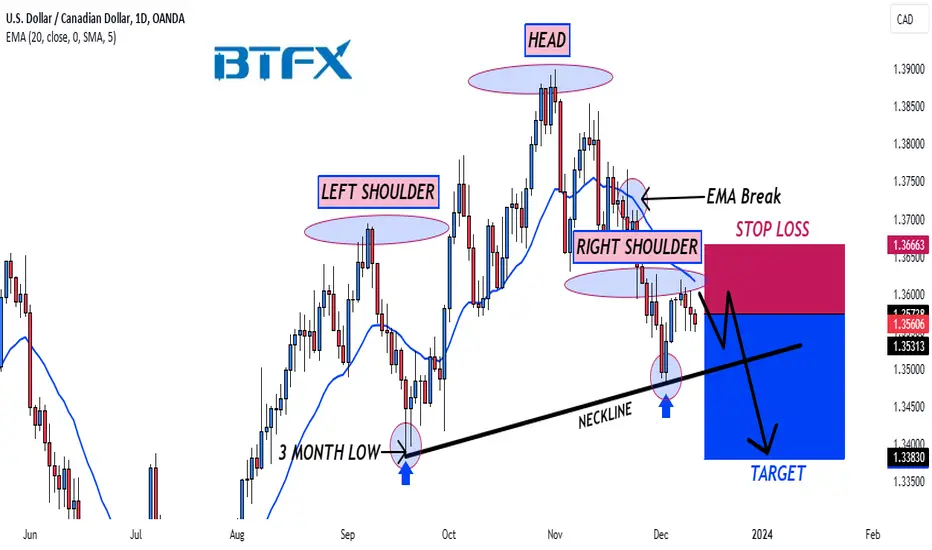
USDCAD Approaching The 3-Month NecklineHi Traders!
USDCAD has formed a head-and-shoulders pattern and is approaching the neckline.
Here are the details:
There is a current lack of buyers in the market, and the market is trending down with swings of lower highs and lower lows. Our plan is to sell rallies looking for a break below the neckline and target the 3-month low at the 1.33802 level.
Preferred Direction: Sell
Entry Level: 1.35738
Stop Level: 1.36663
Target Level: 1.33802
Technical Indicators: 20 EMA
Please make sure to click on the like/boost button 🚀 as your support greatly helps.
Trade safely and responsibly.
BluetonaFX
BluetonaFX - EURUSD Pullback to Previous Triangle BreakHi Traders!
EURUSD is on a pullback after breaking and closing above the ascending triangle resistance, and there are opportunities for short entries to target the previous resistance break.
Price Action 📊
After the intital break and close above the triangle resistance, the market rallied to create a new monthly high at the 1.09652 level. Now the market is on a pullback to possibly re-test the triangle break.
Fundamental Analysis 📰
The ECB said on Tuesday that the eurozone's struggling commercial property sector could continue for years, which poses a big threat to the banks and investors that financed it. Additionally, the ECB recently confirmed that interest rates will remain unchanged for the next few quarters, which will reduce demand for the euro.
Support 📉
1.07564: PREVIOUS TRENDLINE RESISTANCE
Resistance 📈
1.09652: WEEKLY HIGH
Risk ⚠️
No more than 2% of your capital.
Reward 💰
At least 4% of your capital.
Please make sure to click on the like/boost button 🚀 as your support greatly helps.
Trade safely and responsibly.
BluetonaFX

BluetonaFX - CHFJPY Resistance SHORT IdeaHi Traders!
There is a resistance short-to-support opportunity on the CHFJPY 1D chart.
Price Action 📊
The market has reached the 2-month resistance at 166.601 (August 2023 high), and bears are currently holding strong at this level. A continued hold here will most likely lead to a pullback to the support level at 164.000.
We are looking for the bears to hold and close below the market resistance level, which will be an entry signal to go short at the resistance level.
Fundamental Analysis 📰
With the current rising geopolitical tensions, the safe-haven proxy currencies, CHF and JPY, tend to be the likely outperformers in the foreign exchange market.
Support 📉
164.000: PREVIOUS RESISTANCE
Resistance 📈
166.601: AUGUST 2023 HIGH
Risk ⚠️
No more than 2% of your capital.
Reward 💰
At least 4% of your capital.
Please make sure to click on the like/boost button 🚀 as your support greatly helps.
Trade safely and responsibly.
BluetonaFX
