SPY Buyers In Panic! SELL!
My dear subscribers,
My technical analysis for SPY is below:
The price is coiling around a solid key level - 669.20
Bias - Bearish
Technical Indicators: Pivot Points Low anticipates a potential price reversal.
Super trend shows a clear sell, giving a perfect indicators' convergence.
Goal - 663.47
About Used Indicators:
By the very nature of the supertrend indicator, it offers firm support and resistance levels for traders to enter and exit trades. Additionally, it also provides signals for setting stop losses
Disclosure: I am part of Trade Nation's Influencer program and receive a monthly fee for using their TradingView charts in my analysis.
———————————
WISH YOU ALL LUCK
Tecnicalanalysis

EURUSD Massive Short! SELL!
My dear followers,
This is my opinion on the EURUSD next move:
The asset is approaching an important pivot point 1.1741
Bias - Bearish
Safe Stop Loss - 1.1749
Technical Indicators: Supper Trend generates a clear short signal while Pivot Point HL is currently determining the overall Bearish trend of the market.
Goal - 1.1727
About Used Indicators:
For more efficient signals, super-trend is used in combination with other indicators like Pivot Points.
Disclosure: I am part of Trade Nation's Influencer program and receive a monthly fee for using their TradingView charts in my analysis.
———————————
WISH YOU ALL LUCK

NZDUSD: Expecting Bearish Continuation! Here is Why:
Remember that we can not, and should not impose our will on the market but rather listen to its whims and make profit by following it. And thus shall be done today on the NZDUSD pair which is likely to be pushed down by the bears so we will sell!
Disclosure: I am part of Trade Nation's Influencer program and receive a monthly fee for using their TradingView charts in my analysis.
❤️ Please, support our work with like & comment! ❤️

EURGBP: Bullish Continuation & Long Signal
EURGBP
- Classic bullish setup
- Our team expects bullish continuation
SUGGESTED TRADE:
Swing Trade
Long EURGBP
Entry Point - 0.8707
Stop Loss - 0.8702
Take Profit - 0.8718
Our Risk - 1%
Start protection of your profits from lower levels
Disclosure: I am part of Trade Nation's Influencer program and receive a monthly fee for using their TradingView charts in my analysis.
❤️ Please, support our work with like & comment! ❤️

EURCHF What Next? BUY!
My dear friends,
EURCHF looks like it will make a good move, and here are the details:
The market is trading on 0.9336 pivot level.
Bias - Bullish
Technical Indicators: Supper Trend generates a clear long signal while Pivot Point HL is currently determining the overall Bullish trend of the market.
Goal - 0.9347
About Used Indicators:
Pivot points are a great way to identify areas of support and resistance, but they work best when combined with other kinds of technical analysis
Disclosure: I am part of Trade Nation's Influencer program and receive a monthly fee for using their TradingView charts in my analysis.
———————————
WISH YOU ALL LUCK

GBPJPY Under Pressure! SELL!
My dear friends,
Please, find my technical outlook for GBPJPY below:
The instrument tests an important psychological level 198.72
Bias - Bearish
Technical Indicators: Supper Trend gives a precise Bearish signal, while Pivot Point HL predicts price changes and potential reversals in the market.
Target - 198.35
Recommended Stop Loss - 198.95
About Used Indicators:
Super-trend indicator is more useful in trending markets where there are clear uptrends and downtrends in price.
Disclosure: I am part of Trade Nation's Influencer program and receive a monthly fee for using their TradingView charts in my analysis.
———————————
WISH YOU ALL LUCK

TA Never Fails, But Traders Often Do
Why Technical Analysis Doesn’t Fail, and How to Make It Work for You
Has it ever happened to you that your system or technical analysis gives you the perfect signal… and the trade still goes wrong? And then, other times, with the exact same pattern, everything clicks magically and you end up with textbook profits, the kind proudly posted on social media.
Every trader has felt that same confusion at some point. At some stage in their career, every trader has questioned whether technical analysis really works. And if that question still lingers unanswered in your mind, this post is for you.
Here, I’ll walk you through why technical analysis sometimes seems to work like magic and other times fails miserably, and, more importantly, how understanding its true role can turn it into a tool that meaningfully strengthens your trading
Understanding the Real Role and Reach of Technical Analysis
At its core, technical analysis (TA) studies past price and volume behavior. But here’s the key point many overlook: expecting it to predict the future with certainty is like assuming that because something happened under certain conditions once, it will play out exactly the same way again. That’s rarely true.
When you rely on a chart pattern or setup, what you’re really hoping for is that the market environment hasn’t changed much. But markets don’t stay still. They are dynamic, adaptive, and constantly shifting. That’s why sometimes the “perfect” signal delivers textbook profits… and other times it collapses into a loss.
I’m sure you can relate: you spot the perfect setup, take the trade with full confidence, everything looks aligned, and then Powell makes a comment, volatility spikes, and your stop is hit in seconds. Did technical analysis fail? Not really. The conditions changed, and the past environment could not be reproduced.
From this perspective, TA stops being a deterministic tool (“if price breaks support, the market will fall”) and becomes a probabilistic one (“if price breaks support, there’s a certain probability the market will fall”). This isn’t a weakness, it’s an honest recognition of the uncertainty that governs financial markets and their ever changing nature.
When we strip away the myths and put technical analysis in its rightful place, it becomes clear: at best, TA allows us to frame probabilities, never certainties. It’s not a crystal ball, it’s a framework for making informed probabilistic assessments in a world that will always remain uncertain.
Where the True Power of TA Really Lies
Take the classic example: “if price breaks support, the market has a higher probability of falling than of rising.” That statement doesn’t promise certainty, but if it turns out that, say, 60% of the time the market does fall after breaking support, then you’ve uncovered something valuable: an edge.
And here’s where trading shifts from chasing luck to building consistency. If out of every 10 trades, 6 follow through in your favor, then all you really need is solid risk management, for example, keeping a minimum 1:1 risk to reward ratio. Do that, and over the long run you don’t just “sometimes win,” you run a system with a positive expectancy.
Once you’ve found that edge, the real trick is repetition. And this isn’t just motivational talk, it’s math. Statistics has a law (and in science, a law means tested truth) that guarantees the more you repeat your process, the closer your actual results will move toward that expected 60/40 edge. With discipline and patience, the math will always pull you back toward being a long term winner.
This also means you don’t second guess yourself the next time the market breaks support just because the last time it didn’t work out (thanks, Powell). You keep playing your probabilistic edge. The outcome of a single trade is irrelevant, what matters is the process repeated over time. I wrote about this earlier, and it’s worth remembering: consistency in applying your edge always beats obsessing over one result.
TA as a Compass, Not a Crystal Ball
The smartest and most effective use of technical analysis is not to predict exact prices, but to build a probabilistic edge.
TA only becomes truly powerful when it’s integrated into a system with positive expectancy, not when it’s treated like an oracle. It’s not about guessing where the next tick will land, but about shaping a repeatable process that, over time, compounds into long term gains.
Seen in this light, TA stops being a magic wand and instead becomes a compass, a steady guide to help you navigate with consistency. You don’t need to know the exact shape of every curve in the road. What you need is a reliable compass and a clear map that, with enough repetition, will get you to your destination.
How to Make TA Not Fail You
The key takeaway is simple: the problem isn’t that technical analysis “fails,” but how we interpret it and what we expect from it. Demanding certainty only leads to frustration and blinds us to its real value.
Used probabilistically and as part of a structured system, TA becomes a valuable ally. So the next time that ‘perfect setup’ fails, don’t waste energy asking what went wrong. You already know, it’s just uncertainty doing its job. Don’t let it shake your confidence, and don’t let Powell, or anything else, ruin your day. Instead, focus on the next repetition, because that’s where your edge truly lives.
The market doesn’t owe you certainty. But with an edge and discipline, probability will reward you with consistency, and that’s what compounds into real results
________
👉 If you’d like to dig deeper into this mindset shift, check out my earlier post on True Laser Vision, where I explain why projecting the value of your account is infinitely more powerful than trying to project the price of an asset. And if you’d like a more structured walk through these ideas, visit my profile, you’ll find plenty of posts where I break down how probability, expectancy, and discipline can catapult your trading to the next level. Follow along if you want to keep sharpening these skills
AUDNZD: Bullish Continuation
Looking at the chart of AUDNZD right now we are seeing some interesting price action on the lower timeframes. Thus a local move up seems to be quite likely.
Disclosure: I am part of Trade Nation's Influencer program and receive a monthly fee for using their TradingView charts in my analysis.
❤️ Please, support our work with like & comment! ❤️

EURUSD: Bearish Continuation & Short Trade
EURUSD
- Classic bearish formation
- Our team expects pullback
SUGGESTED TRADE:
Swing Trade
Short EURUSD
Entry - 1.1751
Sl - 1.1764
Tp - 1.1727
Our Risk - 1%
Start protection of your profits from lower levels
Disclosure: I am part of Trade Nation's Influencer program and receive a monthly fee for using their TradingView charts in my analysis.
❤️ Please, support our work with like & comment! ❤️

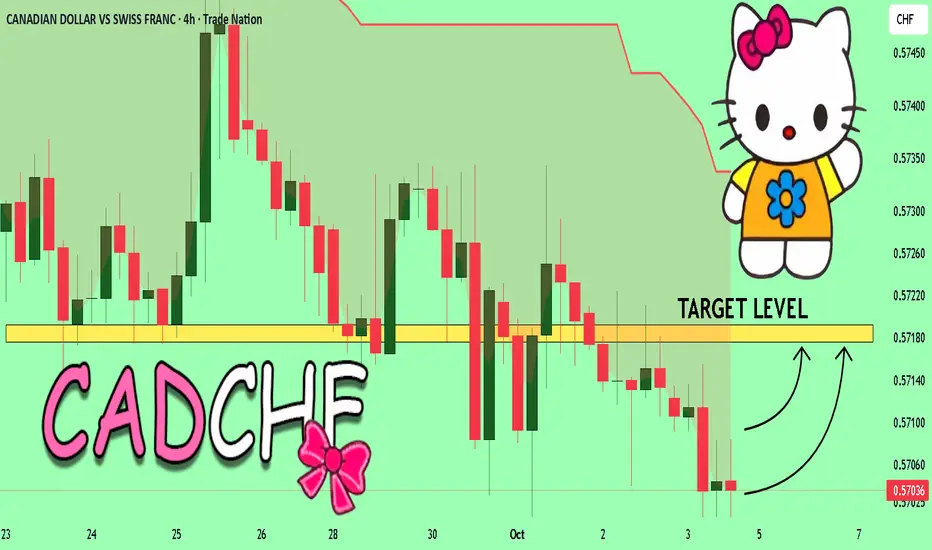
CADCHF My Opinion! BUY!
My dear subscribers,
This is my opinion on the CADCHF next move:
The instrument tests an important psychological level 0.5705
Bias - Bullish
Technical Indicators: Supper Trend gives a precise Bullish signal, while Pivot Point HL predicts price changes and potential reversals in the market.
Target - 0.5717
About Used Indicators:
On the subsequent day, trading above the pivot point is thought to indicate ongoing bullish sentiment, while trading below the pivot point indicates bearish sentiment.
Disclosure: I am part of Trade Nation's Influencer program and receive a monthly fee for using their TradingView charts in my analysis.
———————————
WISH YOU ALL LUCK
GOLD Technical Analysis! SELL!
My dear friends,
Please, find my technical outlook for GOLD below:
The instrument tests an important psychological level 3881.0
Bias - Bearish
Technical Indicators: Supper Trend gives a precise Bearish signal, while Pivot Point HL predicts price changes and potential reversals in the market.
Target - 3868.0
Recommended Stop Loss - 3889.0
About Used Indicators:
Super-trend indicator is more useful in trending markets where there are clear uptrends and downtrends in price.
Disclosure: I am part of Trade Nation's Influencer program and receive a monthly fee for using their TradingView charts in my analysis.
———————————
WISH YOU ALL LUCK

EURCHF Technical Analysis! SELL!
My dear friends,
EURCHF looks like it will make a good move, and here are the details:
The market is trading on 0.9341 pivot level.
Bias - Bearish
Technical Indicators: Supper Trend generates a clear short signal while Pivot Point HL is currently determining the overall Bearish trend of the market.
Goal - 0.9333
About Used Indicators:
Pivot points are a great way to identify areas of support and resistance, but they work best when combined with other kinds of technical analysis
Disclosure: I am part of Trade Nation's Influencer program and receive a monthly fee for using their TradingView charts in my analysis.
———————————
WISH YOU ALL LUCK

EURUSD Trading Opportunity! BUY!
My dear friends,
EURUSD looks like it will make a good move, and here are the details:
The market is trading on 1.1675 pivot level.
Bias - Bullish
Technical Indicators: Supper Trend generates a clear long signal while Pivot Point HL is currently determining the overall Bullish trend of the market.
Goal - 1.1738
About Used Indicators:
Pivot points are a great way to identify areas of support and resistance, but they work best when combined with other kinds of technical analysis
Disclosure: I am part of Trade Nation's Influencer program and receive a monthly fee for using their TradingView charts in my analysis.
———————————
WISH YOU ALL LUCK

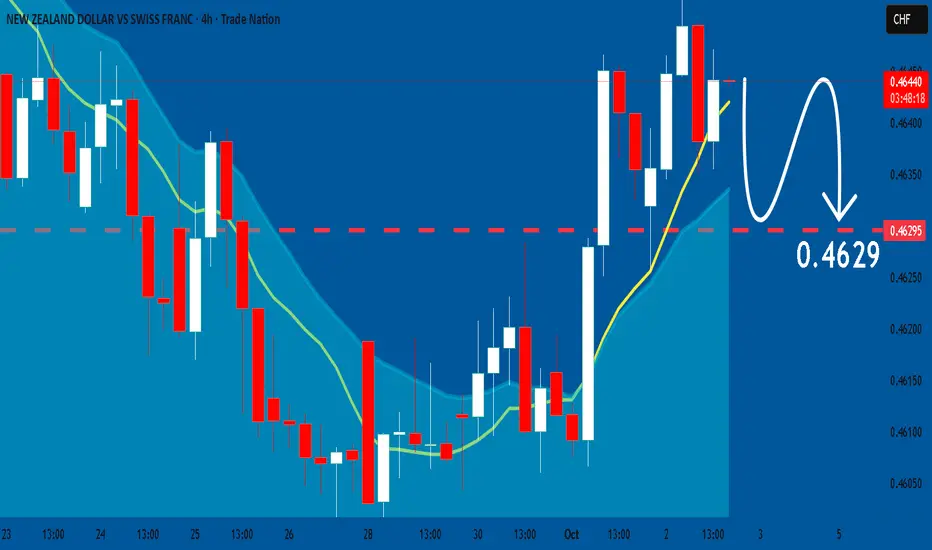
NZDCHF: Will Start Falling! Here is Why:
Balance of buyers and sellers on the NZDCHF pair, that is best felt when all the timeframes are analyzed properly is shifting in favor of the sellers, therefore is it only natural that we go short on the pair.
Disclosure: I am part of Trade Nation's Influencer program and receive a monthly fee for using their TradingView charts in my analysis.
❤️ Please, support our work with like & comment! ❤️
AUDCAD: Long Trading Opportunity
AUDCAD
- Classic bullish formation
- Our team expects growth
SUGGESTED TRADE:
Swing Trade
Buy AUDCAD
Entry Level - 0.9206
Sl - 0.9200
Tp - 0.9217
Our Risk - 1%
Start protection of your profits from lower levels
Disclosure: I am part of Trade Nation's Influencer program and receive a monthly fee for using their TradingView charts in my analysis.
❤️ Please, support our work with like & comment! ❤️

GBPNZD Set To Grow! BUY!
My dear friends,
Please, find my technical outlook for GBPNZD below:
The price is coiling around a solid key level - 2.3091
Bias - Bullish
Technical Indicators: Pivot Points Low anticipates a potential price reversal.
Super trend shows a clear buy, giving a perfect indicators' convergence.
Goal - 2.3159
About Used Indicators:
The pivot point itself is simply the average of the high, low and closing prices from the previous trading day.
Disclosure: I am part of Trade Nation's Influencer program and receive a monthly fee for using their TradingView charts in my analysis.
———————————
WISH YOU ALL LUCK

AUDUSD Will Explode! BUY!
My dear subscribers,
My technical analysis for AUDUSD is below:
The price is coiling around a solid key level - 0.6592
Bias - Bullish
Technical Indicators: Pivot Points High anticipates a potential price reversal.
Super trend shows a clear buy, giving a perfect indicators' convergence.
Goal - 0.6603
My Stop Loss - 0.6585
About Used Indicators:
By the very nature of the supertrend indicator, it offers firm support and resistance levels for traders to enter and exit trades. Additionally, it also provides signals for setting stop losses
Disclosure: I am part of Trade Nation's Influencer program and receive a monthly fee for using their TradingView charts in my analysis.
———————————
WISH YOU ALL LUCK

NZDCAD: Bearish Forecast & Outlook
The charts are full of distraction, disturbance and are a graveyard of fear and greed which shall not cloud our judgement on the current state of affairs in the NZDCAD pair price action which suggests a high likelihood of a coming move down.
Disclosure: I am part of Trade Nation's Influencer program and receive a monthly fee for using their TradingView charts in my analysis.
❤️ Please, support our work with like & comment! ❤️

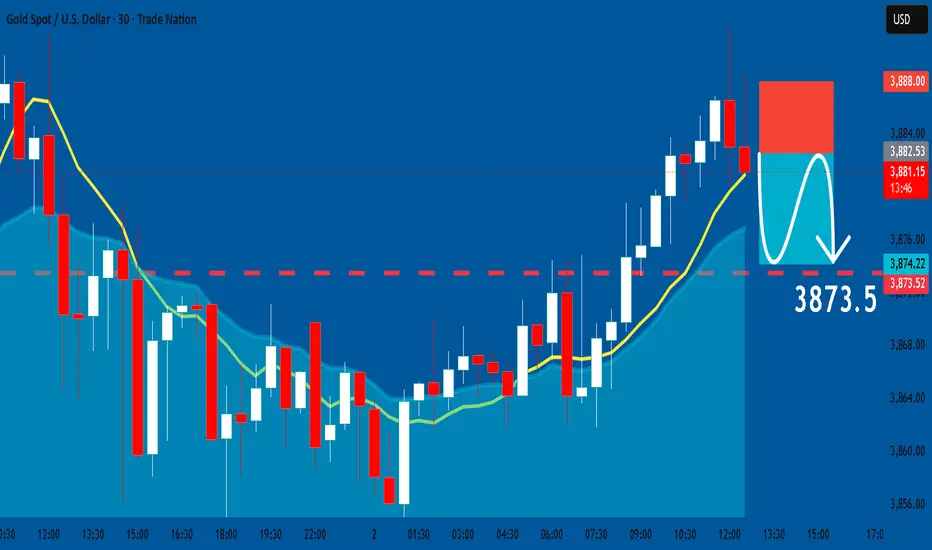
GOLD: Short Signal with Entry/SL/TP
GOLD
- Classic bearish pattern
- Our team expects retracement
SUGGESTED TRADE:
Swing Trade
Sell GOLD
Entry - 3882.5
Stop - 3888.0
Take - 3873.5
Our Risk - 1%
Start protection of your profits from lower levels
Disclosure: I am part of Trade Nation's Influencer program and receive a monthly fee for using their TradingView charts in my analysis.
❤️ Please, support our work with like & comment! ❤️
EURCAD A Fall Expected! SELL!
My dear friends,
My technical analysis for EURCAD is below:
The market is trading on 1.6384 pivot level.
Bias - Bearish
Technical Indicators: Both Super Trend & Pivot HL indicate a highly probable Bearish continuation.
Target - 1.6339
About Used Indicators:
A pivot point is a technical analysis indicator, or calculations, used to determine the overall trend of the market over different time frames.
Disclosure: I am part of Trade Nation's Influencer program and receive a monthly fee for using their TradingView charts in my analysis.
———————————
WISH YOU ALL LUCK

EURUSD Trading Opportunity! SELL!
My dear followers,
I analysed this chart on EURUSD and concluded the following:
The market is trading on 1.1752 pivot level.
Bias - Bearish
Technical Indicators: Both Super Trend & Pivot HL indicate a highly probable Bearish continuation.
Target - 1.1739
Safe Stop Loss - 1.1761
About Used Indicators:
A super-trend indicator is plotted on either above or below the closing price to signal a buy or sell. The indicator changes color, based on whether or not you should be buying. If the super-trend indicator moves below the closing price, the indicator turns green, and it signals an entry point or points to buy.
Disclosure: I am part of Trade Nation's Influencer program and receive a monthly fee for using their TradingView charts in my analysis.
———————————
WISH YOU ALL LUCK

GBPCAD: Bears Will Push
The price of GBPCAD will most likely collapse soon enough, due to the supply beginning to exceed demand which we can see by looking at the chart of the pair.
Disclosure: I am part of Trade Nation's Influencer program and receive a monthly fee for using their TradingView charts in my analysis.
❤️ Please, support our work with like & comment! ❤️

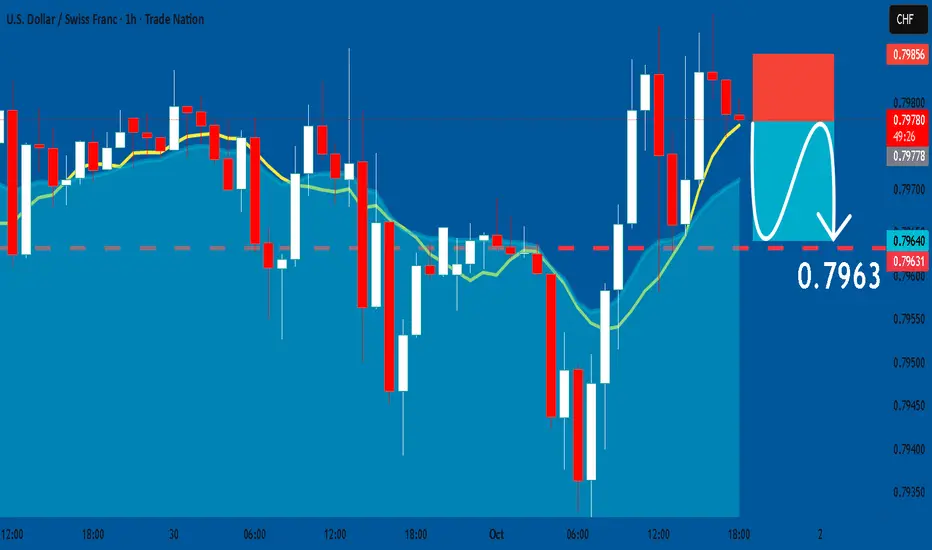
USDCHF: Short Signal Explained
USDCHF
- Classic bearish formation
- Our team expects pullback
SUGGESTED TRADE:
Swing Trade
Short USDCHF
Entry - 0.7978
Sl - 0.7985
Tp - 0.7963
Our Risk - 1%
Start protection of your profits from lower levels
Disclosure: I am part of Trade Nation's Influencer program and receive a monthly fee for using their TradingView charts in my analysis.
❤️ Please, support our work with like & comment! ❤️