GBPCHF: Short Signal with Entry/SL/TP
GBPCHF
- Classic bearish formation
- Our team expects fall
SUGGESTED TRADE:
Swing Trade
Sell GBPCHF
Entry Level - 1.0788
Sl - 1.0796
Tp - 1.0774
Our Risk - 1%
Start protection of your profits from lower levels
Disclosure: I am part of Trade Nation's Influencer program and receive a monthly fee for using their TradingView charts in my analysis.
❤️ Please, support our work with like & comment! ❤️
Tecnicalanalysis

NZDUSD My Opinion! SELL!
My dear friends,
Please, find my technical outlook for NZDUSD below:
The instrument tests an important psychological level 0.5930
Bias - Bearish
Technical Indicators: Supper Trend gives a precise Bearish signal, while Pivot Point HL predicts price changes and potential reversals in the market.
Target - 0.5903
About Used Indicators:
Super-trend indicator is more useful in trending markets where there are clear uptrends and downtrends in price.
Disclosure: I am part of Trade Nation's Influencer program and receive a monthly fee for using their TradingView charts in my analysis.
———————————
WISH YOU ALL LUCK

AUDNZD Set To Fall! SELL!
My dear friends,
Please, find my technical outlook for AUDNZD below:
The price is coiling around a solid key level - 1.1113
Bias - Bearish
Technical Indicators: Pivot Points Low anticipates a potential price reversal.
Super trend shows a clear sell, giving a perfect indicators' convergence.
Goal - 1.1104
Safe Stop Loss - 1.1118
About Used Indicators:
The pivot point itself is simply the average of the high, low and closing prices from the previous trading day.
Disclosure: I am part of Trade Nation's Influencer program and receive a monthly fee for using their TradingView charts in my analysis.
———————————
WISH YOU ALL LUCK

EURUSD: Will Keep Falling! Here is Why:
Looking at the chart of EURUSD right now we are seeing some interesting price action on the lower timeframes. Thus a local move down seems to be quite likely.
Disclosure: I am part of Trade Nation's Influencer program and receive a monthly fee for using their TradingView charts in my analysis.
❤️ Please, support our work with like & comment! ❤️

GBPJPY: Long Trade with Entry/SL/TP
GBPJPY
- Classic bullish setup
- Our team expects bullish continuation
SUGGESTED TRADE:
Swing Trade
Long GBPJPY
Entry Point - 199.06
Stop Loss - 198.80
Take Profit - 199.60
Our Risk - 1%
Start protection of your profits from lower levels
Disclosure: I am part of Trade Nation's Influencer program and receive a monthly fee for using their TradingView charts in my analysis.
❤️ Please, support our work with like & comment! ❤️

USDJPY What Next? BUY!
My dear subscribers,
My technical analysis for USDJPY is below:
The price is coiling around a solid key level - 146.94
Bias - Bullish
Technical Indicators: Pivot Points Low anticipates a potential price reversal.
Super trend shows a clear buy, giving a perfect indicators' convergence.
Goal - 147.66
About Used Indicators:
By the very nature of the supertrend indicator, it offers firm support and resistance levels for traders to enter and exit trades. Additionally, it also provides signals for setting stop losses
Disclosure: I am part of Trade Nation's Influencer program and receive a monthly fee for using their TradingView charts in my analysis.
———————————
WISH YOU ALL LUCK

GOLD Will Collapse! SELL!
My dear friends,
My technical analysis for GOLD is below:
The market is trading on 3648.4 pivot level.
Bias - Bearish
Technical Indicators: Both Super Trend & Pivot HL indicate a highly probable Bearish continuation.
Target - 3641.2
Recommended Stop Loss - 3652.3
About Used Indicators:
A pivot point is a technical analysis indicator, or calculations, used to determine the overall trend of the market over different time frames.
Disclosure: I am part of Trade Nation's Influencer program and receive a monthly fee for using their TradingView charts in my analysis.
———————————
WISH YOU ALL LUCK

"GBPAUD Daily Outlook – Key Support at 2.05, Bearish Breakdown I see you are analyzing the GBPAUD (British Pound / Australian Dollar) chart on the daily timeframe (1D). Let’s break it down:
---
1. Chart Pattern (Structure)
From your screenshot:
Price is consolidating inside a range/rectangle (sideways market) between roughly 2.02 – 2.10.
Currently, price is testing the lower range support around 2.05.
If the range breaks downward, it could form a distribution pattern / rectangle breakout (bearish continuation).
---
2. Support & Resistance Levels
Immediate resistance: 2.07 – 2.08 (mid-range & EMA resistance).
Strong resistance: 2.10 – 2.12 (top of the range).
Immediate support: 2.04 – 2.05 (bottom of the range).
Next support: 2.0150 (red line marked in your chart).
Major support: 2.00 psychological level, then 1.9750 – 1.9600 (Fibonacci zones shown on your chart).
---
3. Target Zones (if bearish breakout happens)
First target: 2.0150 (previous horizontal level).
Second target: 2.00 (psychological round number).
Third target (swing): 1.9750 – 1.9600 (Fibonacci 0.618 zone).
---
4. Stop Loss
If you are taking a short/sell trade, the stop loss should be above the recent swing high inside the range:
Safe SL: 2.08 – 2.085 (above range resistance).
---
✅ Summary (Daily Chart – GBPAUD)
Pattern: Sideways range / rectangle, potential bearish breakout.
Entry idea: Sell on breakdown below 2.045 – 2.05 zone.
Target 1: 2.0150
Target 2: 2.00
Target 3: 1.9750 – 1.9600
Stop loss: Above 2.08
---
⚠ Note: If price bounces strongly from 2.05, then we may see another push back toward 2.08 – 2.10, so watch for confirmation before entry.
Do you want me to give you a bullish alternative scenario also (in case support holds at 2.05)?

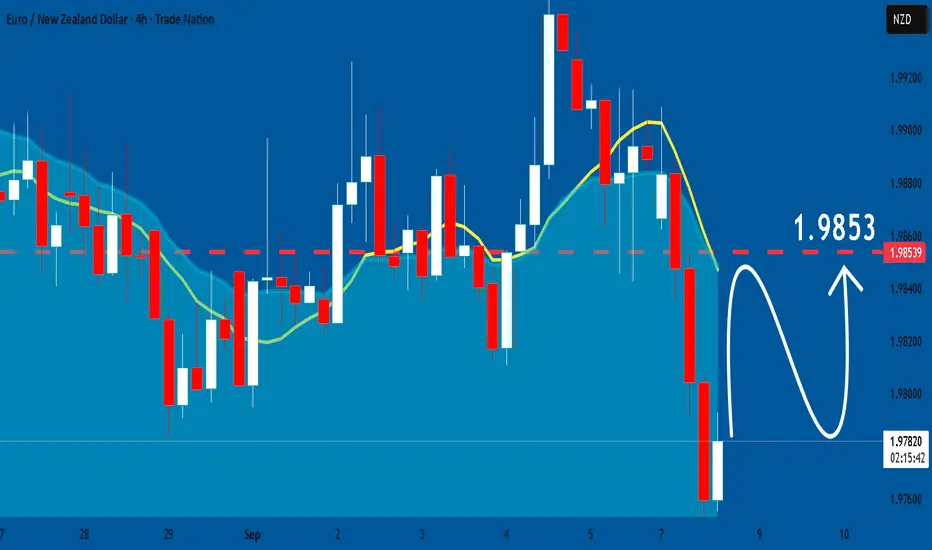
EURNZD: Bulls Will Push
Remember that we can not, and should not impose our will on the market but rather listen to its whims and make profit by following it. And thus shall be done today on the EURNZD pair which is likely to be pushed up by the bulls so we will buy!
Disclosure: I am part of Trade Nation's Influencer program and receive a monthly fee for using their TradingView charts in my analysis.
❤️ Please, support our work with like & comment! ❤️
GBPNZD: Bullish Continuation & Long Trade
GBPNZD
- Classic bullish formation
- Our team expects growth
SUGGESTED TRADE:
Swing Trade
Buy GBPNZD
Entry Level - 2.2800
Sl - 2.2769
Tp - 2.2874
Our Risk - 1%
Start protection of your profits from lower levels
Disclosure: I am part of Trade Nation's Influencer program and receive a monthly fee for using their TradingView charts in my analysis.
❤️ Please, support our work with like & comment! ❤️

GBPUSD The Target Is DOWN! SELL!
My dear followers,
I analysed this chart on GBPUSD and concluded the following:
The market is trading on 1.3533 pivot level.
Bias - Bearish
Technical Indicators: Both Super Trend & Pivot HL indicate a highly probable Bearish continuation.
Target - 1.3470
About Used Indicators:
A super-trend indicator is plotted on either above or below the closing price to signal a buy or sell. The indicator changes color, based on whether or not you should be buying. If the super-trend indicator moves below the closing price, the indicator turns green, and it signals an entry point or points to buy.
Disclosure: I am part of Trade Nation's Influencer program and receive a monthly fee for using their TradingView charts in my analysis.
———————————
WISH YOU ALL LUCK

AUDNZD My Opinion! BUY!
My dear followers,
This is my opinion on the AUDNZD next move:
The asset is approaching an important pivot point 1.1094
Bias - Bullish
Safe Stop Loss - 1.1083
Technical Indicators: Supper Trend generates a clear long signal while Pivot Point HL is currently determining the overall Bullish trend of the market.
Goal - 1.1117
About Used Indicators:
For more efficient signals, super-trend is used in combination with other indicators like Pivot Points.
Disclosure: I am part of Trade Nation's Influencer program and receive a monthly fee for using their TradingView charts in my analysis.
———————————
WISH YOU ALL LUCK

EURUSD Buyers In Panic! SELL!
My dear friends,
EURUSD looks like it will make a good move, and here are the details:
The market is trading on 1.1726 pivot level.
Bias - Bearish
Technical Indicators: Supper Trend generates a clear short signal while Pivot Point HL is currently determining the overall Bearish trend of the market.
Goal - 1.1687
About Used Indicators:
Pivot points are a great way to identify areas of support and resistance, but they work best when combined with other kinds of technical analysis
Disclosure: I am part of Trade Nation's Influencer program and receive a monthly fee for using their TradingView charts in my analysis.
———————————
WISH YOU ALL LUCK

EURAUD Set To Grow! BUY!
My dear friends,
Please, find my technical outlook for EURAUD below:
The instrument tests an important psychological level 1.7804
Bias - Bullish
Technical Indicators: Supper Trend gives a precise Bullish signal, while Pivot Point HL predicts price changes and potential reversals in the market.
Target - 1.7839
Recommended Stop Loss - 1.7788
About Used Indicators:
Super-trend indicator is more useful in trending markets where there are clear uptrends and downtrends in price.
Disclosure: I am part of Trade Nation's Influencer program and receive a monthly fee for using their TradingView charts in my analysis.
———————————
WISH YOU ALL LUCK

AUDUSD: Expecting Bearish Movement! Here is Why:
Balance of buyers and sellers on the AUDUSD pair, that is best felt when all the timeframes are analyzed properly is shifting in favor of the sellers, therefore is it only natural that we go short on the pair.
Disclosure: I am part of Trade Nation's Influencer program and receive a monthly fee for using their TradingView charts in my analysis.
❤️ Please, support our work with like & comment! ❤️

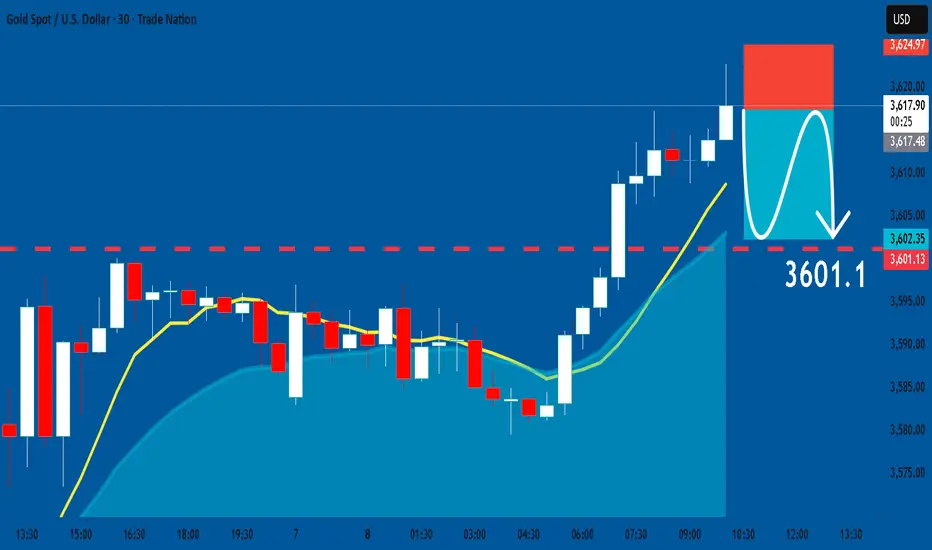
GOLD: Short Signal Explained
GOLD
- Classic bearish formation
- Our team expects pullback
SUGGESTED TRADE:
Swing Trade
Short GOLD
Entry - 3617.4
Sl - 3624.9
Tp -3601.1
Our Risk - 1%
Start protection of your profits from lower levels
Disclosure: I am part of Trade Nation's Influencer program and receive a monthly fee for using their TradingView charts in my analysis.
❤️ Please, support our work with like & comment! ❤️
Bitcoin – Short-Term Trend OutlookBitcoin – Short-Term Trend Outlook
Good day Traders,
Bitcoin continues to demonstrate a constructive short-term uptrend, whilst remaining within a corrective structure on the medium-term timeframe.
Chart Structure
A double-bottom pattern has now completed and confirmed, providing a base for the current move.
From a broader perspective, price action may be shaping a potential inverse head-and-shoulders formation, with the present wave contributing to its development. The pattern would be validated should price advance back towards the 117k region.
Elliott Wave Perspective
From an Elliott Wave standpoint, the current structure suggests that wave C remains incomplete, indicating scope for further upward movement.
MACD & Volume Analysis
MACD signals, supported by trading volume holding above the average line, highlight continued buying pressure, reinforcing the bullish outlook.
Trading Considerations
Upside remains favoured.
The 111k level is highlighted as an attractive intraday buying zone. The probability of success increases if price rotates further into the rising trendline, aligning with the broader bullish structure.
Final Thoughts
Overall, the technical landscape continues to support a bullish bias for BTC in the short term. Close attention should be paid to reactions around the 111k level and along the rising trendline to refine entry timing. This analysis reflects my current view of the market, and traders are encouraged to compare with their own perspectives.

XAUUSD – Early Week Trading OutlookXAUUSD – Early Week Trading Outlook
Good day Traders,
The Asian session opened the new week with only mild fluctuations in gold, before price rotated back into the major liquidity zone formed during last week’s advance.
Currently, gold is testing the 3585 support. A decisive close below this level on the M15 timeframe would suggest a short-term correction, opening the door for a light sell opportunity with downside potential towards 3560.
The 3560 level is technically significant as it coincides with the ascending trendline, making it a key area for long positions in line with the broader uptrend. From here, price could extend further, with the possibility of retesting all-time highs. Should price return to the trendline, traders considering fresh shorts must remain cautious and wait for clear reversal confirmation.
A further buying opportunity may also present itself near 3516, where the market previously cleared liquidity from the closest FVG zone.
In summary, corrective moves are likely before gold continues its broader trajectory. Any short exposure should be contingent upon strong confirmation, while the long side remains favoured at identified support levels.

EURUSD: Weak Market & Bearish Forecast
The charts are full of distraction, disturbance and are a graveyard of fear and greed which shall not cloud our judgement on the current state of affairs in the EURUSD pair price action which suggests a high likelihood of a coming move down.
Disclosure: I am part of Trade Nation's Influencer program and receive a monthly fee for using their TradingView charts in my analysis.
❤️ Please, support our work with like & comment! ❤️

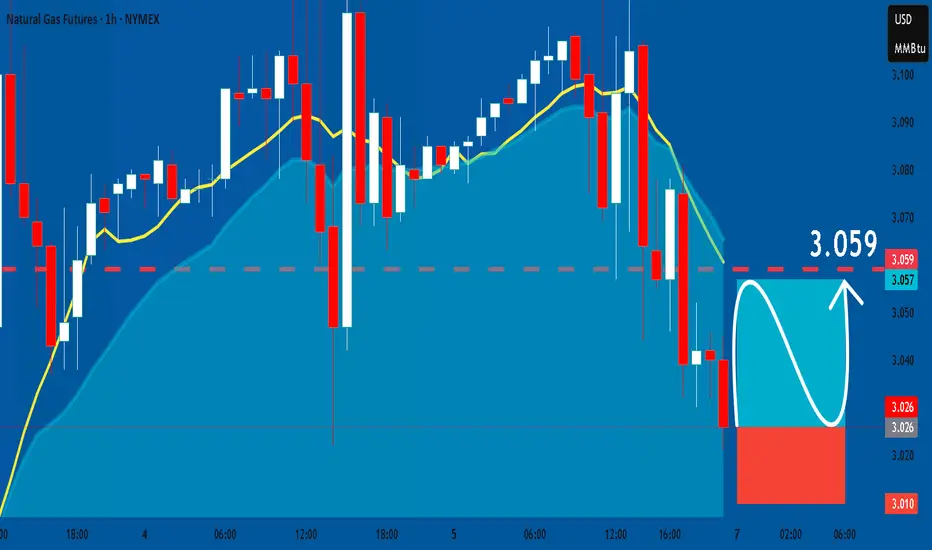
NATGAS: Great Trading Opportunity
NATGAS
- Classic bullish pattern
- Our team expects retracement
SUGGESTED TRADE:
Swing Trade
Buy NATGAS
Entry - 3.026
Stop - 3.010
Take - 3.059
Our Risk - 1%
Start protection of your profits from lower levels
Disclosure: I am part of Trade Nation's Influencer program and receive a monthly fee for using their TradingView charts in my analysis.
❤️ Please, support our work with like & comment! ❤️
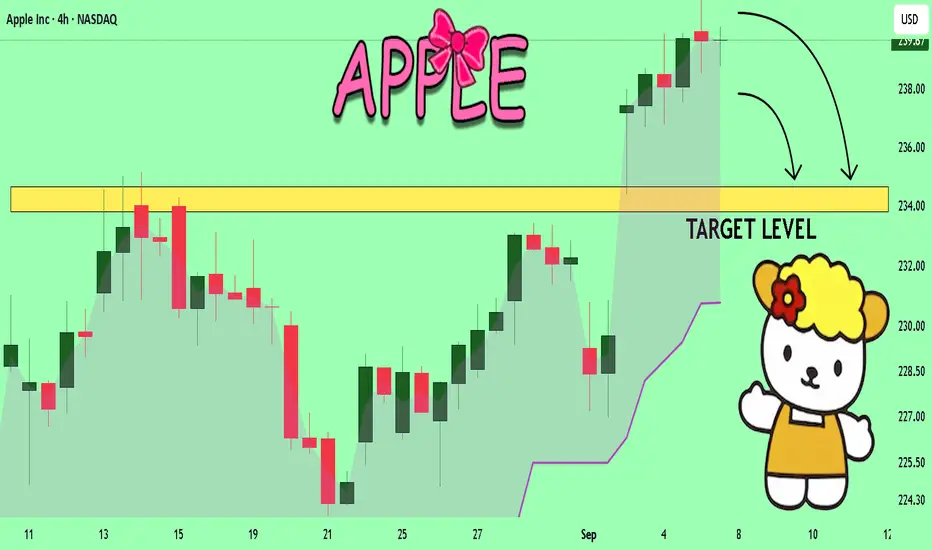
APPLE Massive Short! SELL!
My dear friends,
Please, find my technical outlook for APPLE below:
The price is coiling around a solid key level - 239.67
Bias - Bearish
Technical Indicators: Pivot Points High anticipates a potential price reversal.
Super trend shows a clear sell, giving a perfect indicators' convergence.
Goal - 234.66
About Used Indicators:
The pivot point itself is simply the average of the high, low and closing prices from the previous trading day.
Disclosure: I am part of Trade Nation's Influencer program and receive a monthly fee for using their TradingView charts in my analysis.
———————————
WISH YOU ALL LUCK
TESLA Under Pressure! SELL!
My dear followers,
This is my opinion on the TESLA next move:
The asset is approaching an important pivot point 350.79
Bias - Bearish
Safe Stop Loss - 354.45
Technical Indicators: Supper Trend generates a clear short signal while Pivot Point HL is currently determining the overall Bearish trend of the market.
Goal - 343.14
About Used Indicators:
For more efficient signals, super-trend is used in combination with other indicators like Pivot Points.
Disclosure: I am part of Trade Nation's Influencer program and receive a monthly fee for using their TradingView charts in my analysis.
———————————
WISH YOU ALL LUCK

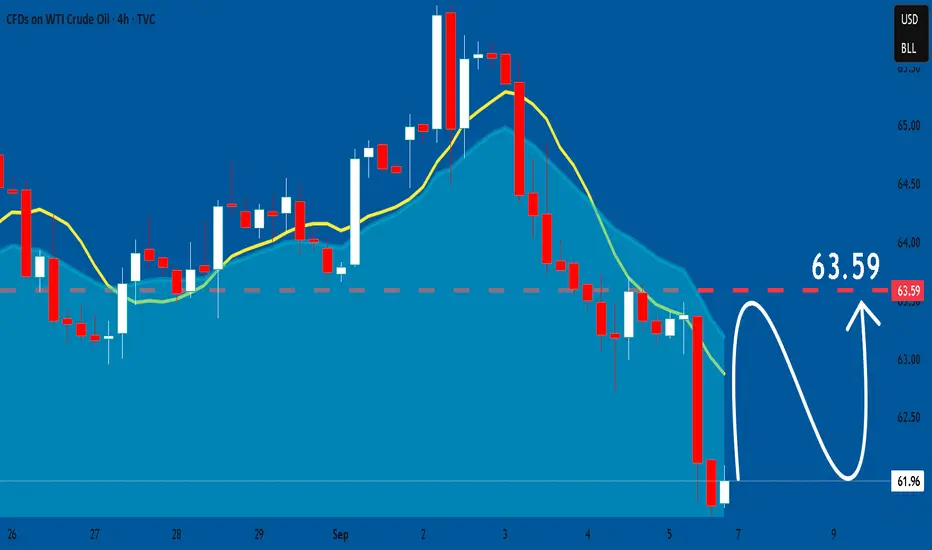
USOIL: Bullish Forecast & Outlook
Balance of buyers and sellers on the USOIL pair, that is best felt when all the timeframes are analyzed properly is shifting in favor of the buyers, therefore is it only natural that we go long on the pair.
Disclosure: I am part of Trade Nation's Influencer program and receive a monthly fee for using their TradingView charts in my analysis.
❤️ Please, support our work with like & comment! ❤️