Potential outside week and bullish potential for TPGEntry conditions:
(i) higher share price for ASX:TPG above the level of the potential outside week noted on 3rd October (i.e.: above the level of $5.19).
Stop loss for the trade would be:
(i) below the low of the outside week on 1st October (i.e.: below $4.96), should the trade activate.
Telecommunications

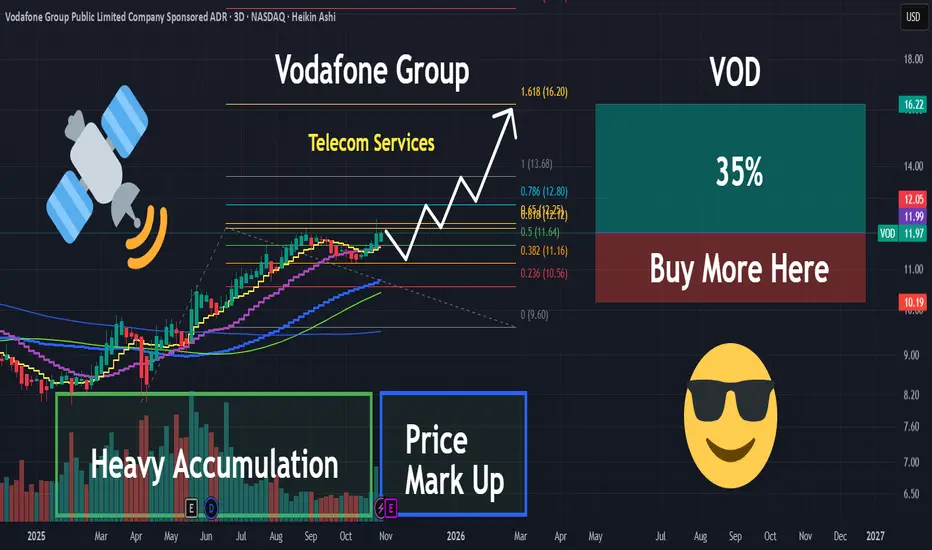
VOD | This Telecom Co. Is Ready to Explode Higher | LONGVodafone Group Plc engages in the telecommunication services in Europe and International. It offers mobile services that enable customers to call, text and access data, fixed line services, including broadband, television offerings, and voice and convergence services under the GigaKombi and Vodafone One names. It also provides mobile, fixed and a suite of converged communication services, such as Internet of Things (IoT) comprising managed IoT connectivity, automotive and insurance services, as well as smart metering and health solutions, cloud and security portfolio comprising public and private cloud services, as well as cloud-based applications and products for securing networks and devices and international voice, IP transit and messaging services to support business customers that include small home offices and large multi-national companies. The company was founded on July 17, 1984 and is headquartered in Newbury, the United Kingdom.
IBEX calling - get ready for earnings!This small customer service company has been very profitable and growing, with matching stock performance for the past two years.
They're responsive to the evolving customer service landscape and incorporating AI and technical advances so there are added efficiencies and resulting better margins.
The chart looks poised to blow, with the price consolidating for the past months.
Either this one will continue in its range or if earnings are good, it might really jump. Watch for earnings on Thursday, 9/11 after market.

Bullish potential detected for SPKEntry conditions:
(i) higher share price for ASX:SPK along with swing up of indicators such as DMI/RSI.
Depending on risk tolerance, the stop loss for the trade would be:
(i) below previous support of $2.23 from the open of 4th August, or
(i) below previous support of $2.19 from the open of 12th June.

Charter Communications (Revised) | CHTR | Long at $269.50 **This is a revised analysis from December 26, 2024: . My stop was triggered in that original trade after the recent price drop (some gains were taken at 13%, as noted).**
Charter Communications NASDAQ:CHTR stock recently dropped due to a disappointing Q2 2025 earnings report, with earnings per share of $9.18 missing estimates of $9.58 and a larger-than-expected loss of 111,000 residential internet customers. Despite the recent subscriber losses and increased competition, the following factors suggest long-term growth potential:
Network Expansion: Launch of 2x1 Gbps service in eight markets in 2025, boosting competitiveness.
Rural Growth: Rural revenue projected to reach 10–15% of total revenue by 2025.
Cox Acquisition: $34.5B merger expected to close by mid-2026, yielding $500M in annual cost savings by 2028 and enhancing market share.
Mobile and AI Strategies: Strong mobile growth and AI-driven customer service tools to improve retention and efficiency.
Lower Interest Rates: Reduced bowering costs to help with profit margins.
Charter's President/CEO recently grabbed $2.5 million in shares under $300. From a technical analysis perspective, there is an open price gap near $195 that could be of concern in the near-term. I foresee that being closed if the whole market flips or more bad news for the company arises. But, with a P/E of 7x and the industry average being near 13x, I believe NASDAQ:CHTR is a good value at the moment.
Thus, at $269.50, NASDAQ:CHTR is in a personal buy zone with a note of "risk" of a drop near $195 (a second personal entry point if it hits that level before targets are reached).
Targets into 2028:
$330.00 (+22.4%)
$375.00 (+39.1%)

Cable One | CABO | Long at $130.82Cable One NYSE:CABO is a leading broadband communications provider under the Sparklight brand, offering high-speed internet, cable TV, and phone services across 24 U.S. states.
Book Value: $315.50.
Positive:
Strong liquidity: Quick ratio 1.47 (above industry avg ~1.0).
Undervalued vs. industry (1.91x).
Large customer base: ~1.1M customers, 2.8M data subscribers.
Stable revenue: Broadband focus in non-metropolitan markets.
Insiders buying over $1 million in share recently while also being awarded options.
Recent change in leadership.
Negatives:
Medium-high bankruptcy risk: Altman Z-Score 1.36 (below industry ~2.5).
High leverage: D/E 1.78 (above industry ~1.0).
Weak earnings: Negative margins, declining profitability.
Suspended dividend.
Classify this one as a risky investment, but it is very undervalued at this price and the upcoming decline in interest rates may have a very positive effect on the company's stock (at least short-term: 5 million float, 19% short interest). Regardless, not one to put your life savings into. From a technical analysis perspective, I foresee a potential drop between $115 and $120 in the near-term and rise from there. It all depends on the upcoming earnings, so label this one a "gamble" with high bankruptcy risk.
Regardless of bottom predictions, NYSE:CABO is in a personal buy zone at $130.82 for a swing trade.
Targets into 2027:
$190.00 (+45.2%)
$250.00 (+91.1%)

Charter Communications | CHTR | Long at $353.00Charter Communications NASDAQ:CHTR has hit the bottom of my historical simple moving average band. It may consolidate for a while around the current price or dip in the near-term (potentially in the $270's), but dropping interest rates will be extremely beneficial for telecommunication companies in the long-term. There are two open price gaps on the daily chart ($700's) that will inevitably close - just a matter of when. With a 90M float and 12% short interest, it's a stock that could get interesting if upward momentum takes over. Earnings and cash flow growth are anticipated through 2027, so at $353.00, NASDAQ:CHTR is in a personal buy zone.
Target #1 = $400.00
Target #2 = $500.00
Target #3 = $600.00
Target #4 = $700.00
Target #5 = $740.00

Bearish potential detected for ABBEntry conditions:
(i) lower share price for ASX:ABB along with swing up of the DMI indicators and swing down of the RSI indicator, and
(ii) observation of market reaction at the support level at $3.80 (from the open of 6th February) after closing below 50 day MA.
Stop loss for the trade would be, dependent of risk tolerance:
(i) above the resistance level from the open of 28th February (i.e.: above $4.00),
(ii) above the resistance level from the open of 12th February (i.e.: above $4.08), or
(iii) above the resistance level from the open of 24th February (i.e.: above $4.17).

Liberty Latin America | LILA | Long at $6.37Liberty Latin America NASDAQ:LILA is a leading telecommunications company operating in over 20 countries across Latin America and the Caribbean under the consumer brands Flow, Liberty Communications, Más Móvil, BTC and Liberty Costa Rica. Insiders have been loading up shares after the recent drop post earnings, which got my attention. The company is expected to be profitable starting in 2025, but its stock has taken a tremendous hit over the past few years. On paper, the future looks bright for this large telecommunications company and it is trading at good value compared to peers and industry.
From a technical analysis perspective, my selected historical simple moving average lines are connecting with the price (which often means a future breakout). The recent dip, based on the financials and insider buying, may be a hidden opportunity for a future run up and the stock consolidates. However, as always, stay cautious. Thus, at $6.37, NASDAQ:LILA is in a personal buy zone.
Target #1 = $7.00
Target #2 = $8.00
Target #3 = $9.00
Target #4 = $10.00

T-MOBILE No signs of stopping this rally before $350.T-Mobile (TMUS) has been trading within a 12-year Channel Up since the October 2012 High. Since the weekly break-out on the May 20 2013 1W candle, the 1W MA200 (orange trend-line) has been the absolute Support of this pattern, never broken, offering the most optimal buy opportunities as close to is as possible every time the price broke below the 1W MA50 (blue trend-line).
The 1W RSI indicates that we are in a similar stage of the uptrend as the two mega Bullish Legs the preceded it. The Sine Waves accurately catch the tops (Higher Highs) of this Channel Up pattern, and the next one should be around $350 by the end of 2025. A really good opportunity to buy even on the current levels.
-------------------------------------------------------------------------------
** Please LIKE 👍, FOLLOW ✅, SHARE 🙌 and COMMENT ✍ if you enjoy this idea! Also share your ideas and charts in the comments section below! This is best way to keep it relevant, support us, keep the content here free and allow the idea to reach as many people as possible. **
-------------------------------------------------------------------------------
💸💸💸💸💸💸
👇 👇 👇 👇 👇 👇

FYBR Weekly BullflagAfter a catalyst with NYSE:VZ FBYR looks ready to run higher towards 40
- $35.93 is key area to hold for immediate push upwards
- May move with or without other telecoms

AT&T Investigates Data Leak Impacting MillionsTelecom giant AT&T ( NYSE:T ) finds itself embroiled in an investigation following a distressing data breach that has left millions of customers vulnerable to exploitation on the dark web. The incident, which occurred approximately two weeks ago, has thrust AT&T ( NYSE:T ) into the throes of cybersecurity scrutiny as it grapples with the fallout of compromised personal information.
Preliminary assessments reveal that the breach has affected a staggering 7.6 million current account holders and an additional 65.4 million former customers, raising alarms about the security protocols safeguarding sensitive customer data. The leaked dataset, dating back to 2019 or earlier, comprises a trove of personal information, including names, addresses, phone numbers, dates of birth, and Social Security numbers.
While AT&T ( NYSE:T ) moves swiftly to mitigate the fallout by resetting passcodes for affected users and extending credit monitoring services, the source of the leak remains shrouded in mystery. As investigations unfold, the company remains steadfast in its commitment to addressing customer concerns and fortifying its cybersecurity infrastructure.
This incident marks yet another blow to AT&T's reputation, following a recent cellular outage in February that left customers grappling with service disruptions. Despite assurances that the outage stemmed from internal system glitches rather than malicious cyber activity, the recurrence of such incidents underscores the ever-looming specter of cyber threats in an interconnected digital landscape.
For AT&T ( NYSE:T ), the stakes are high as it navigates the complex terrain of data security and customer trust. The company's proactive measures to engage affected users and offer remedial support signify a concerted effort to uphold its commitment to customer satisfaction amidst adversity.
As the telecom behemoth grapples with the fallout of this breach, the broader implications resonate across industries grappling with the escalating threat of cyber intrusions. With cybercriminals leveraging the dark web as a breeding ground for nefarious activities, the imperative for robust cybersecurity measures has never been more pressing.

"WOW Stock Presents Knife Catch Opportunity"Unveiling WOW Stock: Potential Double Bottom Signals Opportunity Amidst Knife Catch
WOW stock, an intriguing asset in the investment landscape, is garnering attention for its potential double bottom formation, offering investors a sharp knife catch opportunity. With the next test for breakout set at $5, a successful breach of this level could trigger a massive run-up in price. However, should $5 act as resistance, investors may anticipate a 30% return to secure profits and reload at lower levels.
Understanding WOW Stock
WOW stock represents an investment in WideOpenWest, a leading provider of high-speed internet, cable television, and telephone services across various regions in the United States. As a player in the telecommunications sector, WOW has established a foothold in the market by delivering reliable and high-quality services to residential and business customers alike.
The Double Bottom Formation
A double bottom pattern is a bullish technical chart pattern that typically forms after a downtrend and signals a potential reversal in the price trajectory. In the case of WOW stock, the emergence of a potential double bottom suggests that the downtrend may be losing steam, paving the way for a potential bullish breakout.
Knife Catch Opportunity
For investors seeking to capitalize on the potential reversal in WOW stock, the double bottom formation presents a knife catch opportunity. A knife catch refers to the act of buying a stock at or near its perceived bottom, with the anticipation of a turnaround in price. By identifying the potential double bottom formation and strategically entering the market, investors may position themselves for significant gains if the breakout occurs.
Breakout Test at $5
The next critical test for WOW stock lies at the $5 price level. A successful breakout above $5 would validate the double bottom pattern and signal a bullish continuation, potentially triggering a substantial run-up in price. This breakout level serves as a key psychological and technical barrier, attracting buying interest and fueling momentum in the stock.
Potential Return and Risk Management
In the event that WOW stock breaks above $5, investors may consider riding the momentum for potential gains. However, should $5 act as resistance, investors may opt to secure profits and reload at lower levels, anticipating a potential retracement of up to 30% before initiating new positions. Effective risk management strategies are essential to navigate the volatility associated with such trading opportunities.
Conclusion: Opportunity Amidst Uncertainty
In conclusion, WOW stock presents an intriguing opportunity for investors as it forms a potential double bottom pattern amidst market uncertainty. With the next breakout test set at $5, investors have the opportunity to capitalize on a potential sharp knife catch and position themselves for significant gains in the event of a successful breakout. However, prudent risk management is crucial to mitigate potential losses and navigate the inherent volatility of such trading opportunities.

UPDATE: MTN on the way to the R60.65 level :(Diamond Formation formed on MTN.
This is a broadening pattern that could have broke either way. The fact that it broke down and almost retested the 200MA showed the momentum was down and bearish.
Now it's on a one way trip down. First to R90.00 at next support
If it breaks below we could very well see our main target at R60.65
FUNDAMENTALS
MTN Group, a big telecom company in Africa, is facing a serious lawsuit in the US.
They are accused of doing business with a group linked to terrorism, which could have helped fund terrorist activities.
This is a big deal because it's the first time a company might be held responsible in the US for helping a terrorist group. Because of these legal issues, investors might be worried about MTN's future.
This concern can lead to a drop in MTN's stock price, as investors might sell their shares fearing potential financial losses or damage to the company's reputation.

MTN Black Diamond to take the price to R60.65?Diamond Formation formed over ther last two years with MTN.
Now initially, you wait for a breakout before you trade a broadening pattern like the diamond.
And then, we saw it break below - showing the momentum and supply was higher to the downside.
I sent this analysis out and called it a short investment. What that means is that this type of trade is a LONG hold and it will take time to hit the target. Luckily with CFDs you'll earn interest on the trade.
And as price is staying below the 200MA, the target is still on to R60.65
Thoughts?

Poor vodacom - Target hit at R92.00 but very unexpectedlyUm... Ok I did not expect that.
Look Vodacom has been going through a very tough down channel since April 2022. The high was around R160.00.
The downtrend then subsided but started moving in a very eloquent channel with highs and lows.
Well we expected the channel to hit the high and drop down to R92.00. But not in one candle suddenly.
I don't even know if there was enough liquidity to get most people out, but here we are.
So the channel will continue until it breaks. And Range Bounded traders will be thrilled to continue profiting going long and short.
Are you?

Breakout and retest at VodafoneOn the 4 hr chart:
Breakout on 3rd November and retest on the 9th November, backed up by some above average buys on 7th and 8th November too. In the next few days, will it pull higher? Wait and see.

AT&T: Dark Cloud Cover at Resistance ZoneAT&T has formed a Dark Cloud Cover after being rejected from the upperbound of the Resistance Zone and is now trading below the 200SMA and 800EMA with Hidden Bearish Divergence forming on the MACD. If it plays out, I think we could see AT&T make its way down towards $13.20

Vodacom bear channel thrives to R90.00This ongoing bear channel has been going since March 2022...
It's not been the haven for breakout traders. But an absolute beauty for trend traders and range bounded traders...
As long as the price continues in the range we could see the price head to R90 till March 2024...
Also the main indicator is the 200MA. If the price remains below it's bearish -Simple.
Target R90.00

UPDATE: MTN heading to test the mighty 200MA before downsideThe Broadening Diamond formation has finally broken below. The price came down but on weak selling volume.
Now it seems to head up to test the 200MA before deciding which main direction it wants to go.
THe overall prior trend was down and the breakdown was also confirming for the bears.
WIll have to wait for a conservative approach for the price to test the 200MA before taking any action.

UPDATE: MTN still crashing do the R60 mark due to a DiamondWe posted this Diamond Formation earlier in the year.
The price broke below the formation, and since then it's been on a way way trip.
Price<200 which signals a confirmed bear market.
Target remains down to R60.65.

Which way will MTN break out of the Diamond?Diamond Formation has formed since September 2022.
This is a weekly chart because MTN is by far the most difficult market to analyse.
It is famous for moving sideways for extended periods of time. Then it eventually breaks out and moves in a trend for a short but powerful period.
This is only a market for trend traders who wait for the big move.
Or for range bounded traders who buy and sell within the range.
My ego is not high enough to choose a direction, so when it breaks out - we can choose to go long or short.
7=21
Price>200
Target up R203.90
Target down R60.65

APPLE Next stop 200 after a pull-backLast time we bought APPLE (AAPL) on the short-term was on June 05 (see chart below), after a technical pull-back, and easily hit our 190 target:
The stock has maintained the Channel Up since late March with the 1D MA50 (blue trend-line) in Support since January 25. Based on the 1D RSI, which has been within a Rectangle pattern while the stock is on the Channel Up, we are about to see a technical pull-back towards the Higher Lows (bottom) trend-line and then rebound for a Higher High. That is a short-term opportunity for buyers to target $200.
-------------------------------------------------------------------------------
** Please LIKE 👍, FOLLOW ✅, SHARE 🙌 and COMMENT ✍ if you enjoy this idea! Also share your ideas and charts in the comments section below! **
-------------------------------------------------------------------------------
💸💸💸💸💸💸
👇 👇 👇 👇 👇 👇
