Our opinion on the current state of VODACOM(VOD)Vodacom (VOD) is South Africa's largest airtime and data provider for cell phones. It is a subsidiary of the international company Vodafone. Its competitors are MTN, Cell-C, and Telkom. The cell phone industry has been hammered by a steady decline in voice revenue which has to some extent been compe
Next report date
—
Report period
—
EPS estimate
—
Revenue estimate
—
8ZAR
16.29 BZAR
149.22 BZAR
551.93 M
About VODACOM GROUP LTD
Sector
Industry
CEO
Mohamed Shameel Aziz-Joosub
Website
Headquarters
Midrand
Employees (FY)
8.13 K
Founded
1993
ISIN
ZAE000132577
FIGI
BBG000BD5GF1
Vodacom Group Ltd. engages in the provision of communications products and services. It operates through the South Africa and International segments. The South Africa segment includes the segment information relating to the South African-based cellular network, service provider and other business segments. The International segment provides the segment information relating to the non-South African-based cellular networks in Tanzania, Mozambique, Lesotho and the Democratic Republic of Congo as well as the operations of Vodacom International Limited and Vodacom Business Africa. The company was founded in 1993 and is headquartered in Midrand, South Africa.

$JSEVOD - Vodacom: Potential Double Bottom ReversalSee link below for previous analysis.
Vodacom selling momentum looks to have tapered as the MACD has given a strong bullish convergence pattern.
I am also on the lookout for a potential double bottom pattern between the 9070 to 8544 zone.
It is still too early to call a reversal but i will monitor

Our opinion on the current state of VODACOM(VOD)Vodacom, as South Africa's largest provider of airtime and data for cell phones, plays a crucial role in the telecom sector. It operates as a subsidiary of the international conglomerate Vodafone, facing competition from MTN, Cell-C, and Telkom. The industry has seen a significant shift with a decli
VODACOM GROUP (VOD)They are down nearly 40% since its peak in March 2022. This pullback mirrors similar trends observed in other South African Inc stocks. Currently, the share price has retreated to the lower trend line that has been established since 2022, finding support at R86.50. This pullback may potentially posi

VOD: counter-testing the bearish trendA price action above 9100 supports a bullish trend direction.
Further bullish confirmation for a break above 9400.
The target price is set at 9800.
The stop-loss price is set at 8800.
The price action is counter-testing the lower range of the declining channel pattern.
Remains a risky trade.

$JSEVOD - Vodacom: 9070cps Target Reached, Now What?See link below for previous analysis.
Vodacom continued its sell-off and has reached the price target of 9070, the March 2020 low.
There is no evidence yet of any reversal so i will sit on my hands.
I will monitor price action at this level for a potential double bottom reversal.

VOD LONG OF 90Vodacom has being holding 90 for a while now Long 0f 90 is a good play we can see target of 108

VODACOM - Long Idea RTMThe stock has had a major pullback since hovering near the downtrend 200d moving average and hitting a recent swing high of R110 .
Im looking for a relief bounce here towards R100. A daily close below R90 negates the idea.
Note: This is a reversion to the mean trade (countertrend).
Mean Rever

Our opinion on the current state of VODVodacom (VOD) stands as South Africa's largest provider of airtime and data services for cell phones, operating as a subsidiary of the international telecommunications company Vodafone. Competing with MTN, Cell-C, and Telkom, Vodacom operates in an industry that has faced significant challenges, inc

Vodacom Nearing Yearly Low PriceVodacom is now on the low end of a yearly cycle with price near the COVID low, this is the longest yearly decline for Vodacom. We will use the weekly chart to gauge the right entry point, we look for the following parameters:
1. A swing low (confirmed)
2. A close above the 10 week moving average (c

See all ideas
An aggregate view of professional's ratings.
Frequently Asked Questions
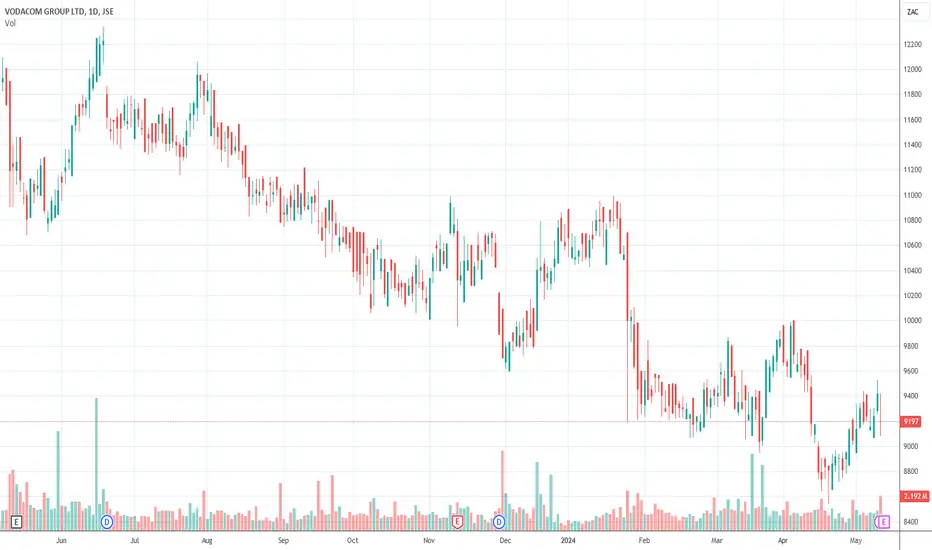
The current price of VOD is 9,868 ZAC — it has increased by 0.30% in the past 24 hours. Watch VODACOM GROUP LTD stock price performance more closely on the chart.
Depending on the exchange, the stock ticker may vary. For instance, on JSE exchange VODACOM GROUP LTD stocks are traded under the ticker VOD.
VOD stock has risen by 7.26% compared to the previous week, the month change is a 3.22% rise, over the last year VODACOM GROUP LTD has showed a 15.66% decrease.
We've gathered analysts' opinions on VODACOM GROUP LTD future price: according to them, VOD price has a max estimate of 13,000.00 ZAC and a min estimate of 9,900.00 ZAC. Watch VOD chart and read a more detailed VODACOM GROUP LTD stock forecast: see what analysts think of VODACOM GROUP LTD and suggest that you do with its stocks.
VOD stock is 2.06% volatile and has beta coefficient of 0.32. Track VODACOM GROUP LTD stock price on the chart and check out the list of the most volatile stocks — is VODACOM GROUP LTD there?
Today VODACOM GROUP LTD has the market capitalization of 190.24 B, it has increased by 1.54% over the last week.
Yes, you can track VODACOM GROUP LTD financials in yearly and quarterly reports right on TradingView.
VODACOM GROUP LTD is going to release the next earnings report on Nov 11, 2024. Keep track of upcoming events with our Earnings Calendar.
VOD net income for the last half-year is 7.91 B ZAR, while the previous report showed 8.38 B ZAR of net income which accounts for −5.70% change. Track more VODACOM GROUP LTD financial stats to get the full picture.
VODACOM GROUP LTD dividend yield was 5.99% in 2023, and payout ratio reached 70.03%. The year before the numbers were 5.49% and 70.68% correspondingly. See high-dividend stocks and find more opportunities for your portfolio.
As of Jul 27, 2024, the company has 8.13 K employees. See our rating of the largest employees — is VODACOM GROUP LTD on this list?
EBITDA measures a company's operating performance, its growth signifies an improvement in the efficiency of a company. VODACOM GROUP LTD EBITDA is 54.44 B ZAR, and current EBITDA margin is 35.41%. See more stats in VODACOM GROUP LTD financial statements.
Like other stocks, VOD shares are traded on stock exchanges, e.g. Nasdaq, Nyse, Euronext, and the easiest way to buy them is through an online stock broker. To do this, you need to open an account and follow a broker's procedures, then start trading. You can trade VODACOM GROUP LTD stock right from TradingView charts — choose your broker and connect to your account.
Investing in stocks requires a comprehensive research: you should carefully study all the available data, e.g. company's financials, related news, and its technical analysis. So VODACOM GROUP LTD technincal analysis shows the buy rating today, and its 1 week rating is buy. Since market conditions are prone to changes, it's worth looking a bit further into the future — according to the 1 month rating VODACOM GROUP LTD stock shows the sell signal. See more of VODACOM GROUP LTD technicals for a more comprehensive analysis.
If you're still not sure, try looking for inspiration in our curated watchlists.
If you're still not sure, try looking for inspiration in our curated watchlists.