TradeCityPro | TON Range Tightens, Breakout Probability Rising👋 Welcome to TradeCity Pro!
In this analysis, I want to review the TON coin for you. One of the popular crypto projects that belongs to the Telegram platform, and with a market cap of $4 billion, it is ranked 26th on CoinMarketCap.
⏳ 4-hour timeframe
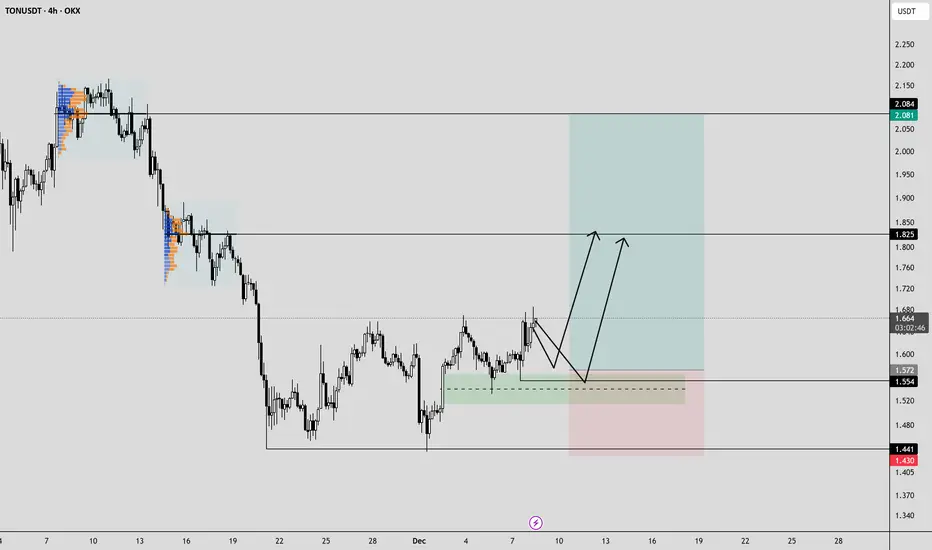
This coin has formed a range box on the 4-hour timeframe, and like most altcoins, it is currently ranging.
⚡️ The bottom of the range box is at 1.45 and the top of the box is at 1.68, and for several days now, volume inside this box has been increasing.
📊 This increase in volume indicates the presence of traders in this coin, and if volume continues to increase, the probability of a range breakout will rise.
✔️ Currently, most of the volume is buy volume, and the probability of breaking the 1.681 resistance has increased.
⭐ The higher low that the price has formed is at 1.562, and as long as the price stays above this level, we can expect that if 1.681 breaks, an upward bullish move will start.
🎲 However, if the price gets rejected from 1.681 and moves downward, breaking 1.562, then with the break of 1.45, we can open a short position.
📝 Final Thoughts
Stay calm, trade wisely, and let's capture the market's best opportunities!
This analysis reflects our opinions and is not financial advice.
Share your thoughts in the comments, and don’t forget to share this analysis with your friends! ❤️
Telegram

TON GOOD FUTURE ONE DAYHi traders!
Seems to be that TON is building huge RUNNING FLAT
When it will be completed IMO we gonna see new cycle development
Stay tuned

TON - Long idea.The TON looks pretty long. The structure is good. I expect another test near the local low. Ideally, we should break through the low and rise!
I've sketched out a rough plan and set up alerts. I'll be watching!
QuickScalp on #GBPUSD 📌 Market Insight: {#GBPUSD }
⚠️ Risk Assessment: {High}
🚀 Approach:
Last setup of the week. need valid momentum structure first .... Just for QuickScalp .
i'll be wait for it , for like next 3 hours .
#Ash_TheTrader #Forex #GBPJPY #MarketAnalysis #TradingSetup #RiskManagement #GOLD #Scalper #NQ #EURUSD

an Add on position on EU ? 📌 Market Insight: {#EURUSD }
⚠️ Risk Assessment: {High}
🚀 Approach:
Maybe we could have a chance to add another position to EU . but no rush . as its friday i rather to be safe than do a risky trade
#Ash_TheTrader #Forex #GBPJPY #MarketAnalysis #TradingSetup #RiskManagement #GOLD #Scalper #NQ #EURUSD

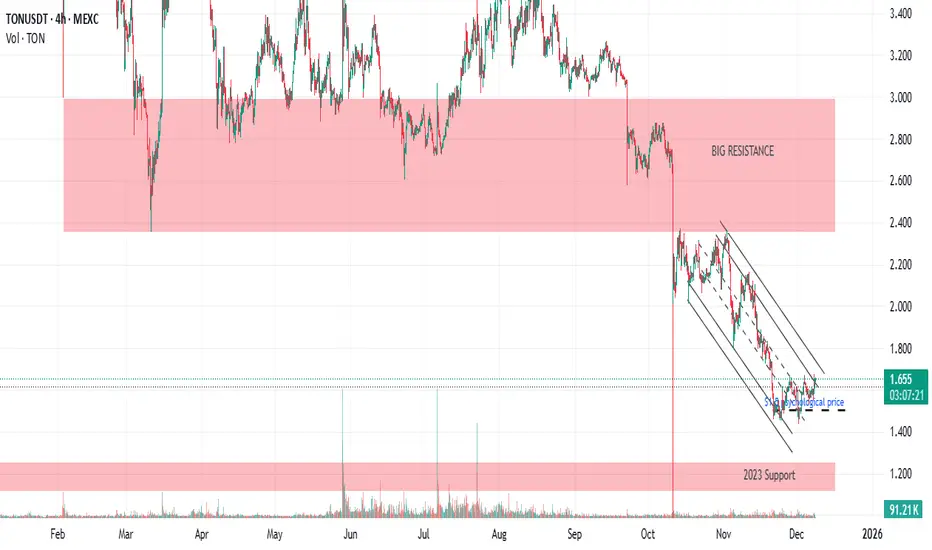
TONCOIN heads towards major resistance at $3After the decline that occurred on 10/10, MEXC:TONUSDT closed the wick candle with a very neat trendline.
Will it break the trendline and try to rise to $3 resistance?
$1.5 would be the psychological price
Telegram Bonds - A Pre-IPO OpportunityBond Structure
Telegram has two outstanding bond issues. The first , maturing on March 22, 2026, trades at around 100% of par with a 7% coupon. The second, maturing on June 5, 2030, has a 9% coupon and trades at 104-105% of par, yielding approximately 7.7% to maturity. The total volume of the second issue is $1.7 billion, with $954.6 million from exchanging old bonds and $745.4 million in new cash raised. Such structure reduced overall debt while attracting fresh capital.
Importantly, these bonds include a conversion feature: in the event of an IPO before 2030, bondholders can convert into shares at a 20% discount to the IPO price, with full allocation (100% lock-up potential).
Messenger Market Landscape in 2024-2025
The messaging app sector is dominated by a few giants. WhatsApp leads with 3 billion monthly active users (MAU) and is part of Meta, valued at $1.545 trillion overall. WeChat, with 1.3-1.45 billion MAU, is embedded in Tencent, making standalone valuation challenging. Snapchat, the only publicly traded pure-play messenger, has 943 million MAU and 477 million daily active users (DAU), with a market cap of around $13.2 billion (as of December 2025), revenue of $5.36 billion, and EBITDA of $509 million, though net profit remains negative. Telegram ranks third globally, with 1 billion MAU, while analysts estimate 450 million DAU. Revenue is approximately ≈$1-1.4 billion (based on minimum estimates), with profits of around $540 million in 2024. It’s also worth mentioning smaller players such as Line and KakaoTalk.
Comparative Valuation
To estimate Telegram's capitalization, we draw on multiples derived from Snapchat as a benchmark, where the market cap per MAU stands at approximately $14 per user and per DAU at $28 per active user, while the ratios to revenue and EBITDA are 2.5x and 26.5x, respectively. Applying these metrics to Telegram's figures results in a valuation of $12-14 billion based on MAU and DAU, $2.5 billion when considering revenue, and approximately $14.3 billion using EBITDA. Overall, this points to a core valuation range of $12-14 billion, marking a notable downward adjustment from the earlier $50 billion estimate, largely influenced by Snapchat's own stock performance decline and broader market corrections.
Impact of the TON Ecosystem
The TON (The Open Network) ecosystem adds substantial potential value to Telegram, even though it operates as a formally separate entity. TON encompasses a native token with a current capitalization of around $3.8 billion at a price of approximately $1.5, along with an integrated wallet offering both custodial and non-custodial modes, and proof-of-stake staking mechanisms. Key revenue sources stem from wallet fees, dApp payments, staking yields, and indirect monetization avenues such as advertising. Valuation estimates for TON's contribution to Telegram vary widely depending on the scenario: in a conservative outlook, it generates $23 million in annual income, adding $329 million to the overall valuation; the base case assumes $455 million annually, contributing $6.5 billion; and an optimistic projection sees $2.275 billion in yearly income, boosting the value by $32.5 billion. Under the base scenario, TON could therefore elevate Telegram's total valuation by $6.5 billion, resulting in an adjusted estimate of $18.5-20.5 billion.
Overall Valuation Estimate
By combining the comparative metrics with the potential uplift from TON's contribution, Telegram's realistic capitalization emerges as $12-14 billion in a conservative view, potentially climbing to $18-20 billion in the base case or reaching up to $40 billion in an optimistic framework. Estimates from other analysts span from $15 billion to $40 billion, which aligns closely with this range, and the variations primarily arise from differing assumptions regarding monetization strategies, growth trajectories, and associated risks.
Investment Scenarios
Investing in Telegram bonds presents multiple potential outcomes for investors. One straightforward path is to hold the bonds for their dollar-denominated yield of 6.5-7%, supported by a profitable issuer that has consistently made timely payments over the years. Additionally, as U.S. dollar interest rates decline, the bonds themselves may appreciate in price, thereby improving overall returns. The most compelling scenario, however, involves an IPO, where bondholders have the option to convert their holdings at a 20% discount to the IPO price, benefiting from full allocation and the potential for substantial upside. For instance, a $100,000 bond investment would equate to $100,000 worth of shares priced at the IPO level minus the 20% discount. Although no specific IPO plans have been announced, making the timing uncertain, market conditions around 2027 could create favorable opportunities for such listings amid increased liquidity.
Risks and Considerations
Several risks warrant careful consideration when evaluating this opportunity, starting with regulatory hurdles that have already led to Telegram being blocked in regions such as China or Vietnam, which could constrain its growth prospects. In contrast to competitors like WhatsApp or WeChat, Telegram does not have deep-rooted connections to major markets, amplifying this vulnerability. Financial opacity poses another notable issue, as the revenue and profit numbers reported by founder Pavel Durov remain unaudited and self-declared, prompting skepticism among analysts. The company's lean structure, with only 30-50 in-house employees supplemented by outsourcers, highlights operational efficiency but could limit its ability to pursue robust development in various areas. Ownership complexities further complicate matters, given Telegram's registrations in offshore locations like the British Virgin Islands and Dubai, where structures are deliberately opaque to shield the team from legal risks but inadvertently introduce uncertainty for investors. TON's inherent volatility is also a factor, as the token has experienced price drops in line with broader crypto market slumps, and while its symbiosis with Telegram offers benefits, full integration and sustained value are not assured. Lastly, broader market and execution risks mean that any IPO valuation might deviate from current projections, and potential lock-up periods on converted shares could apply, with specifics outlined in the bond prospectus.

a HighRisk QuickScalp on #USDJPY📌 Market Insight: {#USDJPY }
⚠️ Risk Assessment: {High}
🚀 Approach:
Not a Quality setup right now ... and need a valid LTF entry . without it , should skip this setup ... NO RUSH
#Ash_TheTrader #Forex #GBPJPY #MarketAnalysis #TradingSetup #RiskManagement #GOLD #Scalper #NQ #EURUSD

FireHoseReel | TON’s Last Support of Defense🔥 Welcome to FireHoseReel !
Let’s dive into the analysis of Telegram Coin (TON).
👀 TONUSDT 4H Overview
TON has reached a very critical support zone. A clean break below this level could activate our next short trigger and lead to a deeper drop than many expect.
📊 Volume Analysis
Selling pressure during the formation of this support has been significant. With heavy market FOMO, many traders have already exited their TON positions. If this downside momentum continues, TON could enter a deeper corrective phase.
🔁 TONBTC Prespective
Meanwhile, the TON/BTC pair is also in a bearish structure, indicating that TON’s relative strength against Bitcoin is weakening.
📌 Trading Scenario
At the moment, TON presents one primary scenario, focused on the short side, which you can use alongside your own trading setup.
🔴 Short Scenario
A breakdown below the current support at $1.465, confirmed by a strong increase in sell volume, could trigger a sharp decline in TON.
❤️ Risk Management & Emotional Discipline
Crypto trading is highly risky. Without proper risk management and emotional control, trading is no different from gambling.
Logic must always come before emotions. Learn to manage your trades—and enjoy the process of trading with control and discipline.

FireHoseReel | NOT: 64% Down — Capitulation or Massive Reversal?🔥 Welcome to FireHoseReel !
Let’s explore the latest Notcoin price structure.
🪐 NOTCOIN – Market Structure & Key Levels Update
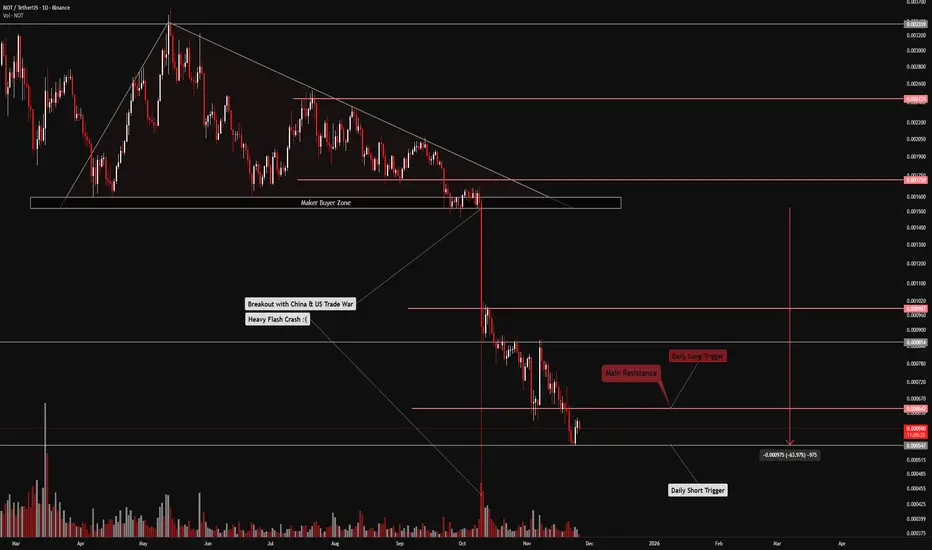
Notcoin has suffered a 64% crash following the flash crash triggered by the US–China trade war, marking one of the most severe declines in its history. Since its launch via a Telegram airdrop, Notcoin has consistently shown fragile price behavior, with repeated sharp corrections. Persistent selling pressure has made each pullback deeper, and the recent price action has even added an extra zero — clearly reflecting the gravity of this drawdown.
✨ Market Structure & Liquidity Outlook
At this stage, Notcoin’s structure has become extremely sensitive. Any additional downside could easily trigger a new corrective wave.
On the bullish side, if capital rotation returns to the TON ecosystem, Notcoin may experience a liquidity-driven upside squeeze. However, this scenario is heavily dependent on TON network performance and Telegram execution.
• Key Price Levels
• Daily resistance: 642
• Major support: 547
A daily close above 642 could activate a high-risk long trigger, best approached through futures trading for better flexibility.
On the other hand, a break below 547 may unleash aggressive selling pressure across Notcoin.
📊 Volume Analysis – The Decisive Factor
Volume remains the most critical metric at this stage.
After the flash crash, overall volume declined, but during multi-timeframe corrections, selling pressure clearly resurfaced, as confirmed by recent volume candles.
So far, strong buy-side volume has been rare, while sell pressure has stayed persistent and dominant.
✅ Trading Scenarios :
🔼 Long Scenario
• Confirmed break above 642
• Accompanied by a strong surge in volume
• This could trigger an upside expansion and support holding airdropped NOT or opening futures long positions.
🔽 Short Scenario
• Breakdown below 547
• Followed by a clear increase in sell pressure
• This would signal distribution risk, possibly forcing whale exits. Losing this support could justify reducing exposure and re-entering at lower levels to control risk.
🛞 Risk Management & Disclaimer
Please remember to always use proper risk management and position sizing. Nothing in this analysis is financial advice. The market can change quickly, so always trade based on your own strategy, research, and risk tolerance. You are fully responsible for your own trades.
GBPUSD FRGNT Daily Forecast -Q4 | W48| D25 | Y25 |📅 Q4 | W48| D25 | Y25 |
📊 GBPUSD FRGNT Daily Forecast
🔍 Analysis Approach:
I’m applying Smart Money Concepts, focusing on:
Identifying Points of Interest on the Higher Time Frames (HTFs) 🕰️
Using those POIs to define a clear trading range 📐
Refining those zones on Lower Time Frames (LTFs) 🔎
Waiting for a Break of Structure (BoS) for confirmation ✅
This method allows me to stay precise, disciplined, and aligned with the market narrative, rather than chasing price.
💡 My Motto:
"Capital management, discipline, and consistency in your trading edge."
A positive risk-to-reward ratio, paired with a high win rate, is the backbone of any solid trading plan 📈🔐
⚠️ Losses?
They’re part of the mathematical game of trading 🎲
They don’t define you — they’re necessary, they happen, and we move forward 📊➡️
🙏 I appreciate you taking the time to review my Daily Forecast.
Stay sharp, stay consistent, and protect your capital
— FRNGT 🚀
FX:GBPUSD

HighRisk QuickScalp #GBPJPY📌 Market Insight: {#GBPJPY }
⚠️ Risk Assessment: {High}
🚀 Approach:
Super Risky Setup .... at Edge of Structure
Just for QuickScalp
No Rush
Need valid momentum Structure and LTF entry Sign
#Ash_TheTrader #Forex #GBPJPY #MarketAnalysis #TradingSetup #RiskManagement #GOLD #Scalper #NQ #EURUSD

a BuySide QuickScalp #USDCAD📌 Market Insight: {#USDCAD }
⚠️ Risk Assessment: {High}
🚀 Approach:
Not a Quality one ... need to have a Momentum Structure first .... Don't rush .
#Ash_TheTrader #Forex #GBPJPY #MarketAnalysis #TradingSetup #RiskManagement #GOLD #Scalper #NQ #EURUSD

FRGNT FUN COUPON FRIDAY -Q4 | W45 | D7| Y25 | EURGBP📅 Q4 | W45 | D7| Y25 |
📊 EURGBP FRGNT Daily Forecast
FRGNT FUN COUPON FRIDAY
🔍 Analysis Approach:
I’m applying Smart Money Concepts, focusing on:
Identifying Points of Interest on the Higher Time Frames (HTFs) 🕰️
Using those POIs to define a clear trading range 📐
Refining those zones on Lower Time Frames (LTFs) 🔎
Waiting for a Break of Structure (BoS) for confirmation ✅
This method allows me to stay precise, disciplined, and aligned with the market narrative, rather than chasing price.
💡 My Motto:
"Capital management, discipline, and consistency in your trading edge."
A positive risk-to-reward ratio, paired with a high win rate, is the backbone of any solid trading plan 📈🔐
⚠️ Losses?
They’re part of the mathematical game of trading 🎲
They don’t define you — they’re necessary, they happen, and we move forward 📊➡️
🙏 I appreciate you taking the time to review my Daily Forecast.
Stay sharp, stay consistent, and protect your capital
— FRNGT 🚀
FX:EURGBP

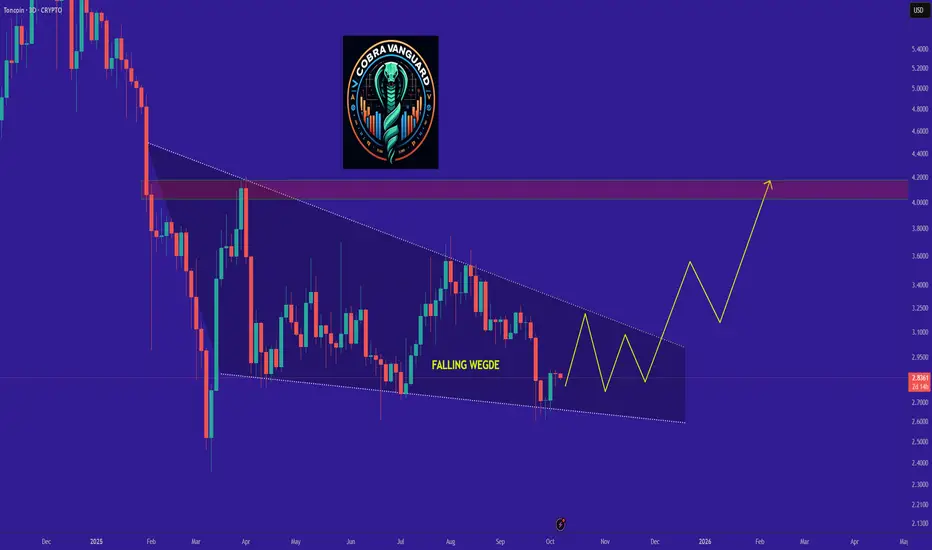
TON It will grow soon...The triangle pattern will break in the direction it is breached, and the price will move in that direction. In my opinion, the price could be Bullish and may up to $3.6.
NOTUSDTI waiting for breakout of trendline for buy. So is 0.001650 key-levels and 0.001800$ next level for breakout and buy.
Please control risk management because BINANCE:NOTUSDT
IN is meme_coin in crypto.

TradeCityPro | TON: Testing Resistance for Bullish Momentum👋 Welcome to TradeCity Pro!
In this analysis I want to review the TON coin for you. This project is one of the most popular crypto projects developed for the Telegram platform, and its coin is ranked 23 on CoinMarketCap with a market cap of $7.05 billion.
⏳ 4-Hour Timeframe
In the 4-hour timeframe, after a downward move, TON formed a bottom at 2.658. After this level was faked once, it was supported and the upward movement began.
✔️ The first trigger for bullish confirmation was at 2.752, which got activated, and after the breakout, the price moved up to 2.843.
📊 The 2.843 level is the last high that previously caused the price to print a lower low. These types of highs usually attract reactions in the future, and their breakout can lead to a trend reversal.
🔔 Currently, 2.843 is exactly that level, and so far the price has touched it twice. Considering the fake breakdown of the 2.658 support, good bullish momentum has entered the market, and in future attempts the price could break this level.
💥 The RSI oscillator has also been rejected from the 70 level and is now correcting. If 70 is broken and RSI enters Overbuy, the main bullish move can begin.
✨ The next levels above the price are 3.058 and 3.246. Although they are still far from the current price, in my view 3.246 is the main trigger for a larger bullish move in TON. If the price moves above this level, the trend in higher timeframes will turn bullish.
📝 Final Thoughts
Stay calm, trade wisely, and let's capture the market's best opportunities!
This analysis reflects our opinions and is not financial advice.
Share your thoughts in the comments, and don’t forget to share this analysis with your friends! ❤️

AUDUSD Daily Forecast - Q4 | W40 | D2 | Y25|📅 Q4 | W40 | D2 | Y25|
📊 AUDUSD Daily Forecast
🔍 Analysis Approach:
I’m applying Smart Money Concepts, focusing on:
Identifying Points of Interest on the Higher Time Frames (HTFs) 🕰️
Using those POIs to define a clear trading range 📐
Refining those zones on Lower Time Frames (LTFs) 🔎
Waiting for a Break of Structure (BoS) for confirmation ✅
This method allows me to stay precise, disciplined, and aligned with the market narrative, rather than chasing price.
💡 My Motto:
"Capital management, discipline, and consistency in your trading edge."
A positive risk-to-reward ratio, paired with a high win rate, is the backbone of any solid trading plan 📈🔐
⚠️ Losses?
They’re part of the mathematical game of trading 🎲
They don’t define you — they’re necessary, they happen, and we move forward 📊➡️
🙏 I appreciate you taking the time to review my Daily Forecast.
Stay sharp, stay consistent, and protect your capital
— FRNGT 🚀
FX:AUDUSD

TON 1D Analysis – Key Triggers Ahead💀 Hey , how's it going ? Come over here — Satoshi got something for you !
⏰ We’re analyzing TON on the 1-Day timeframe timeframe .
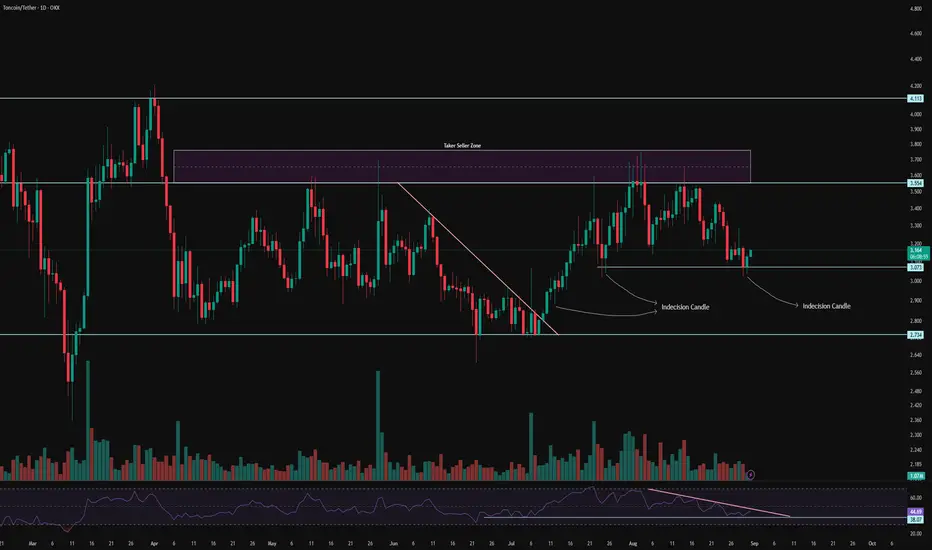
👀 On the daily timeframe of Toncoin, we can see that Toncoin has very high credibility in the crypto space, and recently even Snoop Dogg and Toncoin did an NFT drop together which was amazing. Toncoin is in a range with a box structure, with the top of this box at the $3.553 area and the bottom of this box at the $2.734 area. The price of Toncoin has been fluctuating inside this price box for about 150 days so far.
⚙️ This time, since we are analyzing the beloved coin of hearts, we try to use all the technicals we know. Our key RSI level is at 38, and a descending trendline has been drawn on this oscillator as well, which shows compression and reduced volatility. This means that Toncoin can soon break out of this compressed volatility. With increased volatility in the upcoming week, Toncoin could move upward.
🕯 Looking at Toncoin’s volume in the daily timeframe, we can see that after breaking its trendline, Toncoin broke out of its compression and showed a significant increase in volume for the bullish trend. The size and volume of green candles are larger compared to the red ones, and 50% of Toncoin holders are still keeping their coins and haven’t sold. The one-day indecision candles for Toncoin have been respected by buyers and each time have pushed the price upward.
💎💰 On the daily timeframe of TONBTC, we can see that after breaking its descending trendline, Toncoin experienced an upward trend and moved 25% higher, then it was rejected from the seller ticker area and moved toward the midline of its box. From this area, it has been supported by two indecision candles, but a compressed range structure has formed. With a breakout from this compression, Toncoin can experience other price levels.
🔔 To determine the alert zones for Toncoin, we look at the 4-hour multi-timeframe. On the 4-hour timeframe of Toncoin, we can see that a short-term resistance has formed at the $3.177 price level. With a breakout of this area, Toncoin can experience a short-term price recovery. This area seems to be a good level to observe price behavior.
❤️ Disclaimer : This analysis is purely based on my personal opinion and I only trade if the stated triggers are activated .
TONX: The Rising Star Backed by Telegram’s Global GrowthToncoin listed on NASDAQ under the ticker TONX _ stands out as one of the most promising assets for long‑term investment.
Its strategic partnership with Telegram, one of the fastest‑growing social platforms in the world, creates a significant competitive edge. The continuous rise in active Telegram users directly supports the growth of the Toncoin ecosystem, as the project’s in‑app payments and financial services gradually gain widespread adoption.
In addition, the expansion of TON’s blockchain infrastructure, collaborations with online businesses, and the ongoing support from the Telegram team are expected to steadily increase demand for the TONX token in the coming years.
Based on a personal estimate, the true growth potential of this asset will likely become evident by mid‑2028, at which time, assuming the development trend continues and adoption remains strong, its average price could reach around $90.
This projection is built on an analysis of user adoption trends, transaction volumes, and the expansion of blockchain‑related markets, and is naturally subject to overall economic conditions and cryptocurrency market dynamics.

USD/JPY - Weak Support suggests breakoutHi all traders. Ive done a few breakdowns of this market now all following similar fundamentals.
Here is my conclusion:
Market is currently ranging. We are approaching a Strong 8H Supply zone facing close to a much tested Support.
Im looking for a strong rejection off this Supply into this support with enough pressure to make Bearish movements through this zone. Monthly Imbalance suggests Buyers are sitting lower so I will be aiming beyond this support.
Good luck to all and I follow me for more updates.

EURGBP Daily Forecast -Q3 | W37 | D11| Y25📅 Q3 | W37 | D11| Y25
📊 EURGBP Daily Forecast
🔍 Analysis Approach:
I’m applying Smart Money Concepts, focusing on:
Identifying Points of Interest on the Higher Time Frames (HTFs) 🕰️
Using those POIs to define a clear trading range 📐
Refining those zones on Lower Time Frames (LTFs) 🔎
Waiting for a Break of Structure (BoS) for confirmation ✅
This method allows me to stay precise, disciplined, and aligned with the market narrative, rather than chasing price.
💡 My Motto:
"Capital management, discipline, and consistency in your trading edge."
A positive risk-to-reward ratio, paired with a high win rate, is the backbone of any solid trading plan 📈🔐
⚠️ Losses?
They’re part of the mathematical game of trading 🎲
They don’t define you — they’re necessary, they happen, and we move forward 📊➡️
🙏 I appreciate you taking the time to review my Daily Forecast.
Stay sharp, stay consistent, and protect your capital
— FRNGT 🚀
FX:EURGBP

USD/JPY - Top Down Analysis 🟣 Monthly Chart (Macro Structure)
Context: Price has been ranging within a broad band between 162 resistance and 138–140 support.
Current Zone: Sitting mid-range near 147–148, right under a heavy monthly supply block (150–152).
Bias: Until 150+ breaks clean, upside is capped. Structure suggests more downside liquidity hunts.
🔵 Weekly Chart (Swing Bias)
Supply Zone: Weekly supply at 150–152 rejected strongly.
Trendline: Rising liquidity channel (higher lows), but capped at supply.
Order Flow: Repeated rejections indicate sellers still control the higher timeframe.
Bias: Bearish toward the liquidity resting around 145.
Key Levels:
Resistance: 150–152
Support: 144–145
🟢 Daily Chart (Refined Structure)
Supply Reaction: Strong rejection from the 61.8% retrace within the weekly supply zone.
SSL (Sell-Side Liquidity): Resting neatly at 145 handle, aligning with trendline support.
Bias: Lower-high structure under supply → daily order flow favors continuation down.
⏱ 1H Chart (Execution Layer)
Supply Zone: 147.7–147.9 (confluent with 71% fib retrace & weak resistance).
Reaction: Intraday rejection already showing weakness.
Next Path: Break of weak support at 147.0 would confirm continuation toward 146.8 → 145.5.
Intraday Bias: Sell rallies back into 147.7–147.9.
