EURGBP Daily Forecast Q3 | W37 | D8 | Y25📊 EURGBP Daily Forecast Q3 | W37 | D8 | Y25
🔍 Analysis Approach:
I’m applying Smart Money Concepts, focusing on:
Identifying Points of Interest on the Higher Time Frames (HTFs) 🕰️
Using those POIs to define a clear trading range 📐
Refining those zones on Lower Time Frames (LTFs) 🔎
Waiting for a Break of Structure (BoS) for confirmation ✅
This method allows me to stay precise, disciplined, and aligned with the market narrative, rather than chasing price.
💡 My Motto:
"Capital management, discipline, and consistency in your trading edge."
A positive risk-to-reward ratio, paired with a high win rate, is the backbone of any solid trading plan 📈🔐
⚠️ Losses?
They’re part of the mathematical game of trading 🎲
They don’t define you — they’re necessary, they happen, and we move forward 📊➡️
🙏 I appreciate you taking the time to review my Daily Forecast.
Stay sharp, stay consistent, and protect your capital
— FRNGT 🚀
FX:EURGBP
Telegram

EURCHF Daily Forecast -Q3 | W37 | Y25📅 Q3 | W37 | Y25
📊 EURCHF Daily Forecast
🔍 Analysis Approach:
I’m applying Smart Money Concepts, focusing on:
Identifying Points of Interest on the Higher Time Frames (HTFs) 🕰️
Using those POIs to define a clear trading range 📐
Refining those zones on Lower Time Frames (LTFs) 🔎
Waiting for a Break of Structure (BoS) for confirmation ✅
This method allows me to stay precise, disciplined, and aligned with the market narrative, rather than chasing price.
💡 My Motto:
"Capital management, discipline, and consistency in your trading edge."
A positive risk-to-reward ratio, paired with a high win rate, is the backbone of any solid trading plan 📈🔐
⚠️ Losses?
They’re part of the mathematical game of trading 🎲
They don’t define you — they’re necessary, they happen, and we move forward 📊➡️
🙏 I appreciate you taking the time to review my Daily Forecast.
Stay sharp, stay consistent, and protect your capital
— FRNGT 🚀
OANDA:EURCHF

AUDUSD Daily Forecast -Q3 | W36 | D4 | Y25📅 Q3 | W36 | D4 | Y25
📊 AUDUSD Daily Forecast
🔍 Analysis Approach:
I’m applying Smart Money Concepts, focusing on:
Identifying Points of Interest on the Higher Time Frames (HTFs) 🕰️
Using those POIs to define a clear trading range 📐
Refining those zones on Lower Time Frames (LTFs) 🔎
Waiting for a Break of Structure (BoS) for confirmation ✅
This method allows me to stay precise, disciplined, and aligned with the market narrative, rather than chasing price.
💡 My Motto:
"Capital management, discipline, and consistency in your trading edge."
A positive risk-to-reward ratio, paired with a high win rate, is the backbone of any solid trading plan 📈🔐
⚠️ Losses?
They’re part of the mathematical game of trading 🎲
They don’t define you — they’re necessary, they happen, and we move forward 📊➡️
🙏 I appreciate you taking the time to review my Daily Forecast.
Stay sharp, stay consistent, and protect your capital
— FRNGT 🚀
FX:AUDUSD

AUDUSD Daily Forecast -Q3 | W36 | D3 | Y25 NY FORECAST 📅 Q3 | W36 | D3 | Y25
📊 AUDUSD Daily Forecast
🔍 Analysis Approach:
I’m applying Smart Money Concepts, focusing on:
Identifying Points of Interest on the Higher Time Frames (HTFs) 🕰️
Using those POIs to define a clear trading range 📐
Refining those zones on Lower Time Frames (LTFs) 🔎
Waiting for a Break of Structure (BoS) for confirmation ✅
This method allows me to stay precise, disciplined, and aligned with the market narrative, rather than chasing price.
💡 My Motto:
"Capital management, discipline, and consistency in your trading edge."
A positive risk-to-reward ratio, paired with a high win rate, is the backbone of any solid trading plan 📈🔐
⚠️ Losses?
They’re part of the mathematical game of trading 🎲
They don’t define you — they’re necessary, they happen, and we move forward 📊➡️
🙏 I appreciate you taking the time to review my Daily Forecast.
Stay sharp, stay consistent, and protect your capital
— FRNGT 🚀
FX:AUDUSD

TradeCityPro | TON Testing Wedge Breakout Amid Key Support🙏 Welcome to TradeCity Pro!
In this analysis I want to review the TON coin for you. One of the popular crypto coins that with a market cap of 8.09 billion dollars is ranked 22 on CoinMarketCap.
⏳ 4-Hour Timeframe
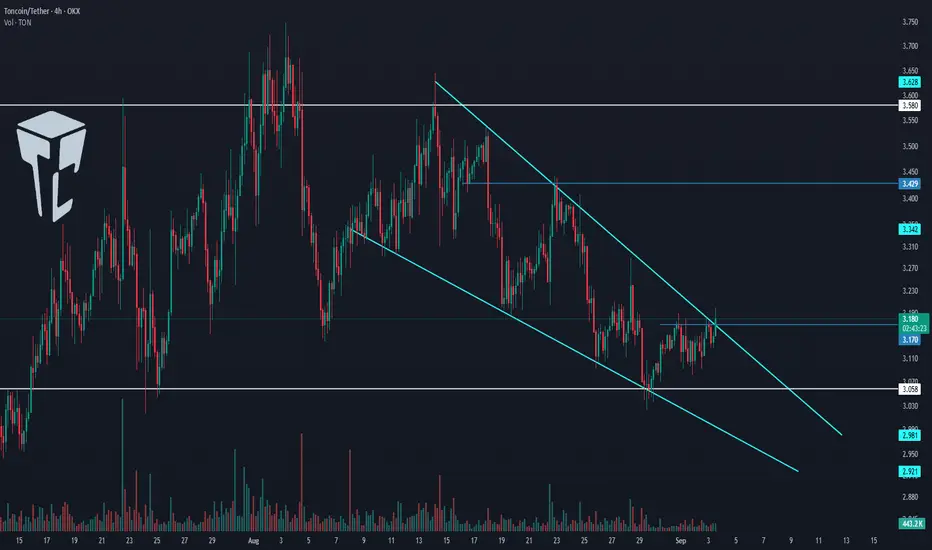
In the 4-hour timeframe this coin has formed a descending wedge and has reached the support of 3.058.
📊 Currently the price has reached the top of the wedge and if 3.170 is broken its upward movement can begin.
🧩 Considering that the price has reached the end of this wedge the reduction in volume is logical and with the breakout of the wedge whether from above or below a lot of volume will enter the market.
📈 If the wedge is broken from above and the 3.17 trigger is activated I will try to open a long position. Breaking this level can start a new upward leg in higher cycles.
🔔 In case of rejection from the top of the wedge and moving towards the 3.058 support if this level breaks the price can start a downward leg and even break the wedge from below.
📝 Final Thoughts
Stay calm, trade wisely, and let's capture the market's best opportunities!
This analysis reflects our opinions and is not financial advice.
Share your thoughts in the comments, and don’t forget to share this analysis with your friends! ❤️
TONUSDT 1H🔎 **Chart Context**
* Pair: **TON/USDT**
* Timeframe: **1H (Intraday)**
* Current price: **3.161**
* The market has been **range-bound** between **3.08 – 3.20**, with failed breakout attempts toward **3.286**.
* The chart projection suggests potential **downside continuation** after repeated rejections at resistance.
---
### 📊 **Key Observations**
1. **Market Structure**
* Recent swing high: **3.286**, sharp rejection.
* Lower highs forming: **3.208 → 3.204 → 3.188**, indicating **bearish pressure**.
* Supports tested multiple times at **3.093 – 3.111**, weakening with each touch.
2. **Support Zones**
* **3.093 – 3.111**: Current intraday support, repeatedly tested.
* **3.021 – 3.035**: Secondary support, next liquidity pool.
* **2.880 – 2.920**: Larger demand block (highlighted gray zone), key downside target if breakdown occurs.
3. **Resistance Zones**
* **3.180 – 3.200**: Immediate resistance, strong supply zone.
* **3.240 – 3.286**: High resistance cluster, capped prior rallies.
4. **Moving Averages**
* Price is trading **below intraday EMAs**, confirming **bearish bias**.
* The EMAs are acting as dynamic resistance across **3.18 – 3.20 zone**.
---
### 📈 **Bullish Scenario (Less Likely / Relief Rally)**
* TON defends **3.093 support** once more.
* Relief rally path:
* **TP1:** 3.180
* **TP2:** 3.200 (intraday supply)
* Only a sustained close above **3.200–3.240** would open the way for **3.286 retest**.
---
### 📉 **Bearish Scenario (Higher Probability)**
* Repeated failures at **3.188–3.200 resistance** combined with EMA pressure suggest further downside.
* Breakdown path:
* Break below **3.093** → sweep **3.021 – 3.035**
* Continuation target: **2.880 – 2.920 demand zone**
* This aligns with the projected chart path showing a dip toward the **2.9 region**.
---
### ⚡ **Trading Plan**
* **Short Setup (Preferred):**
* Entry: Rejection from 3.180 – 3.200 supply zone.
* TP1: 3.093
* TP2: 3.021 – 3.035
* TP3: 2.880 – 2.920
* Stop: Above 3.240
* **Long Setup (Countertrend):**
* Entry: Bounce confirmation at 3.093 – 3.021 zone.
* TP: 3.180 – 3.200
* Stop: Below 3.000

NOT 1D Analysis – Key Triggers Ahead💀 Hey , how's it going ? Come over here — Satoshi got something for you !
⏰ We’re analyzing NOTCOIN on the 1-DAY timeframe timeframe .
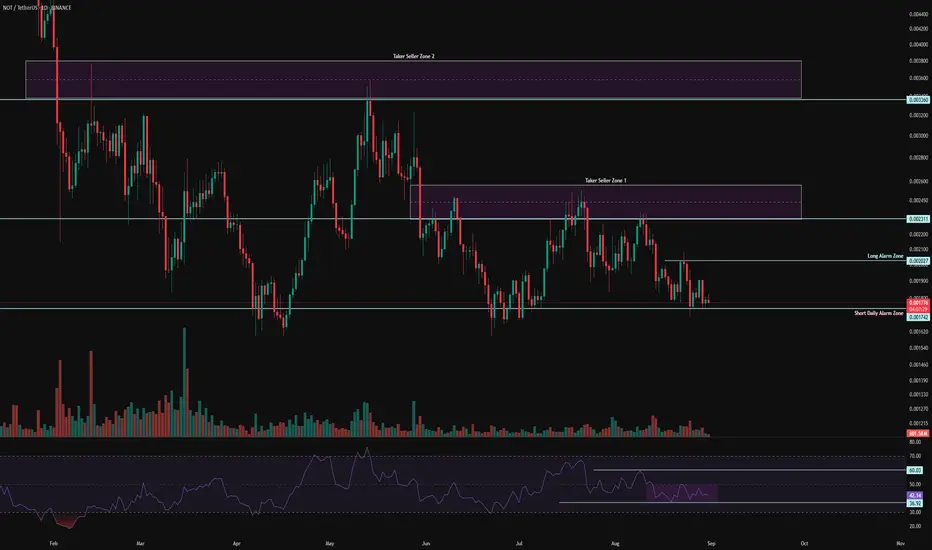
👀 On the daily timeframe of Notcoin, we can see that Notcoin is one of Telegram’s well-known airdrops, and many Telegram users got familiar with Notcoin through it. On the daily chart, after its recent drop, the volume has decreased sharply, and we can consider the possibility of reduced selling pressure at this bottom since the price has taken on a compressed and accumulation phase. Regarding the zones, a quick note: because Notcoin was distributed as an airdrop, many of its users are considered as seller tickers.
⚙️ The key RSI zones for Notcoin are at 60 and 36. If the oscillator crosses these levels, Notcoin can experience a solid move. A box-like compression has formed inside the RSI, and breaking out of this compression could bring about a parabolic swing.
🕯 The volume of Notcoin, along with its reduced volatility, has decreased sharply and reached an accumulation stage. Once this accumulation phase ends, Notcoin can experience a good move. Note that the size and volume of red candles are increasing, so price action behavior can provide the best decision-making opportunity for taking trades.
🔔 The alert zone considered is the 0.002 area, which is set as the long trade alert zone. (A short clarification: price behavior in this zone doesn’t necessarily only mean a long position—it could also be a reversal. We trade based on probabilities.)
❤️ Disclaimer : This analysis is purely based on my personal opinion and I only trade if the stated triggers are activated .
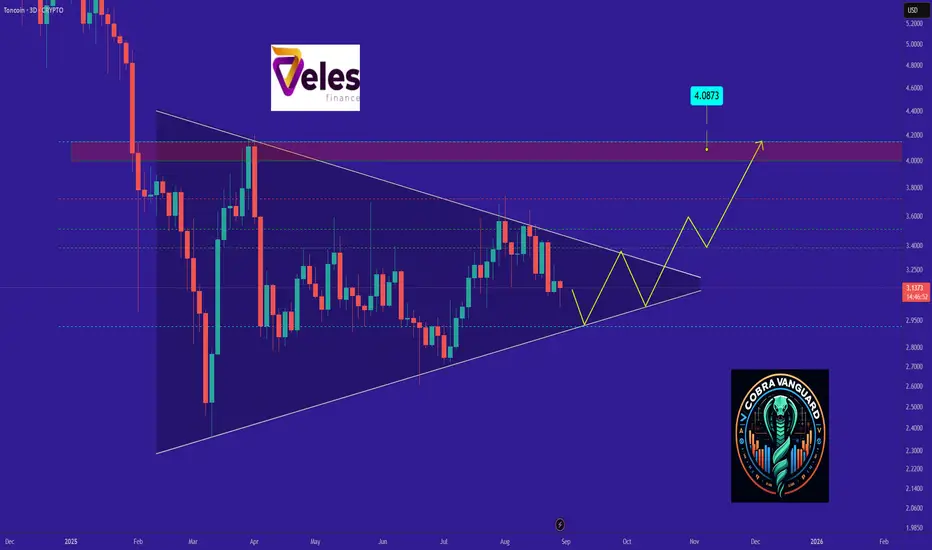
we shall see a good amount of increase in TON price !The triangle pattern will break in the direction it is breached, and the price will move in that direction. In my opinion, the price could be Bullish and may up to $4.
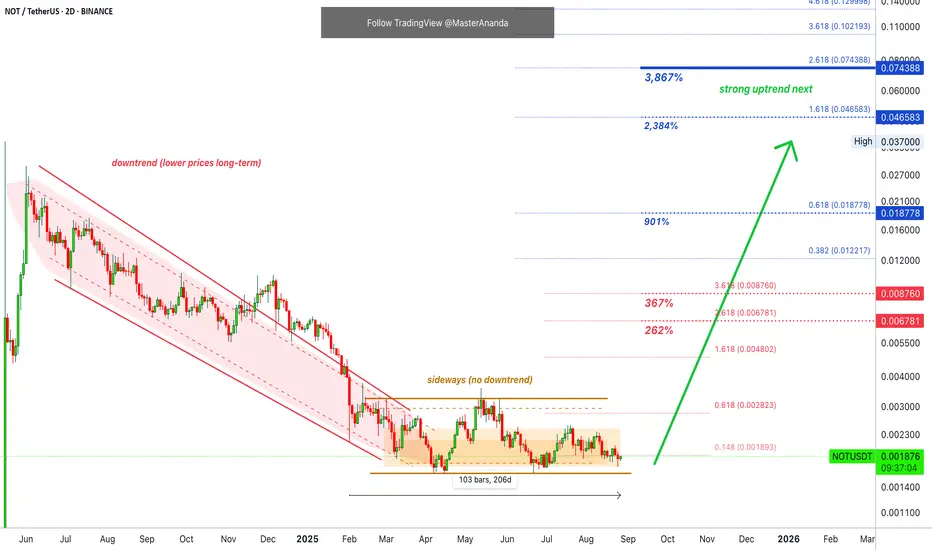
Notcoin · Futures Trading Trade-NumbersNotcoin is doing great right now, truly, trading at bottom prices/the opportunity buy zone. It has now been 205 days with NOTUSDT moving sideways.
The current price range has been active only twice, ever in the life of this project, and briefly. Between late June and early July, and also in April. That's it.
The third time Notcoin trades within the opportunity buy zone is now, late August 2025. August tends to be a bottom month.
We had a bottom for Crypto in August 2024. Many altcoins ended up producing a bottom in August 2023 and there were bottoms also in August 2022. There is something about this month.
Something ends in August/September, something starts in March. The fiscal year? The seasons? Yes! All of it. Each and every aspect plays its role.
Forget about that, Notcoin is the name of the game.
I've been telling you about this project for a long-time now. Do you still believe what I say? Do you believe NOTUSDT will produce massive growth? It will, mark my words.
Just at bottom prices it's been seven months. If you are new, I understand if you feel like the market is not going anywhere. But this is normal, it takes time between each bullish wave.
If you are experienced, old, you know we are looking at the best possible entry prices ever, with timing being awesome.
Another friendly reminder. It doesn't get any better. You can buy LONG or you can go spot.
________
LONG NOTUSDT
ENTRY: 0.001700 - 0.001890 (STOP: 0.001690)
TARGETS: 0.002067, 0.002356, 0.002823, 0.003579, 0.004802, 0.005555, 0.006781
________
Very low risk is 3-5X. This chart setup can take up to 10X and sometimes even more. More than 5X, experts only. But the opportunity is right in your face.
It is going to happen. We are getting very close...
The consolidation period is almost over.
Watch the market grow next.
Namaste.
USDJPY – DAILY FORECAST Q3 | W34 | D20 | Y25📊 USDJPY – DAILY FORECAST
Q3 | W34 | D20 | Y25
Daily Forecast 🔍📅
Here’s a short diagnosis of the current chart setup 🧠📈
Higher time frame order blocks have been identified — these are our patient points of interest 🎯🧭.
It’s crucial to wait for a confirmed break of structure 🧱✅ before forming a directional bias.
This keeps us disciplined and aligned with what price action is truly telling us.
📈 Risk Management Protocols
🔑 Core principles:
Max 1% risk per trade
Only execute at pre-identified levels
Use alerts, not emotion
Stick to your RR plan — minimum 1:2
🧠 You’re not paid for how many trades you take, you’re paid for how well you manage risk.
🧠 Weekly FRGNT Insight
"Trade what the market gives, not what your ego wants."
Stay mechanical. Stay focused. Let the probabilities work.
FX:USDJPY

AUDJPY – DAILY FORECAST Q3 | W34 | D18 | Y25📊 AUDJPY – DAILY FORECAST
Q3 | W34 | D18 | Y25
Daily Forecast 🔍📅
Here’s a short diagnosis of the current chart setup 🧠📈
Higher time frame order blocks have been identified — these are our patient points of interest 🎯🧭.
It’s crucial to wait for a confirmed break of structure 🧱✅ before forming a directional bias.
This keeps us disciplined and aligned with what price action is truly telling us.
📈 Risk Management Protocols
🔑 Core principles:
Max 1% risk per trade
Only execute at pre-identified levels
Use alerts, not emotion
Stick to your RR plan — minimum 1:2
🧠 You’re not paid for how many trades you take, you’re paid for how well you manage risk.
🧠 Weekly FRGNT Insight
"Trade what the market gives, not what your ego wants."
Stay mechanical. Stay focused. Let the probabilities work.
FX:AUDJPY

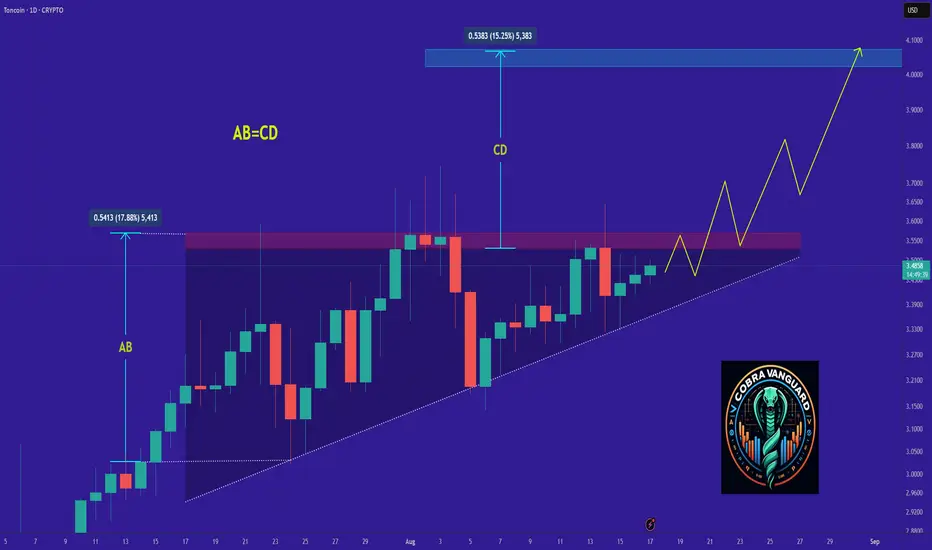
TON's Situation, A Comprehensive Analysis !!!The price on the Daily timeframe is within an ascending triangle, which can be promising. If the price breaks this pattern with bullish candles, it could easily rise by the distance of AB=CD .
Best regards CobraVanguard.💚
Toncoin · Updated Targets · $11.95, $17.88 & $23.82 (PP: 600%)The consolidation period can continue with varied price swings, it is a mistake to think that bullish action must develop the following day. Yes, it has been going for more than six months but there tends to be a period of 8-10 months between each bullish wave. Minor or major. There is always a pause in between cycles.
We are looking at Toncoin on the weekly timeframe. Notice how the action is happening below EMA55. This is a bearish signal. TONUSDT is consolidating and we know it will grow but the long-term bullish bias is not yet confirmed. We know it will grow based on past experience, marketwide action and dozens of reversal signals.
Toncoin will grow, a massive bullish cycle. I updated the targets as promised and these are still conservative but stronger than the previous set.
These numbers work long-term and for the life of the project as long as the action is happening below. So these are always good.
Toncoin as TONUSDT is aiming first at $4.62 followed by $6. The dynamics around these levels can be similar to what we saw with XRPUSDT.
The last high, $8.28, can break easily once bullish momentum is strong. There can always be a retrace and some consolidation followed by additional growth. Late 2025 and we start to hit our targets.
You will see Toncoin easily trading at $11.95. Additional targets with a high probability to hit in the coming months are $17.88 and $23.82. Total profits potential goes beyond 600% to the final target.
Thank you for reading.
Namaste.

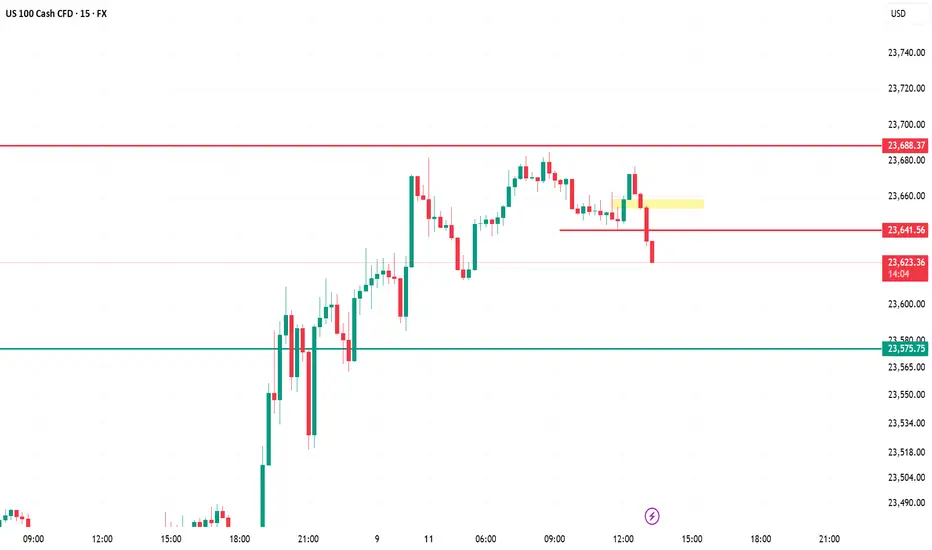
US100 (5m) – AnalysisKey Breakdown – Price has broken below the 23,641 support (red line) after failing to hold the yellow retest zone, signaling short-term bearish momentum.
Immediate Resistance – 23,641 is now flipped into resistance; any pullback toward it could attract sellers.
Downside Target – Next major support sits at 23,575; if broken, deeper liquidity may be targeted below 23,550.
Market Structure – Shifted from intraday uptrend to lower highs & lower lows; momentum favors short trades until structure flips.
Trading Approach – Look for short entries on retests of 23,641 with stop above yellow zone, target 23,575, then trail for possible extended drop.
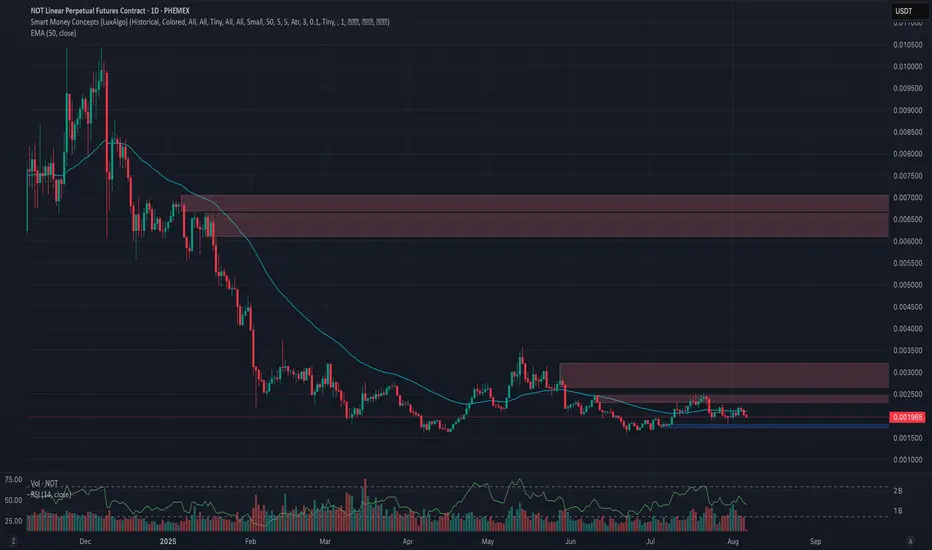
Phemex Analysis #102: Is Notcoin Ready for a BULL RUN?!Notcoin (NOT) is a popular Telegram-based tap-to-earn game token launched on the TON blockchain. Designed as a gateway to Web3, it attracted over 35 million players, supported by a community of 2.86 million wallet holders and nearly 8 million wallet interactions—making it one of the largest social-game currencies in crypto.
Recently, Notcoin’s price has been building on the daily (1D) timeframe, showing signs of structural accumulation across multiple days. This long-fashioned base suggests potential for a continuation rally, especially if buyer demand reasserts itself.
Currently, NOT trades near $0.00198, giving it a market capitalization around $200 million, and about a 9% gain over the past 30 days. Volume is also picking up, confirming growing retail interest and speculation.
Given this backdrop, let’s explore the near-term scenarios shaping NOT’s next move.
Possible Scenarios
1. Bullish Breakout—Momentum Ignites
If NOT continues its daily-range accumulation and rises above $0.0023–$0.0025 with increased volume, this could trigger a breakout phase. Momentum traders may target levels around $0.0032 or higher—driven by renewed speculation and broader bullish sentiment.
Pro Tips:
Enter positions once price clears $0.0025 with strong volume.
Consider taking short-term profits at $0.0032, $0.0036; long-term profit at $0.0065 or $0.007.
2. Neutral Range & 1D Base Confirmation
If price remains contained between $0.0017 and $0.0023, continued sideways movement may reflect institutional accumulation or range farming. This base-building phase—formed in the daily timeframe—often precedes a breakout when volume starts to pick up.
Pro Tips:
Use grid trading to ride small swings between support and resistance.
Watch for volume spikes around the $0.0023 resistance; this can signal breakout readiness.
Avoid overtrading; accumulate slowly only after price shows sustained stabilization.
3. Breakdown Relative Weakness
Should NOT fail to hold the bottom trendline near $0.0017, or break with high volume down toward $0.0015 or below, bearish pressure could intensify. This could indicate a sell-off or loss of interest over time.
Pro Tips:
If support at $0.0017 fails decisively, consider reducing positions or staying sidelined.
Long-term holders may wait for a retest near lower supports ($0.0015 or below) before gradually re-entering.
Conclusion
Notcoin (NOT) sits at a key crossroads—built on robust Web3 community metrics, strong daily timeframe structure, and rising interest. Whether you trade the potential breakout, capitalize on range-bound opportunities, or adopt a long-term DCA strategy, ensuring tight risk management and clear entry/exit levels is essential. Watch the critical $0.0017–$0.0023 zone carefully: its direction could define NOT’s next big move.
🔥 Tips:
Armed Your Trading Arsenal with advanced tools like multiple watchlists, basket orders, and real-time strategy adjustments at Phemex. Our USDT-based scaled orders give you precise control over your risk, while iceberg orders provide stealthy execution.
Disclaimer: This is NOT financial or investment advice. Please conduct your own research (DYOR). Phemex is not responsible, directly or indirectly, for any damage or loss incurred or claimed to be caused by or in association with the use of or reliance on any content, goods, or services mentioned in this article.
EURUSD – DAILY FORECAST Q3 | W32 | D5 | Y25📊 EURUSD – DAILY FORECAST
Q3 | W32 | D5 | Y25
Daily Forecast 🔍📅
Here’s a short diagnosis of the current chart setup 🧠📈
Higher time frame order blocks have been identified — these are our patient points of interest 🎯🧭.
It’s crucial to wait for a confirmed break of structure 🧱✅ before forming a directional bias.
This keeps us disciplined and aligned with what price action is truly telling us.
📈 Risk Management Protocols
🔑 Core principles:
Max 1% risk per trade
Only execute at pre-identified levels
Use alerts, not emotion
Stick to your RR plan — minimum 1:2
🧠 You’re not paid for how many trades you take, you’re paid for how well you manage risk.
🧠 Weekly FRGNT Insight
"Trade what the market gives, not what your ego wants."
Stay mechanical. Stay focused. Let the probabilities work.
FX:EURUSD
CHART UPDATE !!!!!

TON is bearish now and many Traders don't see it !The fact that most cryptocurrencies are bearish while Toncoin hasn't seen a significant drop yet is somewhat suspicious, and sooner or later, the price is likely to fall. I expect the price to be bearish by the start of the new week.

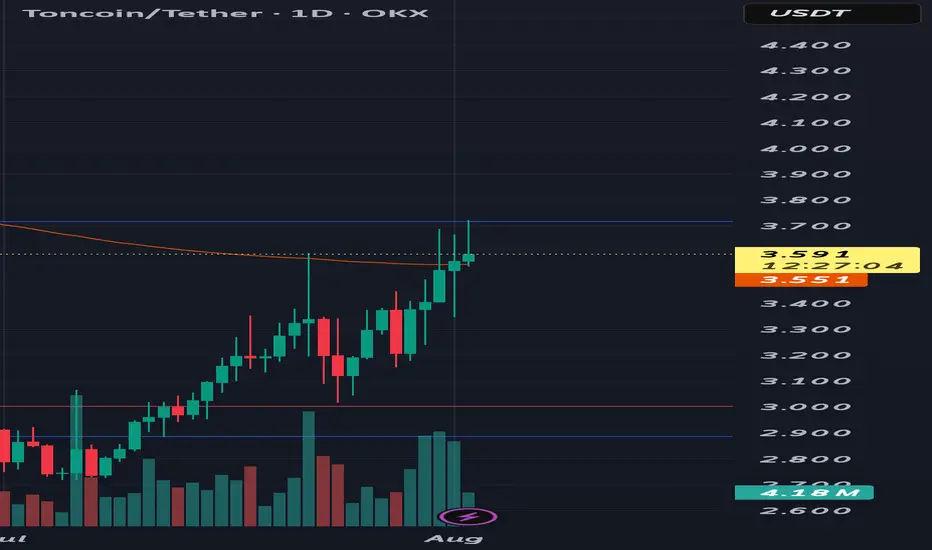
Up only desuTon has crashed a lot from its all time high and it seems to be rebounding now. Today will be the fifth daily green candles in a row and yesterday's daily closed above EMA 200
IN ADDITION TO THIS
Some bullish news for Ton i found from elfabot
The recent surge in CRYPTOCAP:TON price is primarily attributed to strong ecosystem activity, including significant NFT purchases by Pavel Durov (Telegram’s founder), such as buying a Plush Pepe NFT for 15,000 TON (about $53,000), which has boosted market confidence and demonstrated TON’s real-world utility. This has been widely discussed in the crypto community and cited as a bullish catalyst (source).
⦁ Additional bullish factors include Grayscale considering investment in TON, the launch of new Telegram NFT features, and US users being able to access TON Wallet directly inside Telegram without a VPN (source).
So, yea, i think we're breaking previous ATH and hitting $10 soon
cheers
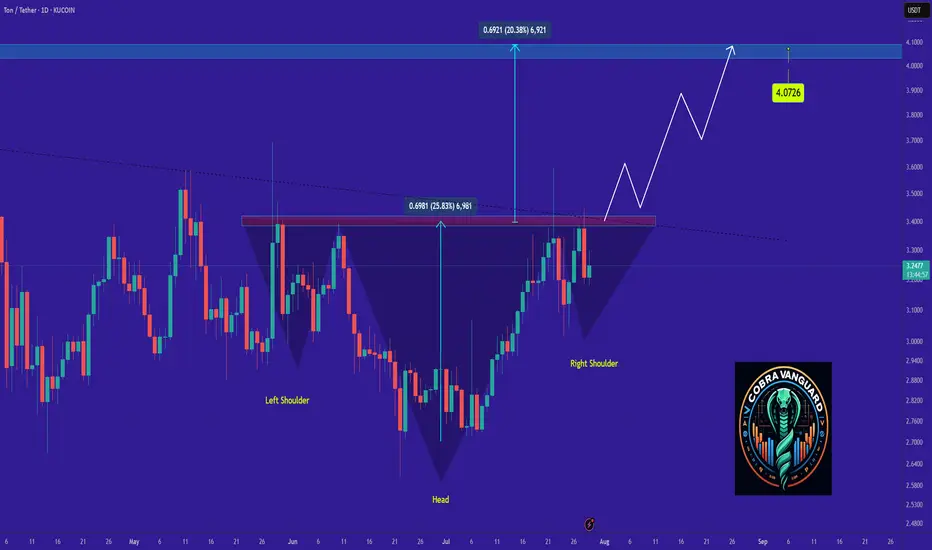
we shall see a good amount of increase in TON price !It seems the price is forming a head and shoulders pattern, which, if correct, suggests a good price increase in the coming days. However, we should wait for the pattern to fully complete.
Best regards CobraVanguard.💚
EURJPY – DAILY FORECAST Q3 | W31 | D29 | Y25📊 EURJPY – DAILY FORECAST
Q3 | W31 | D29 | Y25
Daily Forecast 🔍📅
Here’s a short diagnosis of the current chart setup 🧠📈
Higher time frame order blocks have been identified — these are our patient points of interest 🎯🧭.
It’s crucial to wait for a confirmed break of structure 🧱✅ before forming a directional bias.
This keeps us disciplined and aligned with what price action is truly telling us.
📈 Risk Management Protocols
🔑 Core principles:
Max 1% risk per trade
Only execute at pre-identified levels
Use alerts, not emotion
Stick to your RR plan — minimum 1:2
🧠 You’re not paid for how many trades you take, you’re paid for how well you manage risk.
🧠 Weekly FRGNT Insight
"Trade what the market gives, not what your ego wants."
Stay mechanical. Stay focused. Let the probabilities work.
OANDA:EURJPY

GBPUSD – DAILY FORECAST Q3 | W31 | D28 | Y25📊 GBPUSD – DAILY FORECAST
Q3 | W31 | D28 | Y25
Daily Forecast 🔍📅
Here’s a short diagnosis of the current chart setup 🧠📈
Higher time frame order blocks have been identified — these are our patient points of interest 🎯🧭.
It’s crucial to wait for a confirmed break of structure 🧱✅ before forming a directional bias.
This keeps us disciplined and aligned with what price action is truly telling us.
📈 Risk Management Protocols
🔑 Core principles:
Max 1% risk per trade
Only execute at pre-identified levels
Use alerts, not emotion
Stick to your RR plan — minimum 1:2
🧠 You’re not paid for how many trades you take, you’re paid for how well you manage risk.
🧠 Weekly FRGNT Insight
"Trade what the market gives, not what your ego wants."
Stay mechanical. Stay focused. Let the probabilities work.
FX:GBPUSD

AUDCAD – WEEKLY FORECAST Q3 | W31 | Y25📊 AUDCAD – WEEKLY FORECAST
Q3 | W30 | Y25
Weekly Forecast 🔍📅
Here’s a short diagnosis of the current chart setup 🧠📈
Higher time frame order blocks have been identified — these are our patient points of interest 🎯🧭.
It’s crucial to wait for a confirmed break of structure 🧱✅ before forming a directional bias.
This keeps us disciplined and aligned with what price action is truly telling us.
📈 Risk Management Protocols
🔑 Core principles:
Max 1% risk per trade
Only execute at pre-identified levels
Use alerts, not emotion
Stick to your RR plan — minimum 1:2
🧠 You’re not paid for how many trades you take, you’re paid for how well you manage risk.
🧠 Weekly FRGNT Insight
"Trade what the market gives, not what your ego wants."
Stay mechanical. Stay focused. Let the probabilities work.
FX:AUDCAD

TONUSD TONUSDT TONCOIN mid- to long-termIn my view, we are still in the accumulation phase. The current price action and reactions at key levels suggest ongoing accumulation.
🔻 Bearish Scenarios:
In the short term, a retest of the lower boundary of the accumulation zone (purple box) is possible if the market weakens.
The worst-case scenario would be a move down to the lower green support zone, which has historically triggered strong bullish reactions. This is a critical demand area.
🔼 Bullish Scenarios:
A confirmed breakout and hold above the white line (within the purple box) would signal strength and a potential move higher.
We would then likely see a retest of the upper boundary of the accumulation zone.
A breakout and consolidation above the yellow line would open the door for a move toward the wider yellow channel, which could act as a final target zone
🚨 High-Risk Zone:
The yellow channel might represent the final phase of the current move.
From there, we could see either a sharp correction
Or, if trend strength and macro conditions allow, a continuation towards a new ATH (purple line).
📌 📌 📌 :
All marked lines and zones represent key support and resistance levels.
Price reaction at these areas will be crucial for decision-making.
As always, risk management and trend confirmation are essential.
