TESLA FREE SIGNAL|SHORT|
✅TESLA
Bearish ICT breakout below supply confirms distribution. Failed reclaim of premium and displacement lower signals continuation toward sell-side liquidity and lower imbalance zone.
—————————
Entry: 426.17$
Stop Loss: 438.00$
Take Profit: 409.19$
Time Frame: 4H
—————————
SHORT🔥
✅Like and subscribe to never miss a new idea!✅
Tesla

Tesla - Electric Car Rolling LowerWe continue the downside move described in several previous posts.
We are drawing a corrective wave of the larger move.
Inside the corrective wave, four impulse sub-waves have already formed, and we are now forming the fifth sub-wave.
Key levels:
408
393
368
The most probable completion zone appears to be between 393-368 , which corresponds to roughly 50-60% of the primary move.
The downside potential from current levels is estimated at 2-12% .
---
Please subscribe and leave a comment!
You’ll get new information faster than anyone else.
---

$TSLA: Major Flush Incoming?Hello TradingView Community!
NASDAQ:TSLA on the logarithmic monthly chart is flashing some serious warning signs.
Price just rejected the upper trendline like it did in 2019 — classic exhaustion after the parabolic run.
We think this could be the start of something serious: a deep multi-month correction, shaking out weak hands, resetting momentum, and building better structure for the eventual next leg higher. Long-term bullish narrative remains intact, but right now it smells like a major flush incoming.
Your thoughts? Beginning of a big bear phase, or just healthy pullback?
#Tesla #TSLA #TradingView #LogChart

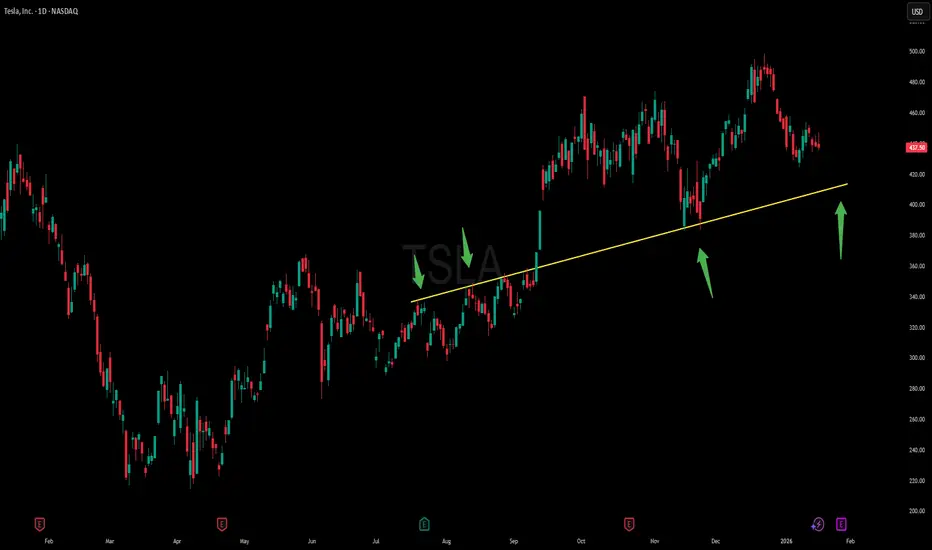
TESLA TRADE IDEA $TSLANASDAQ:TSLA Over the last 365 days, Tesla has consistently respected this trendline, providing several high-quality trading opportunities. Each time price has approached this level, we’ve seen strong reactions, making it a technically significant area to watch. From a chart perspective, this trendline has acted as reliable support, and the market has repeatedly confirmed its importance through both price action and volume response.
If you’re looking for a potential buying opportunity in Tesla, this area looks particularly interesting. The risk-to-reward setup appears favorable as long as the trendline continues to hold, and the broader structure still supports the prevailing trend. Of course, confirmation and proper risk management are key, but based on this chart alone, the setup looks compelling and worth close attention. What do you think about this trade idea?
Will Tesla Drop 30-40% ? - AnalysisTesla has recently reached new all-time highs, but there may be significant challenges ahead for the company. First, Tesla’s EV deliveries have recently declined, even though the global EV market is still growing. This is concerning because the company’s main revenue stream remains vehicle sales, and weaker demand directly affects earnings.
Despite this, some analysts remain bullish because they increasingly view Tesla as more than just an automaker, arguing that it is evolving into an AI and robotics company through initiatives such as Full Self-Driving, robotaxi projects, and the Optimus humanoid robot.
At the same time, Elon Musk’s compensation package and long-term targets have raised concerns. Analysts point out that several of Musk’s previous timelines, particularly for fully autonomous driving and new product launches, have been delayed or not met as originally promised. As a result, there is growing skepticism about Tesla’s ability to achieve Musk’s newest objectives, including large-scale commercial deployment of the Optimus robot.
Moreover, Tesla’s P/E ratio is extremely high (around 300), indicating that the current share price of roughly $440 reflects very optimistic future growth expectations. Unless revenues and profits increase rapidly in the coming years, this valuation appears difficult to justify.
Disclaimer:
This analysis is for informational and educational purposes only and does not constitute financial advice, investment recommendation, or an offer to buy or sell any securities. Asset prices, valuations, and performance metrics are subject to change and may be outdated. Always conduct your own due diligence and consult with a licensed financial advisor before making investment decisions. The information presented may contain inaccuracies and should not be solely relied upon for financial decisions. I am not a licensed financial advisor or professional trader. I am not personally liable for your own losses; this is not financial advice.

Tesla Inc. (TSLA) | Bullish Technical Outlook🚗⚡ TSLA Market Profit Playbook – Bullish Swing Strategy
Asset: Tesla, Inc. (TSLA) - NASDAQ Stock Exchange
Current Price: $445.01 (as of Jan 12, 2026)
52-Week Range: $214.25 - $498.83
📊 MARKET SNAPSHOT – REAL-TIME FEED
Live Price Action:
Current trading at $442.83 with intraday range $438.00 - $444.50
All-time high closing price was $489.88 on December 16, 2025
Average daily volume: 60.35M shares
Market cap: $1.48 trillion
Recent Performance:
Stock gained 19.18% over past 4 weeks as of Jan 6, 2026
Year-over-year performance: +13.27%
🎯 TRADING PLAN: BULLISH SETUP
📍 Entry Strategy: Layered Limit Orders (Thief Method)
This strategy uses multiple buy limit orders to scale into positions at favorable levels:
Layer 1: $430.00
Layer 2: $440.00
Layer 3: $450.00
Note: You can add additional layers based on your risk appetite and capital allocation strategy. This scaling approach reduces average entry cost and manages downside risk.
🎯 Take Profit Target:
Primary TP: $490.00 (near recent all-time high resistance zone)
Reasoning: Price approaching the $498.83 52-week high creates a strong resistance zone where profit-taking is expected. The $490 level acts as a police barricade (strong resistance + potential trap zone).
⚠️ Disclaimer: This is MY target level. You have the freedom to set your own profit targets based on your trading style and risk management. Take profits when YOU'RE comfortable – it's your capital, your decision.
🛑 Stop Loss:
Thief SL: $420.00
Risk Management: Positioned below recent support to prevent minor volatility from triggering exits
⚠️ Disclaimer: This is MY stop-loss level. You're encouraged to set your own stop-loss based on your risk tolerance and account size. Protect your capital at YOUR chosen level.
📈 TECHNICAL ANALYSIS
Chart Structure:
Price currently consolidating in mid-channel after pullback from $498.83 high
Stock lies in middle of wide, weak rising trend in short term with further rise signaled
Support from accumulated volume at $429.24 may hold as buying opportunity
Average True Range: 3.35% daily volatility (medium risk profile)
Key Levels:
Support: $429-430 (volume accumulation zone)
Resistance: $490-498 (police barricade resistance cluster)
🌍 FUNDAMENTAL & ECONOMIC FACTORS
Upcoming Catalysts:
Q4 2025 Earnings Release: Wednesday, January 28, 2026 (after market close)
Expected EPS: $0.45 per share
Q4 deliveries of 418,227 vehicles announced (down 15% YoY)
Delivery Performance:
Full year 2025 deliveries: 1.64M units (down 8.6% from 1.79M in 2024)
Energy storage deployments reached record 14.2 GWh in Q4
Industry Headwinds:
Global EV sales growth expected to slow to 12% in 2026 vs 23% in 2025
Federal EV tax credit expired September 2025, impacting affordability
BYD overtook Tesla as world's largest EV seller with 2.26M units sold in 2025
Technical Sentiment:
Analyst consensus: 20 buy, 10 sell ratings (Neutral overall)
Average 12-month price target: $403.32 (High: $600, Low: $120)
🔗 CORRELATED PAIRS TO WATCH
EV Sector Correlation:
NASDAQ:RIVN (Rivian Automotive) - Direct EV competitor
NASDAQ:LCID (Lucid Group) - Luxury EV segment
NYSE:NIO (NIO Inc.) - Chinese EV manufacturer
Tech/AI Correlation:
NASDAQ:NVDA (Nvidia) - AI chip supplier for Tesla's FSD technology
NASDAQ:MSFT (Microsoft) - Cloud/AI infrastructure plays
NASDAQ:META (Meta Platforms) - Nasdaq-100 stocks historically rise in January 70% of time with 2.5% average return
Key Relationship: Tesla's performance increasingly tied to its AI/autonomous driving narrative rather than pure automotive sales. Monitor semiconductor and tech sector momentum as leading indicators.
⚠️ RISK FACTORS
Earnings Volatility: Q4 earnings could create structural shift if margins compress or delivery guidance disappoints
Competition: Intense competition from Chinese manufacturers, particularly BYD's 28% growth rate
Political Risk: Musk's political activities have triggered consumer backlash in Europe and U.S.
Valuation Concerns: Director James Murdoch sold 60,000 shares at $445.40 on January 2, 2026
🎪 TRADING WISDOM: THE THIEF'S PLAYBOOK
This setup represents a swing trade opportunity in a consolidating market leader. The layered entry approach (Thief Strategy) provides:
✅ Cost averaging benefits
✅ Reduced timing risk
✅ Flexibility to scale position size
Remember: Markets reward patience and discipline. The goal isn't to catch the perfect bottom – it's to position yourself in the profit zone and manage risk effectively.
✨ "If you find value in my analysis, a 👍 and 🚀 boost is much appreciated — it helps me share more setups with the community!"

TESLA What Next? SELL!
My dear subscribers,
This is my opinion on the TESLA next move:
The instrument tests an important psychological level 444.98
Bias - Bearish
Technical Indicators: Supper Trend gives a precise Bearish signal, while Pivot Point HL predicts price changes and potential reversals in the market.
Target - 437.24
My Stop Loss - 449.86
About Used Indicators:
On the subsequent day, trading above the pivot point is thought to indicate ongoing bullish sentiment, while trading below the pivot point indicates bearish sentiment.
Disclosure: I am part of Trade Nation's Influencer program and receive a monthly fee for using their TradingView charts in my analysis.
———————————
WISH YOU ALL LUCK

TESLA: Short Signal Explained
TESLA
- Classic bearish formation
- Our team expects pullback
SUGGESTED TRADE:
Swing Trade
Short TESLA
Entry - 444.98
Sl - 449.19
Tp - 436.86
Our Risk - 1%
Start protection of your profits from lower levels
Disclosure: I am part of Trade Nation's Influencer program and receive a monthly fee for using their TradingView charts in my analysis.
❤️ Please, support our work with like & comment! ❤️

TSLA: Historical Gigantic Triangle Breakout, Next 200% in Sight!Hello There,
Welcome to my new analysis about the Tesla stock (TSLA). On the broader and global timeframe perspective, this stock is sending huge and historical signals that should not be underestimated. TSLA is continuously within this major uptrend from where it always had the ability to form new higher highs after the others. Now, TSLA is surging higher into the next spheres. Such price action is indicating massive events likely to follow through in 2026.
As when looking at my chart, we can see there that TSLA already broke out above the upper boundary of this gigantic triangle formation. Such a formation is, in a high number of cases, marking the starting point of a huge expansion towards the upside. Especially as TSLA already completed the wave count within the triangle formation, this is marking a huge confirmation of this gigantic formational structure.
As it is seen within my chart, TSLA is now building up above the upper boundary of this giant formation and is setting up the next bullish setup from where the next phases of the bull run are likely. There are also underlying factors supporting this trend, such as the 100-EMA and 50-EMA. As this uptrend is going on, TSLA has major supports here. From this level, the next bounces are highly likely. Currently the bullish setup is already building up, and a continuation should be expected.
Also, TSLA had the ability to expand their China business massively. Such a gigantic market is likely to boost sales, which in turn is bullish for the underlying stock. This dynamic is also attracting a lot of investors and whales to further move into this stock. It will be fascinating to see this dynamic expand in the upcoming times and how the actual market sets up further dynamics for the price action.
Technically, TSLA is already confirming the next major 200% move. As this whole formation has been completed, this is already the cornerstone of confirmation in this whole structure. Considering such a dynamic, there is a high likelihood that TSLA won't reverse or get stuck within the whole structure. It is important that TSLA stay above the upper boundary of the triangle. As long as this is the case, the next expansionist move is likely to happen soon.
With this being said, it is great to consider the important trades upcoming.
We will watch out for the main market evolutions.
Thank you very much for watching!

TSLA- Want to buy? Be aware of deeper correction, wait on 370/80Tesla has made a very nice recovery from the April 2025 lows and even reached new highs near the 500 area, but we are now seeing an interesting retracement at the start of 2026. This pullback can still be corrective, but it should be deeper then, as we are still missing the three subwaves within wave four, before the market can complete this correction.
A very interesting support zone for those looking to rejoin the trend comes in around the 380 -370 area. This zone aligns with the previous fourth wave area and the former swing high from May 2025. The Elliott Wave Oscillator also points room to more downside, as momentum could likely reach levels similar to those seen around the July and November 2025 as shown on the daily chart, withi hilighted arrows on the indicator.
Highlights
• Key support zone to watch is 380–370
• Current pullback likely part of wave four, still missing three subwaves
• Elliott Wave Oscillator suggests deeper pullback is due
• Broader bullish structure remains valid above the 275–277 invalidation zone

TESLA analysis, Chart is speaking itself !!!It can be said that the price has completed this pattern, and whenever the cup and handle is broken, we should expect a growth equal to AB=CD.

Tesla - Impulse ContinuesLet’s set aside the broader plan and focus on the current impulse.
How this move develops will be important for understanding the next steps ahead.
Let’s outline new levels where pauses and reversals may occur:
458 -> 449 -> 442 -> 433
The 442 level stands out as a possible area for a local reversal.
---
Please subscribe and leave a comment.
You’ll get new information faster than anyone else.
---

Tesla - The next bullrun is coming!🚗Tesla ( NASDAQ:TSLA ) is clearly breaking out:
🔎Analysis summary:
In mid 2025, Tesla perfectly retested a major confluence of support. After Tesla then created bullish confirmation, the recent strong rally was totally expected. And with the current triangle breakout, Tesla is just starting its next major parabolic rally much higher.
📝Levels to watch:
$400 and $600
SwingTraderPhil
SwingTrading.Simplified. | Investing.Simplified. | #LONGTERMVISION

Tesla - Move BeginsThe move is starting according to the previously outlined plan.
The local reversal has likely occurred, and one of the sub-waves of C , specifically a downward impulsive wave, is being formed.
Let’s mark the initial targets:
473 -> 466 -> 458
The speed and strength of this downward move will provide insight into the overall market picture.
---
Please subscribe and leave a comment.
You’ll get new information faster than anyone else.
---

TSLA about to explodeSame cup and handle formation with a ascending triangle at the bottom that gold did before exploding higher.
Target 470 load you bags

Navigate the Intersection of AI Innovation & Regulatory ScrutinyTesla, Inc. stands as a premier and perpetually debated name at the forefront of artificial intelligence application within the public markets. Its stock remains on the radar of investors seeking exposure to transformative AI, primarily through its industry-leading investments in autonomous driving technology and ambitious robotics projects. Recent analyst commentary underscores the complex interplay between Tesla's groundbreaking innovation and the evolving regulatory landscape it must navigate.
Analyst Perspective: A Neutral Stance Amidst Regulatory Developments
Goldman Sachs recently reaffirmed its "Neutral" rating on Tesla on December 17th, maintaining a $400.00 price target. This assessment comes amid a specific regulatory development concerning the marketing of Tesla’s signature Autopilot system. As detailed in an investor note, the State of California issued a document indicating Tesla could face a 30-day suspension of vehicle sales in the state if it does not alter how it markets its Autopilot feature. This order, however, is stayed for 90 days to provide Tesla with a compliance window.
According to the report, Tesla can achieve compliance through one of two pathways: either cease using the "Autopilot" name for features that do not meet Level 3 (conditional automation) or higher standards, or enhance the capabilities of the Autopilot system itself to meet that L3 threshold. Goldman Sachs expressed a view of minimal business disruption, noting that Tesla has both the time to comply and a history of adjusting feature nomenclature for its advanced driver-assistance systems (ADAS) in various markets. The firm’s initial conclusion is that it would not expect a disruption to Tesla's critical California operations—a sentiment echoed by Tesla itself in a social media post stating it expects sales to continue uninterrupted.
Core Investment Thesis: An AI Company Disguised as a Carmaker
Tesla's identity extends far beyond its roots as an automotive manufacturer. It is fundamentally a vertically integrated automotive and clean energy company whose competitive moat and long-term value proposition are increasingly defined by its leverage of advanced artificial intelligence. This AI is the cornerstone of its Full Self-Driving (FSD) software, a suite that represents one of the most sophisticated real-world AI training and deployment systems globally. Beyond autonomy, Tesla's AI ambitions are further crystallized in its Optimus robotics initiative, which aims to develop general-purpose humanoid robots, and its Dojo supercomputer project, designed to accelerate the training of its AI models. These endeavors position Tesla not merely as a car company, but as a broad-based AI and technology leader.
Technical Analysis and Key Price Levels
From a technical analysis perspective, Tesla's stock exhibits volatility characteristic of a high-growth, sentiment-driven name, with several key Fibonacci retracement levels serving as crucial markers for traders. The chart identifies two primary support zones that have historically attracted buying interest or prompted consolidation.
The first support zone resides near $411.13, which aligns with the 0.236 Fibonacci retracement level. This represents a higher, more immediate area of potential support during pullbacks.
The second, deeper support zone is found around $359.09, corresponding to the 0.382 Fibonacci retracement level. This level is viewed as a stronger, more significant floor that could define a major trend if tested and held.
On the upside, a notable take-profit and resistance target is established at the $500 psychological and technical benchmark. A sustained break above this level would signal a powerful bullish resurgence and open the path toward new highs, likely contingent on significant advancements in its AI/FSD narrative or exceptional financial performance.
In summary, Tesla, Inc. embodies a high-conviction, high-volatility investment tied directly to the maturation of its AI-driven technologies. While near-term regulatory headlines, such as those from California, present manageable compliance hurdles, the overarching investment narrative remains focused on the company's ability to successfully scale and monetize its autonomous driving platform and other AI ventures. The stock's technical levels provide a framework for its volatile journey as the market continuously recalibrates its valuation of Tesla's core automotive business against its potentially revolutionary AI enterprise.

Capital Markets Structure Study ~ SpaceX Public ListingBill Ackman Proposal for a SpaceX Public Listing via SPARC
This publication examines a proposed capital markets structure outlined by Bill Ackman involving a potential public listing of SpaceX through Pershing Square SPARC Holdings. The purpose of this study is to explain the mechanics, rationale, and implications of the proposal from an educational and structural perspective.
The transaction described is not finalized and may never occur. This analysis focuses on how the structure would function if implemented, rather than predicting outcomes.
Overview of the Proposal
Bill Ackman proposed an alternative to the traditional IPO process for SpaceX that would bypass underwriters and instead distribute investment access directly to Tesla shareholders.
Key components of the proposal:
• SpaceX would merge with Pershing Square SPARC Holdings
• Tesla shareholders would receive Special Purpose Acquisition Rights
• These rights provide optional access to invest at a defined price
• No obligation to participate is required
The structure aims to change how IPO access is allocated and who benefits from early stage pricing.
What Are SPARs
Special Purpose Acquisition Rights are rights to invest, not equity itself.
How they function:
• Each SPAR grants the holder the right but not the obligation to purchase SpaceX shares
• Tesla shareholders would receive approximately 0.5 SPARs per Tesla share owned
• Each SPAR would be exercisable into two shares of SpaceX
• SPARs can be exercised or sold to other investors
This introduces optionality rather than forced participation, which differs materially from traditional SPAC structures.
Distribution Mechanics
Estimated structure based on Ackman’s outline:
• Approximately 1.723 billion SPARs outstanding
• Includes existing SPARC rights already issued
• Represents approximately 3.446 billion SpaceX shares
Capital raised depends entirely on the exercise price set for the SPARs.
Illustrative examples:
• At approximately 11 per SPAR the raise approaches 42 billion
• At approximately 42 per SPAR the raise approaches 148 billion
Pershing Square has indicated a fixed 4 billion commitment regardless of market participation.
Why Tesla Shareholders Are Central
The proposal prioritizes Tesla shareholders as the initial recipients of SPARs.
Rationale:
• Tesla shareholders have historically supported Musk led ventures
• They receive first access to SpaceX public equity
• If uninterested they can monetize the rights directly
This structure shifts IPO value capture away from underwriters and toward existing public shareholders.
Structural Differences vs Traditional IPOs
Key contrasts:
• No underwriting banks
• No roadshow process
• No underwriting fees typically ranging from 3 to 7 percent
• No sponsor warrants or founder dilution
• No preferred equity layers
SpaceX would list with a single class common equity structure, simplifying ownership and governance.
Transaction Cost Profile
• Minimal legal and administrative costs
• No underwriting or allocation fees
• SPARC sponsor waives warrant rights
• No dilution beyond exercised SPARs
Compared to conventional IPOs this materially reduces friction and cost leakage.
Timeline Considerations
Indicative timeline suggested:
• Due diligence and definitive agreement within approximately 45 days
• Potential announcement window as early as early 2025
The absence of roadshows and pricing negotiations significantly compresses execution time.
Extension to Future Listings
The proposal includes potential distribution of additional SPARs tied to Pershing Square SPARC Holdings II.
Possible use case:
• Future public listing of xAI
• SPAR holders in SpaceX gain priority access
• Creates an ecosystem based capital access model
This introduces a layered optionality framework across Musk affiliated companies.
Market Implications
If implemented this structure could influence:
• How IPO access is allocated
• The role of underwriters in large listings
• Future use of SPARC vehicles
• Retail participation in high profile listings
It reframes IPO participation from allocation based to rights based.
Key Risks and Uncertainties
Primary considerations include:
• Regulatory approval and SEC review
• Valuation alignment with market demand
• Execution risk in a novel structure
• Dependence on founder participation
• Broader market conditions impacting exercise rates
SPAR holders retain discretion not to invest, which could limit capital raised.
Strategic Motivation Behind the Proposal
From a structural standpoint:
• Pershing Square gains defined exposure to SpaceX
• SPARC framework gains validation
• The sponsor differentiates itself in capital markets innovation
• Alignment with founder led enterprises strengthens
This is both a capital allocation and reputational strategy.
Summary Assessment
This proposal represents a structural rethinking of public listings rather than a simple transaction.
Core innovations:
• Optional participation rather than mandatory capital commitment
• Direct rights distribution to existing shareholders
• Elimination of underwriting intermediaries
• Simplified equity structure
• Expandable framework for future listings
Whether executed or not, the proposal demonstrates how capital markets structures themselves continue to evolve.
Final Notes
This analysis is educational and informational only. It does not constitute investment advice or a recommendation to participate in any security or transaction. The SpaceX proposal discussed is speculative and subject to regulatory, market, and execution risks.
Market participants should conduct independent research and consult qualified professionals before making financial decisions.

180k next year?It currently looks bearish as it broke below the raising wedge. If it closes inside the wedge may be in a month or so, then its bullish sign and can hit 180k by end of next year.
This is a bull case.
Happy trading !!

TESLA Free Signal! Buy!
Hello,Traders!
TESLA smart money defended the horizontal demand after a clean sell-side liquidity sweep. Strong bullish displacement confirms institutional re-entry, with price holding above the mitigation block and targeting the next buy-side liquidity resting at equal highs.
--------------------
Stop Loss: 463.98$
Take Profit: 505.66$
Entry: 483.07$
Time Frame: 4H
--------------------
Buy!
Comment and subscribe to help us grow!
Check out other forecasts below too!
Disclosure: I am part of Trade Nation's Influencer program and receive a monthly fee for using their TradingView charts in my analysis.

Tesla (TSLA) – When the Uptrend Is “Locked In” by the EMA89Hello everyone, this is Domic.
Looking at Tesla’s recent price action on the 4H timeframe, the market is telling a fairly clear story. TSLA is not just moving higher — it is rising in a very “textbook” manner: supported by leading capital flows, reinforced by macro expectations, and confirmed by a constructive technical structure. The approach toward the 490 USD area is therefore not a random spike, but the result of a deliberate accumulation and breakout process.
On the macro layer, the narrative remains familiar yet still valid: expectations that the Fed may begin a rate-cutting cycle next year are driving capital back into growth stocks. Assets that are highly sensitive to “cheaper money,” such as Tesla, naturally become primary destinations for this flow. What stands out is how the capital is participating: volume expands sharply on breakouts, while pullbacks remain shallow and are quickly bought up. This behavior suggests not just retail interest, but clear involvement from active, institutional-style flows.
At the same time, the market appears to be gradually re-pricing Tesla’s growth story. Margins are showing signs of recovery after the aggressive vehicle price cuts, while long-term themes such as FSD and robotaxi continue to be viewed as core drivers that are not yet fully reflected in the stock price. In a broader market recovery, Tesla maintains its role as a central name within the EV sector — a stock that investors find hard to ignore as risk appetite returns.
In short, Tesla is not rising on expectations alone. Price, capital flow, narrative, and structure are all aligned on the same side. And as long as EMA89 continues to hold, this uptrend remains the primary story the market is following.

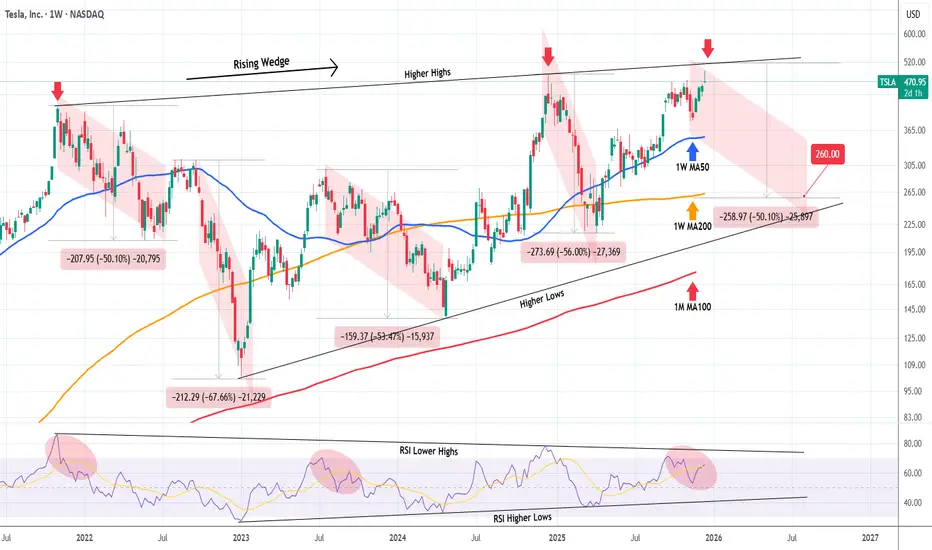
TESLA Did it just get rejected on its 4-year Resistance?Tesla (TSLA) has been trading within a Rising Wedge pattern since the November 01 2021 High. The current weekly (1W) candle almost hit this pattern's top (Higher Highs trend-line) yesterday and today got rejected.
That is the 4-year Higher Highs Resistance that initiated Tesla's last major correction of -56% during December 16 2024 - April 07 2025. Technically this pattern has provided another 3 such major correction events, with all declining by at least -50.10%.
With the 1W RSI also trading within its own Wedge, displaying a similar peak pattern, we expect the price to start a strong decline of at least 6 months. The minimum -50.10% decline projection from the Higher Highs trend-line, gives a $260.00 Target estimate. If the 1W RSI hits its Higher Lows (bottom) trend-line first, we can consider taking the profit on this one earlier.
---
** Please LIKE 👍, FOLLOW ✅, SHARE 🙌 and COMMENT ✍ if you enjoy this idea! Also share your ideas and charts in the comments section below! This is best way to keep it relevant, support us, keep the content here free and allow the idea to reach as many people as possible. **
---
💸💸💸💸💸💸
👇 👇 👇 👇 👇 👇
You will ask yourself "how did he know Telsa would make ATH"?This fractal suggested Tesla would soon hit ATH (if it continued to follow Palantir). I've been following this pattern for months (see previous Tesla fractal charts). Here's an example:
But what if Tesla wasn't "following" Palantir minute for minute...but somehow Tesla was ofset (as shown in today's chart? Then a different outcome is revealed.
Today's chart has been a Tesla map and has offered confluence for the charts that I have recently published showing my tesla buy zone before ATH. Everything pointed towards ATH.
I added to my Tesla positions by setting buy orders down to $386 based on the above chart (the anticipated low). Tesla's actual low was around $382. I am pleased that this retracement's bottom was called within 1%. And the anticpated bounce to ATH has also played out as a 35% pump from the $382 low to new ATH (35% so far in the past 16 trading days).
Congratulations to everyone making gains following along.
Now the question remains how high will Tesla's 3rd angle blow off go?
More importantly, how will we know when to get out...before the inevitable larger retracement after this blow off? Following along for the answer to that million dollar question.
May the trends be with you.

Tesla (TSLA) Shares Close at a Record HighTesla (TSLA) Shares Close at a Record High
On Tuesday, 16 December 2025, Tesla shares closed at a new all-time high, breaking above the $488 level.
As a result, TSLA:
→ surpassed its December 2024 peak;
→ is up by roughly 125% from this year’s lows;
→ made Elon Musk the first person in the world whose net worth has exceeded $600 billion.
Why are TSLA shares rising?
Elon Musk has officially confirmed that Tesla has begun testing driverless robotaxis in Austin, Texas, without safety monitors in the vehicle. This marks an important step towards the large-scale deployment of the Robotaxi concept.
Despite a decline in electric vehicle sales in November (following the removal of tax incentives by the new US administration), TSLA shares continue to rise as market participants are pricing in Tesla’s potential dominance in artificial intelligence and autonomous transport — a development that could unlock fundamentally new revenue streams for the company.
Supporting this outlook, several investment banks have raised their price targets for TSLA. For instance, Mizuho analysts lifted their target to $530.
Technical perspective
When analysing TSLA on 12 November, we:
→ identified an ascending channel and a support zone between $360 and $400;
→ suggested that the previous high was limiting bullish momentum, with the market entering a consolidation phase.
Since then (as shown by the blue arrow), TSLA shares:
→ broke out of the consolidation zone;
→ found support near the lower boundary of the ascending channel;
→ resumed their upward trend.
It is worth noting that trading volumes in early December were relatively low — which can be interpreted as a lack of selling pressure. However, the subsequent move into the upper half of the channel was accompanied by a surge in trading activity and the formation of a bullish gap (marked by the black arrow). This signals strong demand, with buyers willing to pay higher prices for a high-quality stock.
Looking ahead, it is possible that:
→ the former resistance at $465 will turn into a new support zone;
→ the current bullish impulse could drive attempts to challenge the psychological $500 level.
This article represents the opinion of the Companies operating under the FXOpen brand only. It is not to be construed as an offer, solicitation, or recommendation with respect to products and services provided by the Companies operating under the FXOpen brand, nor is it to be considered financial advice.
