Tesla - The massive triangle breakout!🪩Tesla ( NASDAQ:TSLA ) is breaking out:
🔎Analysis summary:
Last month, we witnessed an incredible but expected rally of about +35% on Tesla. Furthermore, with this move Tesla is attempting to break above the previous all time highs. After bullish confirmation, this would also lead to a massive triangle breakout.
📝Levels to watch:
$400
SwingTraderPhil
SwingTrading.Simplified. | Investing.Simplified. | #LONGTERMVISION
Teslaanalysis


TESLA EARNINGS OCT 16 2025Price action for Tesla is here. I have clearly explained my plan on how to trade tesla considering every factor in market.
STAY AWAY FROM TRADING TESLA
NOTE: OPTION WILL BURN YOUR CAPITAL

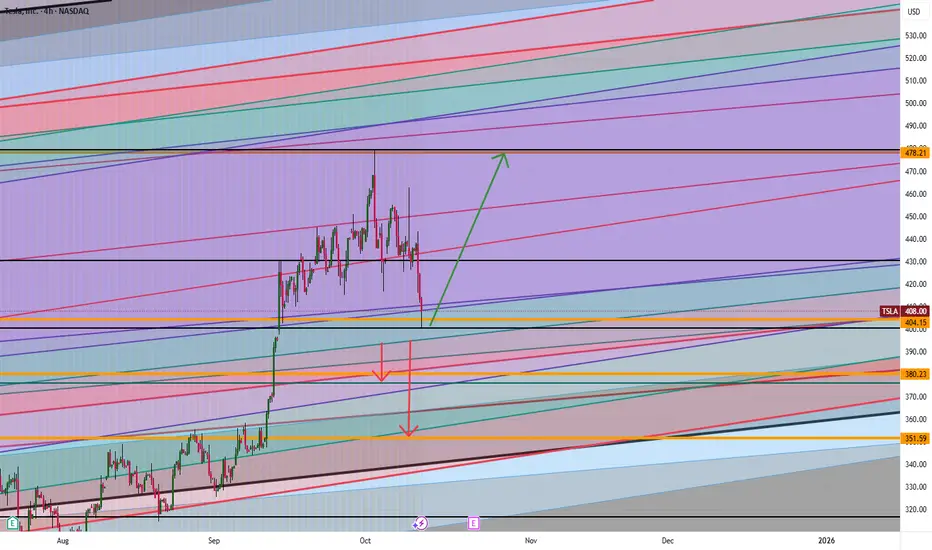
Tesla: Will It Blast Off or Fall Fast? The $404 Level Is the KeyTesla is at a big “make or break” point. If the price stays higher than $404, it could blast up to $437 or maybe even $478. But if Tesla drops below $404, watch out! It could fall down to $380 or even as low as $351.
Think about it:
What would you do if Tesla started moving toward those numbers? Do you think it will go up or will it go down?
If you’re not sure or have a question, send me a message! Sometimes asking one good question can help you make a smarter trade. What do you want to know about Tesla right now?
Mindbloome Exchange
Tesla & Palantir STILL following this fractal.On oct 7th I suggested that Tesla and Palantir were following the same fractal (on the daily & 15 min time frames). They are both still following the fractal, over a week later.
Repeating patterns are everywhere, once we know how tho spot them.
May the trends be with you.

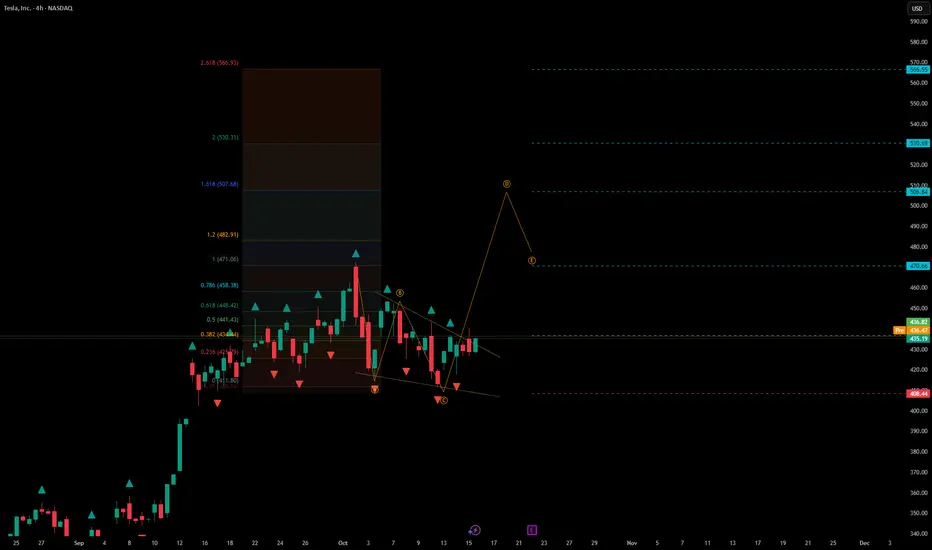
Tesla – ABC Formation as Trend Continuation#Tesla – ABC Formation as Trend Continuation
Current price: $435.8
Tesla is developing an ABC corrective structure that may act as a continuation pattern within the broader uptrend. Price action is consolidating after a strong impulsive leg, preparing for the next directional move.
🧩 Technical Overview
• The correction from the recent high appears to have formed a descending wedge, with the last swing down completing near the C-wave low.
• Price is now recovering from that area, suggesting a possible upward continuation phase.
• As long as the current low holds, the market structure supports bullish continuation through the upper Fibonacci levels.
📈 Scenario
• Structure: ABC correction completed; price attempting breakout to resume the dominant uptrend.
• Stop-loss: below the C-wave low (~$408).
• First upside objectives:
– $448–$458 — short-term resistance zone
– $470–$483 — key breakout area and prior swing high
– $507–$530 — potential extension zone if momentum builds
• A breakout above $470 would confirm trend continuation.
⚙️ Market Context
• The larger bullish trend remains intact after strong momentum from early September.
• Consolidation within the current wedge has reduced volatility — a typical setup before expansion.
• The pattern favors continuation as long as price holds above $408–$410 support.
🧭 Summary
Tesla is completing an ABC correction that could transition into the next bullish leg.
Holding above $408 keeps the structure valid for continuation toward $470–$530.
Breakout confirmation above $470 would reinforce the bullish scenario, while a drop below $408 would invalidate it.
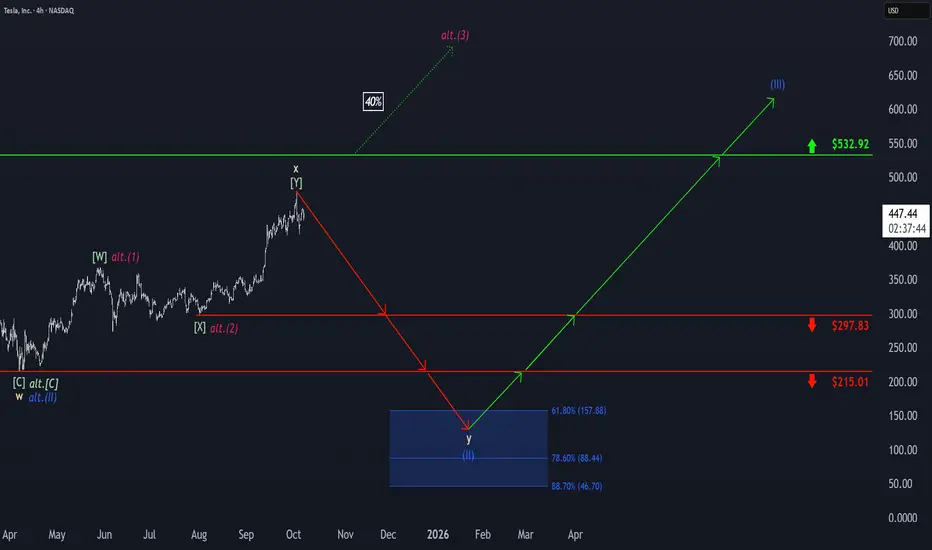
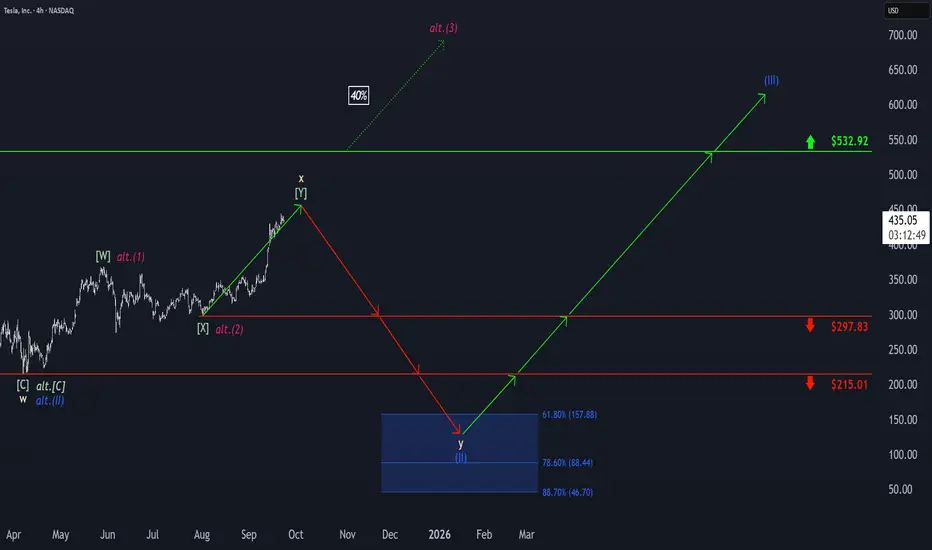
Tesla: Top Established!Tesla initially hit a new high before quickly reversing course with a notable move to the downside. As a result, we now view the corrective upward movement of beige wave x as complete and anticipate further sell-offs as part of wave y. The stock is expected to gradually break below the support levels at $297.83 and $215.01, ultimately reaching our blue Target Zone between $157.88 and $46.70, which we have identified for the final corrective low of blue wave (II). However, there remains a 40% chance that TSLA will not reach the blue zone at all but instead will break out directly above resistance at $532.92. In this case, we would consider blue wave alt.(II) already complete and locate the stock in a sustained (magenta) upward impulse. Even in our primary scenario, the new uptrend of the regular wave (III) is ultimately expected to surpass the $532.92 resistance.
Here is the Palantir / Telsa Fractal on current 15 min timeframeFractals are a mathmatical anomaly, if you understand linear equations (and believe the market is "random"). All assets are doing the same patterns over and over, on all time frames. You just need to see it for what it is.
May the trends be with you.
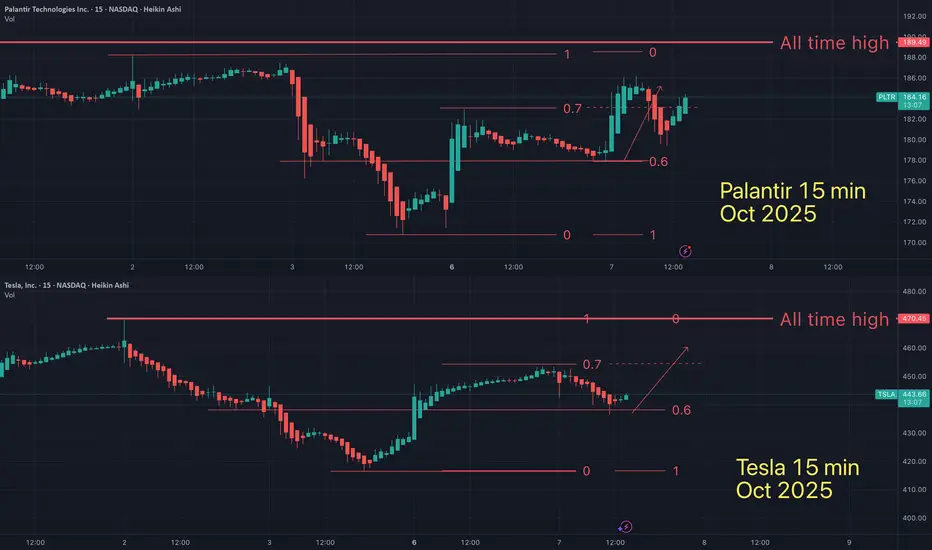
Is this Tesla / Palantir fractal showing both will hit ATH soon?Fractals are a mathmatical anomaly, if you understand linear equations (and believe the market is "random"). All assets are doing the same patterns over and over, on all time frames. You just need to see it for what it is.
May the trends be with you.

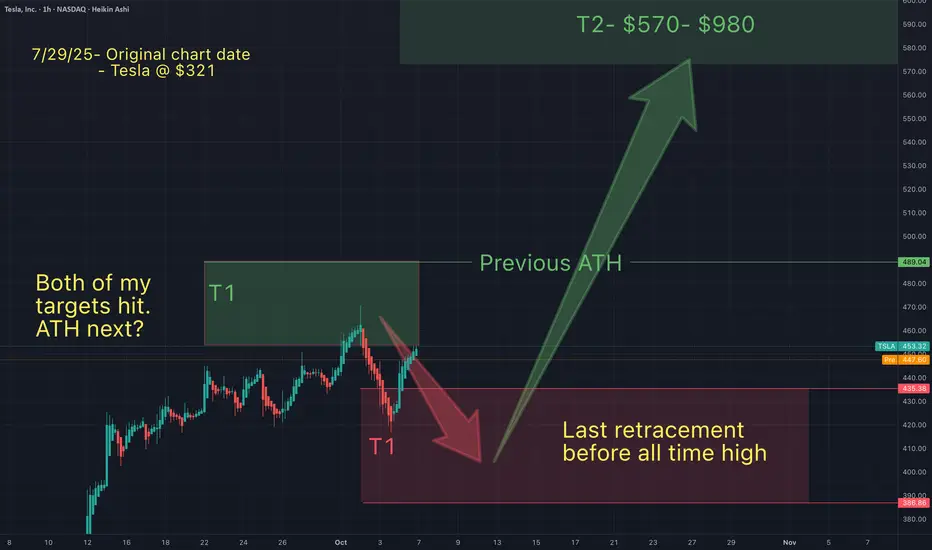
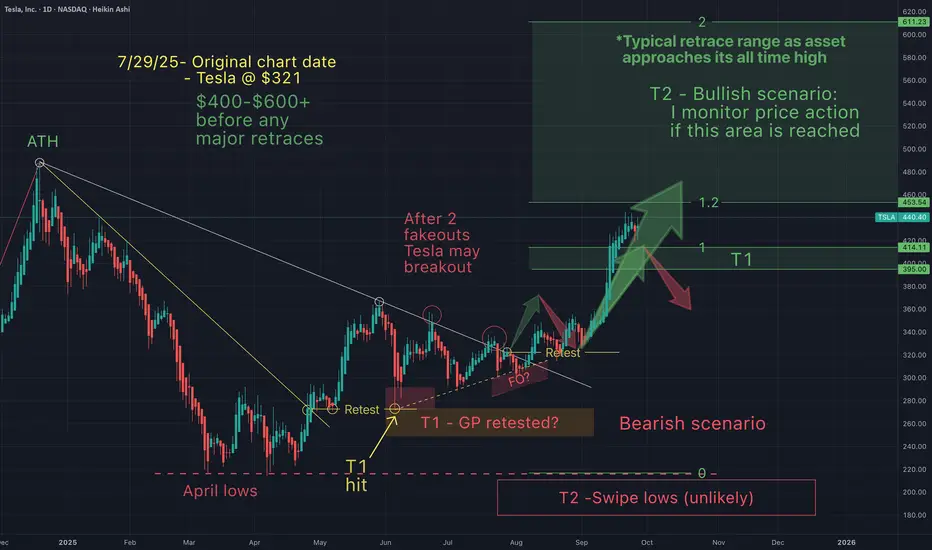
You will ask yourself "how did he know Tesla would do that"?On July 29th I suggested Telsa would follow a predicatble path. Price action has unfolded as anicipated every step of the way.
After a long run up, on Oct 1st I suggested that Tesla had topped at my green T1 and would retrace into my red support zone and bonce.
Now that this has played out, the only question that remains is Tesla going lower into my red T1...or simply all time highs from here?
Either way, Tesla may be about to melt faces (few & small retracements). For the next 2-10 weeks Tesla may form a blow off top (*"IF" Telsa continues this pattern). This blow off, will be the end of this bull pattern that I have been following since the April lows. Once Tesla hits my next range ($570-980) I expect a huge dump. I will monitor price action closely, once Tesla is in this next range.
May the trends be with you.
TESLA PRICE ACTION 5th OCTOBER 2025Price action for Tesla is here. I have clearly explained my plan on how to trade tesla considering every factor in market.
NOTE: OPTION WILL BURN YOUR CAPITAL

Smart Money Support/Resistance + ATAI Volume Analysis —PracticalApplication
When these two indicators work together — Smart Money Support/Resistance (Lite) and ATAI Volume Analysis with Price Action — the chart begins to speak a clearer language: one defines where the reaction zones form, and the other explains what happens inside them. The purpose is not prediction but understanding the balance between smart money pressure and retail momentum.
1. Parameter Alignment
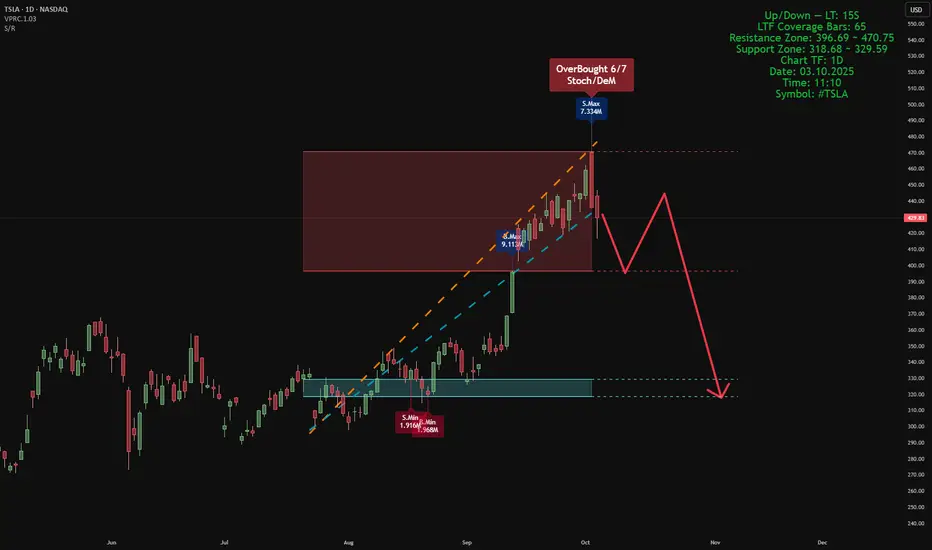
On the right side of the chart, the green info panel confirms that both indicators share identical configurations. In this example, the lookback period is set to 52, chosen deliberately because it must be smaller than the total number of LTF coverage bars (65). For the Smart Money Support/Resistance indicator, the projection is set to 26 — extending the detected zones forward without adding excessive visual noise. This alignment is crucial; mismatched parameters can desynchronize volume readings and structural boundaries.
2. Reading the Chart
In this sample chart, the upper red area represents a Smart Money resistance zone — a region of concentrated selling pressure detected from lower timeframe volume. Simultaneously, ATAI Volume Analysis signals an Overbought (6/7) condition, meaning multiple oscillators confirm exhaustion while seller volume (S.Max) begins to outweigh buyer volume (B.Min). This overlap suggests that liquidity has shifted and the prior bullish impulse is weakening. From here, price may consolidate within the zone or initiate a structured retracement toward the blue support area, previously defined by accumulation volume. The red projected path simply visualizes one potential structural scenario; it is not a prediction or trade signal.
3. Broader Context
This example serves only as a demonstration of how these two tools interact when properly tuned. Different assets and timeframes naturally yield unique structures and behaviors, yet the principle remains consistent: define the territory first with Smart Money Support/Resistance, then interpret market behavior within it using ATAI Volume Analysis.
This content is for educational purposes only — not financial advice. User feedback and practical observations play a key role in refining future versions of both indicators.
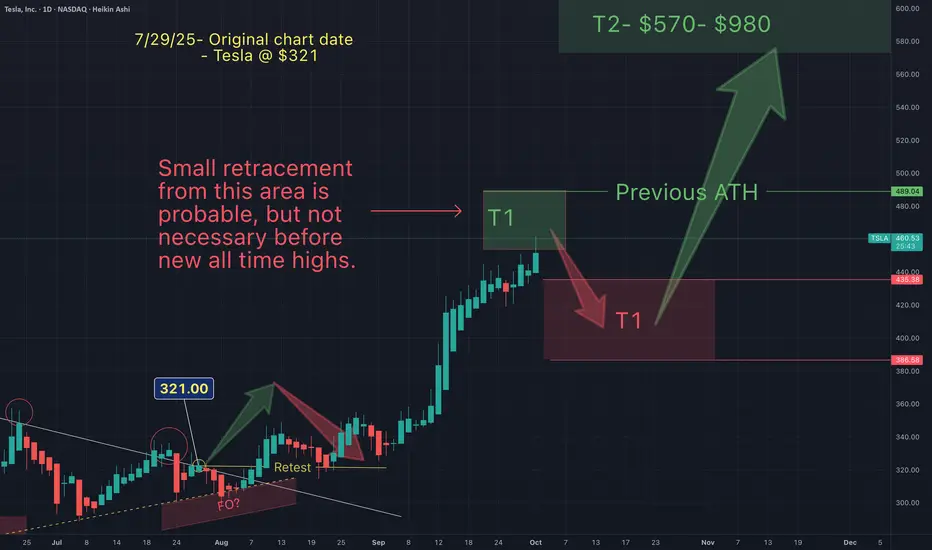
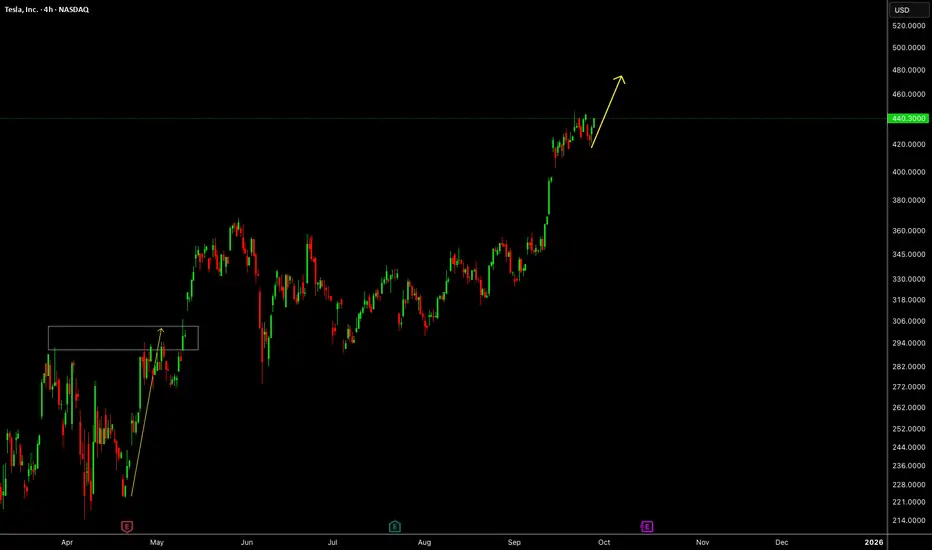
Telsa - NEW ALL TIME HIGHS INCOMING (price action simplified)Here's a simplified version of my short term targets. On July 29th Tesla was around $321 and I suggested that after a long downtrend, Tesla would breakout, retest and continue up ("without any major retraces)", to between $400-$600.
Tesla has now hit my T2 (currently $460) and I am anticipating a small retracement, before new all time highs in the near term.
Congrats to all of you who have made gains from my charts.
May the trends (continue) to be with you.
Tesla - Here we goooooo!🚗Tesla ( NASDAQ:TSLA ) is finally breaking out:
🔎Analysis summary:
Finally, after a consolidation of four years, Tesla is attempting another all time high breakout. With the bullish triangle coming to an end, bulls are dominating this stock. It just comes down to the next couple of months but a triangle breakout remains far more likely.
📝Levels to watch:
$400
SwingTraderPhil
SwingTrading.Simplified. | Investing.Simplified. | #LONGTERMVISION

Tesla (TSLA) Share Price Rises Ahead of Earnings ReportTesla (TSLA) Share Price Rises Ahead of Earnings Report
On 16 September, we noted signs of a strong market for Tesla (TSLA) shares, including:
→ The price remaining above the psychological level of $400;
→ Reaching the highest levels since late January.
We also identified an ascending channel and suggested that the long-term outlook remained optimistic, although a correction could not be ruled out.
Since then, TSLA shares have stabilised near the upper boundary of the channel, holding above the $400 level. On Friday, they were among the market leaders, rising by more than 4%. This brings the gain since the start of September to around +30%.
Why Are TSLA Shares Rising?
Key factors supporting a bullish outlook include:
→ Sentiment ahead of the quarterly Production and Deliveries report, expected this week. According to recent forecasts, actual figures could exceed expectations (although still showing a decline compared to the previous year).
→ Target price upgrades. Dan Ives of Wedbush, one of Tesla’s most prominent bulls, last week raised his target price to $600 — the highest on Wall Street — citing substantial potential in AI and robotaxi development.
→ The “Musk factor”: Discussions around Elon Musk stepping away from politics are seen as a long-term positive driver.
Technical Analysis of TSLA Shares
The ascending channel remains intact. However, the chart suggests that the upper boundary now acts as resistance — unsurprising given the exceptional gains in September (noting that TSLA’s price has doubled since its yearly low). A slowdown in momentum is signalled by a bearish divergence on the RSI indicator.
Resistance at the upper boundary is further reinforced by a strong bearish reversal from late 2024. A similar pattern was recently observed when the price struggled to break above the bearish reversal zone at $345–355, resulting in an extended sideways movement in August and early September.
By analogy, the $445–465 zone may also act as resistance — meaning a correction remains a plausible scenario. For example, TSLA stock price could pull back to test the psychological $400 level, which is supported by the median of the current channel.
This article represents the opinion of the Companies operating under the FXOpen brand only. It is not to be construed as an offer, solicitation, or recommendation with respect to products and services provided by the Companies operating under the FXOpen brand, nor is it to be considered financial advice.

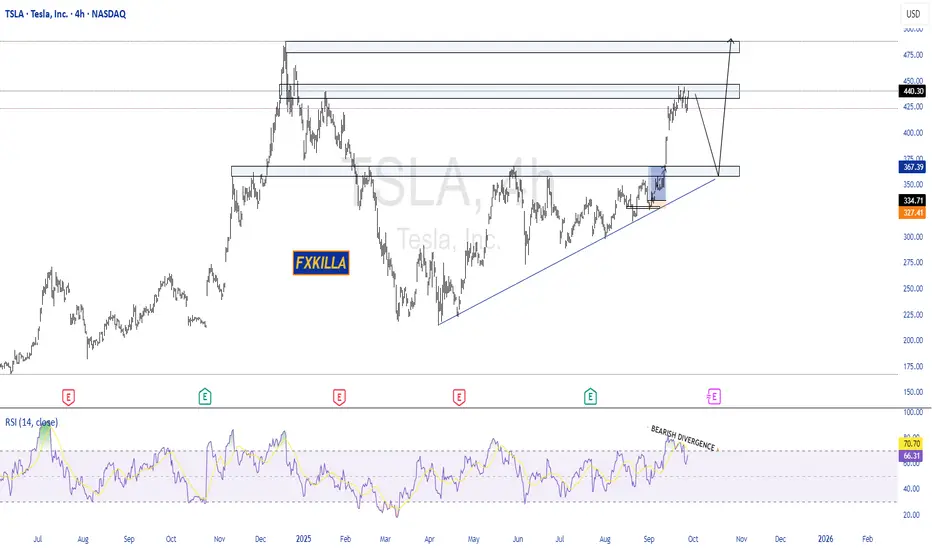
TESLA HIGH PROBABILITY SETUPS SOON!!!🚨 TESLA HIGH PROBABILITY SETUPS 🚨
* Here We Can See The Next Potential Moves For TSLA Coming Hours/Days.
* Keep Your Eyes Close On Your Trading Positions.
* Happy PIP Hunting Traders.
FXKILLA.
TSLATESLA looks bullish early part of this week, 470+ is the target level.
Disclosure: We are part of Trade Nation's Influencer program and receive a monthly fee for using their TradingView charts in our analysis.
You will ask yourself "how did he know Tesla would do that"?On July 29th Tesla was $321 and I suggested (after a breakout & retest) Tesla would pump straight to low $400s (without any retraces). Now that the trading week has closed here's an update:
Things are still going according to what I expected. But how is this possible...I don't have a crystal ball! How could I have predicted this even *before Elon claimed to have invested 1B into Tesla?
Did Elon know something that we didn't or did I know something you didn't?
Is it the "narative" or the ongoing, repeating, predicable chart patterns?
TA works!
Tesla - SHOW ME THE CHART AND I WILL TELL YOU THE NEWS!Back in June and July, Elon and Tesla were STILL getting a lot of bad press (Elon fighting with President Trump, people burning Tesla cars etc). Those that follow me may recall on July 29th I wrote the following:
"Tesla just needs a narrative shift (ie -new invention etc), & price action changes in a heart beat.
Yet, price action really has less to do with the news making Elon a hero, then a villain and then back and forth...but moreso to do with price action patterns that just keep repeating".
And you'll note that my July chart suggested that the huge pump to $400+ would begin around Sept 1st (Huge green arrow after the retest). What a coincidence that 2 weeks later Elon announces a $1Billion dollar Tesla stock buy (the new anticipated "narrative"). My huge green arrow was there many weeks before this "news". How could I have known?
SHOW ME THE CHART AND I WILL TELL YOU THE NEWS.
On July 29th Tesla was $321 and I suggested that Tesla was about to have a major breakout to at least $400 "with no major retraces". That target has now been hit. Is it because of the news or is it the patterns that just keep repeating?
My T1 targets are probable targets, so I anticipate them almost always getting hit. My ideal buy and sell targets are T2. Tesla now appears to be headed into my T2 target, so it's time to start monitoring price action closely.

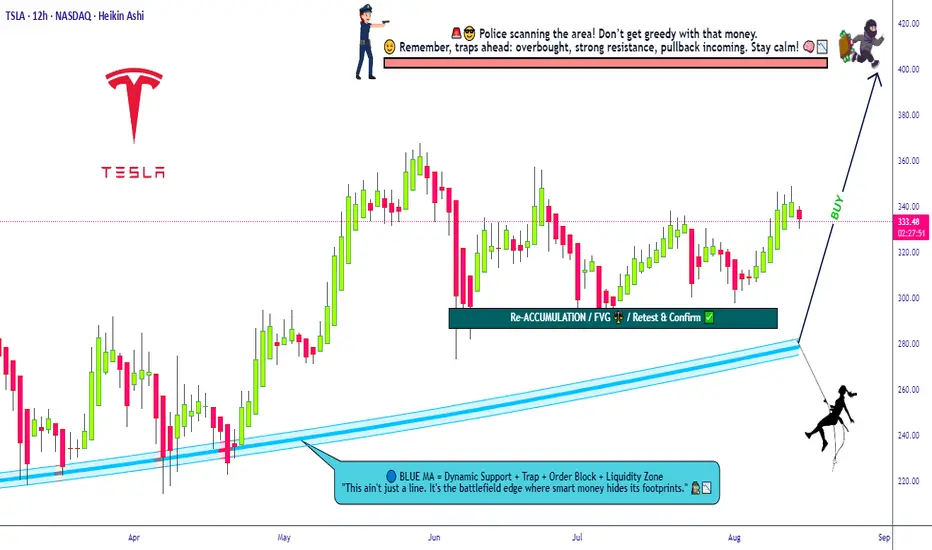
Bullish Tesla Mission Activated – Grab the Loot Now!💎🚨 TESLA STOCK MARKET HEIST PLAN 🚨💎
🕵️♂️ Attention All Thief OG’s, Chart Ninjas & Wall Street Pickpockets!
We’re gearing up for a full-blown Tesla loot mission — bullish, layered, and locked on target! 📈💰
🎯 Plan:
Bullish Layered Entry Strategy 🤑
We’re stacking multiple BUY LIMIT layers like a pro bank job:
💵 (330.00) | 💵 (320.00) | 💵 (310.00) | 💵 (300.00)
(You can add more layers if you want to steal bigger)
🛑 Stop Loss:
The Thief’s SL @ 280.00 💣
📌 Adjust to your own risk — every crew member knows their escape route!
Remember: A good thief never leaves fingerprints, only profits.
🏆 Target:
🚓 Police barricade at 420.00 — better vanish before the sirens!
🎯 Secure the main loot at 400.00 before making a clean getaway.
💡 Thief Strategy Tip:
Layering lets you grab more loot if price dips — like breaking into multiple vaults.
Keep your disguise on and watch the charts — Wall Street guards are always watching. 👀🖤
⚠️ Warning for the Crew:
Major news drops = cops on every corner.
Stay hidden, trail your stops, and protect the stash.
💥 Smash the ❤️ LIKE button if you’re in for this Tesla mission!
📌 Follow the crew for more Thief Trader blueprints — next heist drops soon!
Tesla: Upward Momentum PersistsTesla’s upward momentum has persisted, with the beige wave x still having some room to run. However, we expect the corrective top to form well below resistance at $532.92, which should then trigger the final selling phase within the broader correction. Ultimately, wave y is projected to approach our blue Target Zone between $157.88 and $46.70, completing the large blue wave (II) in that range. Afterward, we anticipate a new wave (III) uptrend. That said, there remains a 40% probability that price may not reach the blue zone, as wave alt.(II) could have already completed at $215.01. In this scenario, TSLA would already be developing a magenta upward impulse and could break above the $532.92 level directly and sustainably.
Tesla on Track – Golden Zone Respect Leading to $867 TargetAs we discussed in the earlier setup, Tesla retraced beautifully into the golden zone (62–79% retracement area) after sweeping sell-side liquidity. This zone aligned with a higher-timeframe order block, providing strong confluence for a bullish reaction.
The price has since respected that golden zone, confirming buyers stepped in aggressively and validating the bullish bias. From here, the market structure points toward continuation to the upside, with immediate targets at prior buy-side liquidity pools, eventually extending toward the $867 region, a level that aligns with the 100% Fibonacci projection and liquidity resting above previous highs.
This setup illustrates a textbook ICT/SMC play:
Liquidity Sweep ✅
Golden Zone Respect ✅
Strong Bullish Reaction ✅
Clear Buy-side Targets Ahead ✅
If momentum holds, Tesla remains positioned for a multi-month expansion leg toward the $867 target zone.
⚠️ DYOR: Not financial advice. Always confirm setups with your own framework and risk management.

Tesla - Technicals are pretty clear!🚨Tesla ( NASDAQ:TSLA ) respects the triangle:
🔎Analysis summary:
Ever since Tesla was listed on the Nasdaq, we saw perfect cycles playing out. Since 2021, Tesla has once again been consolidating within a bullish triangle pattern. Therefore with the recent bullish break and retest, it becomes more and more likely that Tesla will break out soon.
📝Levels to watch:
$400, $250
SwingTraderPhil
SwingTrading.Simplified. | Investing.Simplified. | #LONGTERMVISION
