You will ask yourself "how did he know Tesla would do that"?On July 29th I suggested Telsa would follow a predicatble path. Price action has unfolded as anicipated every step of the way.
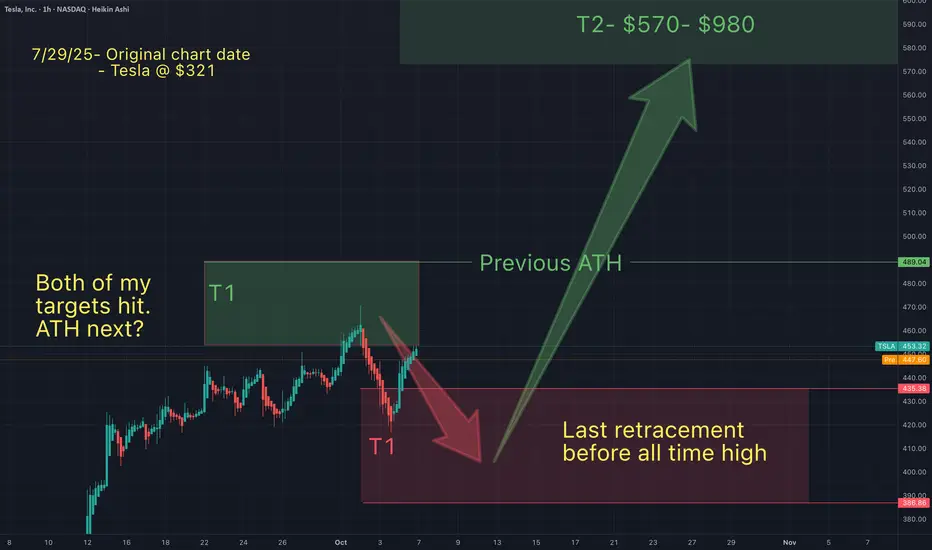
After a long run up, on Oct 1st I suggested that Tesla had topped at my green T1 and would retrace into my red support zone and bonce.
Now that this has played out, the only question that remains is Tesla going lower into my red T1...or simply all time highs from here?
Either way, Tesla may be about to melt faces (few & small retracements). For the next 2-10 weeks Tesla may form a blow off top (*"IF" Telsa continues this pattern). This blow off, will be the end of this bull pattern that I have been following since the April lows. Once Tesla hits my next range ($570-980) I expect a huge dump. I will monitor price action closely, once Tesla is in this next range.
May the trends be with you.
Teslabull
You will ask yourself "how did he know Tesla would do that"?On July 29th Tesla was $321 and I suggested (after a breakout & retest) Tesla would pump straight to low $400s (without any retraces). Now that the trading week has closed here's an update:
Things are still going according to what I expected. But how is this possible...I don't have a crystal ball! How could I have predicted this even *before Elon claimed to have invested 1B into Tesla?
Did Elon know something that we didn't or did I know something you didn't?
Is it the "narative" or the ongoing, repeating, predicable chart patterns?
TA works!
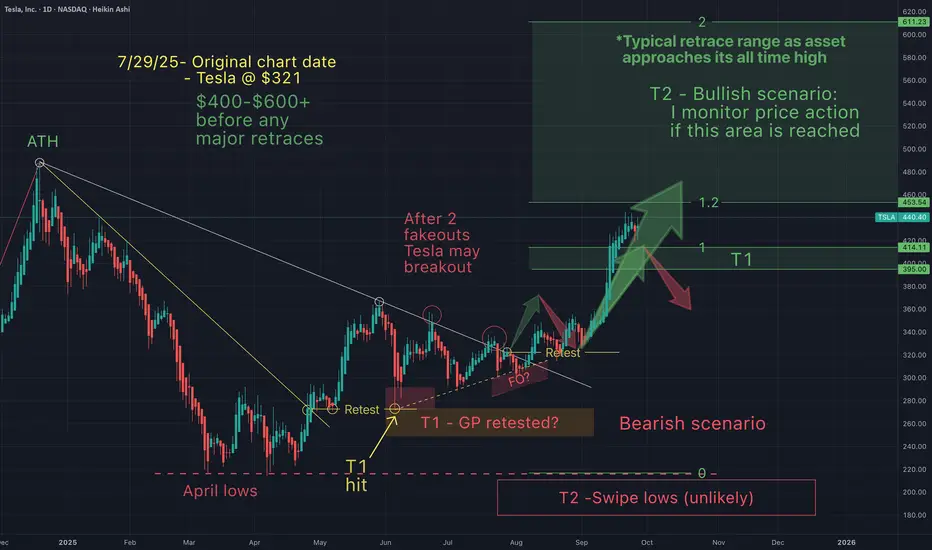
You will ask yourself, "how did he know Tesla would do that"?On July 29th, I posted this chart suggesting that I anticipated a typical pattern to emerge. Things are going according to what I was expecting.
Congratulations to everyone who has been making some gains here based on everthing that was discussed in the charts.
The most important thing in my opinion is a trading strategy...and these strategies have made us incredible gains across the board.
Only question remains, will Tesla hit my T2. What do you think?
May the trends be with you.
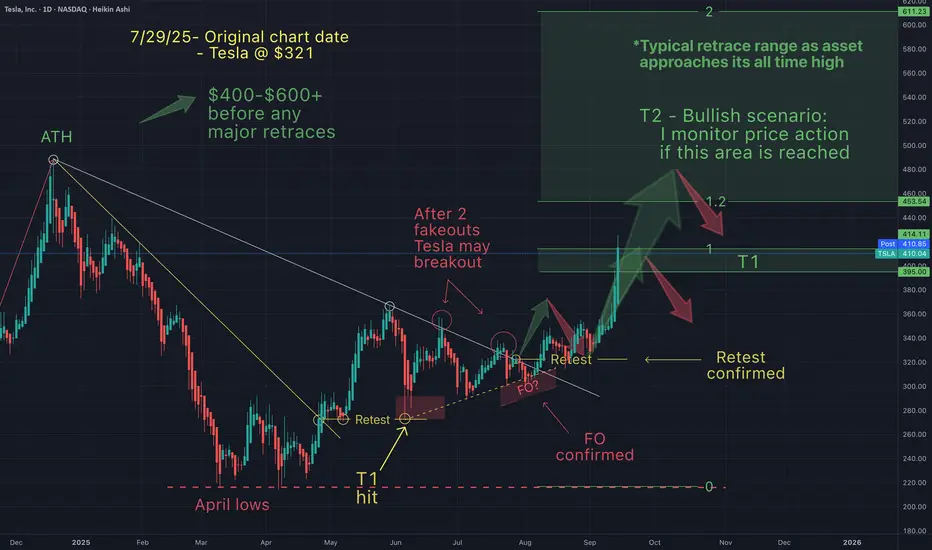
You will ask yourself, "how did he know Tesla would do that"?I wrote this on my July 29th chart description (below):
"Price action really has less to do with the news making Elon a hero, then a villain and then back and forth...but moreso to do with price action patterns that just keep repeating". Since then, the pattern has played out exactly as anticipated, and my 1st take profit target just hit (+22%).
July 29th chart:
Now the question remains, will Telsa hit my next target range (T2). Although it is a much larger range than my T1, I will monitor price action closely and use TA to get out near the top before the next major retracement.
Let me know if you're into Tesla and if you are interested in me charting the top of this run.
May the trends be with you.

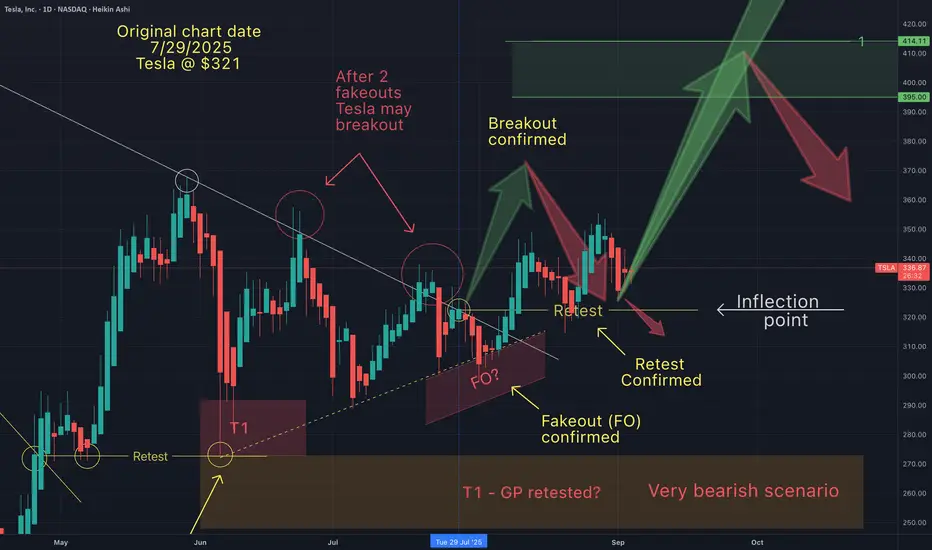
You will ask yourself, "how did he know Tesla would do that"?On July 29th I suggested that Tesla would drop into into my fakeout zone, followed by the usual "stop hunt-rise" and retrace (to test the breakout).
Once I saw 2 fake breakouts of trend, I expected this breakout to occur (after the fakeout). Once the breakout occurs, we always see the retest. The only question that remains is Tesla going to continue to follow the path outlined on my chart?
If Tesla does what it almost always does during this pattern, the answer is yes. There may be a quick liquidity grab below the breakout low, before continuing up towards my Bullish T1 target.
But keeping in mind, that Tesla is at an inflection point, I'm prepared for the possibility of a bearish scenario. Anticpating price action helps me quickly invalidate my trade ideas, so I can pivot accordingly. Therefore if Tesla holds resistance below $300, I expect a test of my bearish T2 target.
For now I remain cautiosly bullish until proven otherwise.
May the trends be with you.
Yes I do still have my Stock - Tesla TSLA $ 722 My next stopAsked if I still have confidence in TSLA today.
Hell yer wish I had more to be honest.
See you at $700+ Tesla 👍

Tesla 4 HOUR Are we Going to 234???? Good morning Traders
In this video I speak on Tesla and doing a quick break down on which levels to look for if we are breaking up with a target of 134 and beyond.
Enjoy the video
If you have any questions, comments, tell me what you like , dont like and what videos you want to see.
Happy Hunting
MB Trader

Tesla 30 Min Correcting up now !!!!!!Good morning traders
Here is your 30 minute view of what the market looks like its doing:
Currently we have some strong resistance at 220-223 area: my best thesis is we hit here and then fall back down.
However we follow the market not predict it therefore if those levels break then I would not be surprised we go back to the top correct a touch and then break through and head up to the 280 range.
Any questions, what you like and dont like let me know happy to help where I can
MB Trader

Tesla Daily Correction then back down again? Based on our Monthly and Weekly Thesis: Tesla seems to be correcting up which I assume will either hit our black fib line or possibly back into our pitchfork lines which overlap with our fib lines making that resistance much more harder to break; please see drawing.
For me to continue with the bearish thesis I must see Tesla hold at one of those lines then punch down to the 174 price area to confirm our Weekly and Monthly vision.
Currently based on the data we are correcting up however stay tuned for our four analysis on the market
MB Trader

Tesla 12/10 MovePair : TESLA
Description :
After Corrective Waves " abc " it has Completed Impulsive Waves " 1234 ". Symmetrical Triangle as an Corrective Pattern in Short Time Frame. Impulse Correction Impulse with Divergence
Entry Precautions :
Wait Until it Breaks the Upper or Lower Trend Line and Retest

TSLA $TSLA #TSLA Tesla, Inc. Congratulations team members and all who have an entry point of $107-$114.42!
We have a decent cushion here to let the QUEEN run smores.
She can reach levels of $234.91 before this weeks end on the weaklies* expiration date
A safety net was built throughout the struggling trials and tribulations.
Current near term showing signs of pure glory potentially and convincingly BREAKING OUT. $219.35 $226.87. Stay safe out there.
CAUTION: The QUEEN is notorious for having superior volatility. About the highest BETA on the entire board of stocks available to trade or invest in.
PLEASE BE CAREFUL: THIS HORSE HAS NEVER BEEN BROKEN OR TAMED AND IS THE WILDEST RIDE ON WALL STREET
Short term trend looking to breakout above the $214.55 trigger line level
=stikstockitslive

TSLL | Tesla Bull ETF Oversold | LONGThe fund, under normal circumstances, invests at least 80% of its net assets (plus any borrowings for investment purposes) in the securities of TSLA and financial instruments, such as swap agreements and options, that provide leveraged exposure to TSLA. The fund is non-diversified.

TSLA 1H BUYTSLA 1H support is at ~$186
Enter 50% at the current price
and try to set some BUY orders near the support zone
If TSLA stays above the trendline,
the Take-Profit target would be 5%, 10%, and 15% from your entry
Cheers

Tesla: Up in Space 🚀Tesla is on the rise and imminently leaving the grey target zone between $196.68 and $156.80 behind to surpass the resistance line at $237.40 in order to finish the green wave . After completing that movement, we're expecting the course to drop below the $237.40-mark to complete green wave and regain momentum to ascent back North.

TSLA - SidewaysTSLA has room to move sideways as it maintains the dominant green uptrend line
It has been seen in past to move sideways like this
Similar price areas in green and red
Once price hits this dominant green trend line a strong buy is recommended

MIDIUM TERM TEASLA DIRECTIONAL BIAS BULLISHHEY GUYS
this is an update of the idea posted in 30 march in which I've successfully predicted last move this is the place I've been waiting for the market to come
and now I'm bullish
this is my general outlook on the market i am currently bullish on the stocks market and looking to buy the dips as far as i can see a retracement is due in both indexes and some profit taking so that happens this is my plan of attack keep in mind that this is an idea a plan in a uncertain chaotic environment out of multiple plans to be cirtainedif anything happens that changes the fundamentals of this idea, i will update.
please note that this is not financial advice. do your own research and use this information as conformational bias on top of your own analysis.
like for support!!!!

$TSLA - Bullish Channel BreakoutNew upward channel formed for the upside. RSI is oversold territory and Squeeze Mod tightening.

TESLA - Now we see when to buy...
The green areas are planned as an accumulation.
If it penetrates green zone we will have to exit the position.

tesla booming !!! goes up againtesla gets strong support.
what you guys think?
support from ema, support zone, and channel

TESLA going parabolic! TSLA is moving stronger than ever. The trend is strong and movement seems to be stable upwards. Big BUY for this stock in the medium term. What do you think? Share in the comments!

Tesla Going to ATH'sTon of people shorting Tesla at great support and huge bull pennant, I think the market is about to head up overall and Tesla will be one of those, Tesla to ATH's.

Tesla back again on investor's eyes Tesla entry on the pullback, stop loss should be on the previous low of H4 candle, my target on the top of the channel line.
thank you and trade safely.

