Is Tesla Setting Up for a Rebound? Key Entry Levels Inside🎯 TSLA: The "Thief Strategy" Playbook | Swing/Day Trade Setup 📈
🔥 Quick Overview
Asset: Tesla, Inc. (TSLA)
Bias: 🐂 BULLISH
Strategy Type: Thief Layering Entry Method
Risk Level: Medium-High (Swing/Day Trade)
💰 The "Thief" Entry Strategy Explained
The "Thief Strategy" uses multiple limit orders (layering method) to accumulate position at different price levels. Think of it like setting traps at various floors of a building—you catch opportunities wherever price decides to visit! 🎣
📊 Entry Zones (Layer Your Orders):
Layer 1: $430.00
Layer 2: $435.00
Layer 3: $440.00
💡 You can add more layers based on your own risk appetite and account size. The beauty of layering? You average your entry and reduce timing risk!
🛡️ Stop Loss (SL):
Thief SL: $415.00
⚠️ Important Note: This is MY stop loss level based on the Thief Strategy framework. You're the captain of your own ship! 🚢 Adjust your SL based on YOUR risk tolerance and account management rules. Trade at your own risk—make money, take money, manage wisely!
🎯 Target (TP):
Primary Target: $490.00
🚨 Why $490? This zone represents a confluence of:
Strong resistance area
Potential overbought conditions
Historical trap zone where bulls get exhausted
📢 Thief OG's Reminder: I'm NOT saying you MUST take profit only at my TP level. If you see profits that make you smile, SECURE THEM! 💵 The market gives, and the market takes. Be greedy when you can, be smart always.
🔍 Technical Analysis Breakdown
Tesla is showing bullish momentum structure with potential for continuation toward the $490 resistance zone. The layering strategy allows us to build position as price potentially dips into demand zones before the next leg up.
Key Technical Levels:
Support Zone: $430-$440 (Our entry layers)
Invalidation: Below $415 (Stop loss)
Resistance Target: $490
📌 Related Pairs to Watch (Correlation Play)
Understanding correlated assets helps confirm your thesis:
AMEX:SPY (S&P 500 ETF)
TSLA often moves with broader market sentiment
Watch SPY for overall risk-on/risk-off environment
NASDAQ:QQQ (Nasdaq 100 ETF)
Tech-heavy index where TSLA is a major component
Strong correlation with TSLA price action
NASDAQ:NVDA (NVIDIA)
Both are high-beta tech growth stocks
Often move together during risk appetite shifts
TVC:DXY (US Dollar Index)
Inverse correlation: Strong dollar = pressure on growth stocks like TSLA
Weak dollar = tailwind for equities
💡 Key Point: If SPY/QQQ are bullish + DXY weakening = Strong confirmation for TSLA upside!
⚡ Trading Tips for Thief OG's
Don't FOMO — Let price come to your layers
Manage position size — Each layer should be equal weight
Trail your stop — Once profitable, protect gains
Watch volume — Confirm breakouts with volume spikes
Stay flexible — Market conditions change; so should you!
🎬 Final Words
This setup is all about patience, precision, and profit extraction! 🎯 The Thief Strategy isn't about stealing from the market—it's about being SMART and setting yourself up for success with calculated entries.
Remember: The best trades are the ones where you're prepared, not scared! 😎
✨ If you find value in my analysis, a 👍 and 🚀 boost is much appreciated — it helps me share more setups with the community!
#TSLA #TeslaStock #SwingTrading #DayTrading #ThiefStrategy #LayeringStrategy #StockMarket #TradingIdeas #TechnicalAnalysis #BullishSetup #TradingStrategy #RiskManagement #StockTrading #MarketAnalysis #TradingCommunity
Teslatrading

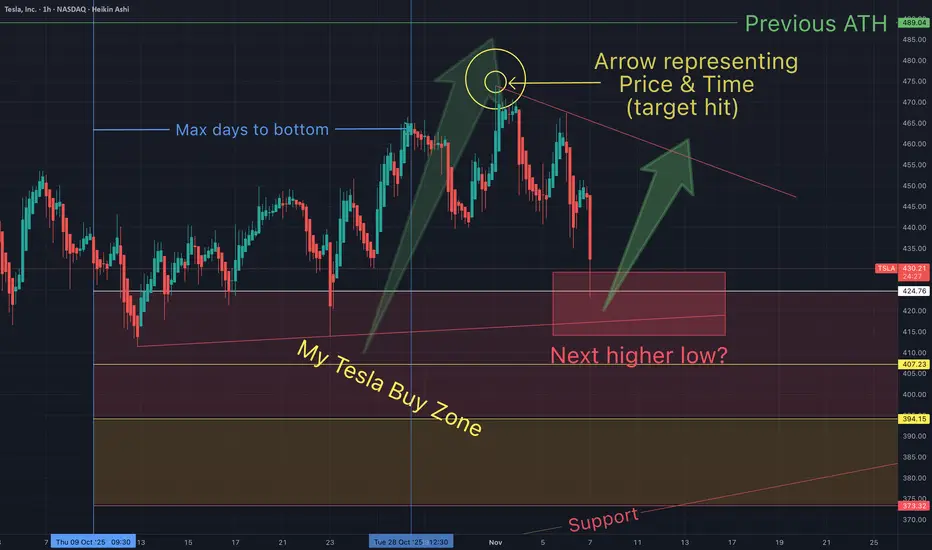
My Last Tesla post before ALL TIME HIGHOn Oct 21st I said I was adding to my positions (price at the time below):
Some of my target hit. We may even go lower.
What do you think?
Tesla & Palantir STILL following this fractal.On oct 7th I suggested that Tesla and Palantir were following the same fractal (on the daily & 15 min time frames). They are both still following the fractal, over a week later.
Repeating patterns are everywhere, once we know how tho spot them.
May the trends be with you.

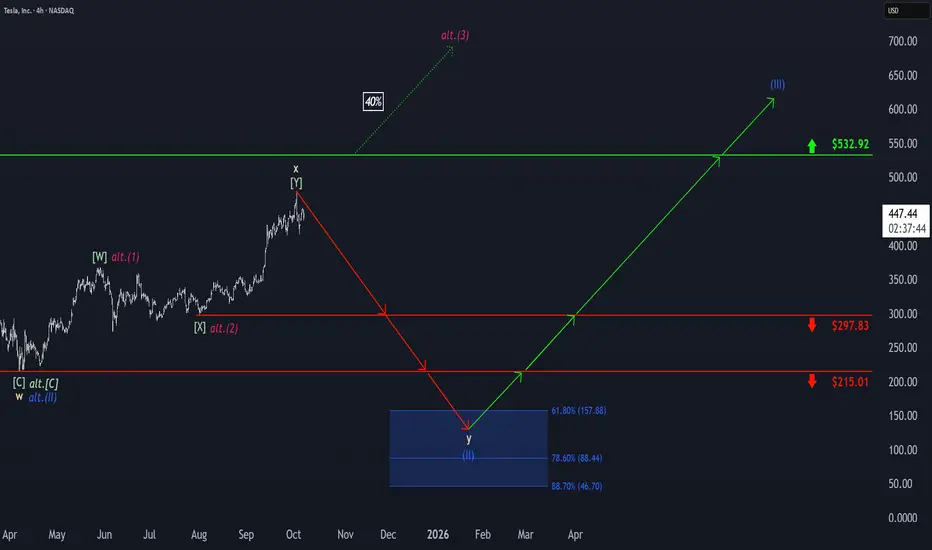
Tesla: Top Established!Tesla initially hit a new high before quickly reversing course with a notable move to the downside. As a result, we now view the corrective upward movement of beige wave x as complete and anticipate further sell-offs as part of wave y. The stock is expected to gradually break below the support levels at $297.83 and $215.01, ultimately reaching our blue Target Zone between $157.88 and $46.70, which we have identified for the final corrective low of blue wave (II). However, there remains a 40% chance that TSLA will not reach the blue zone at all but instead will break out directly above resistance at $532.92. In this case, we would consider blue wave alt.(II) already complete and locate the stock in a sustained (magenta) upward impulse. Even in our primary scenario, the new uptrend of the regular wave (III) is ultimately expected to surpass the $532.92 resistance.
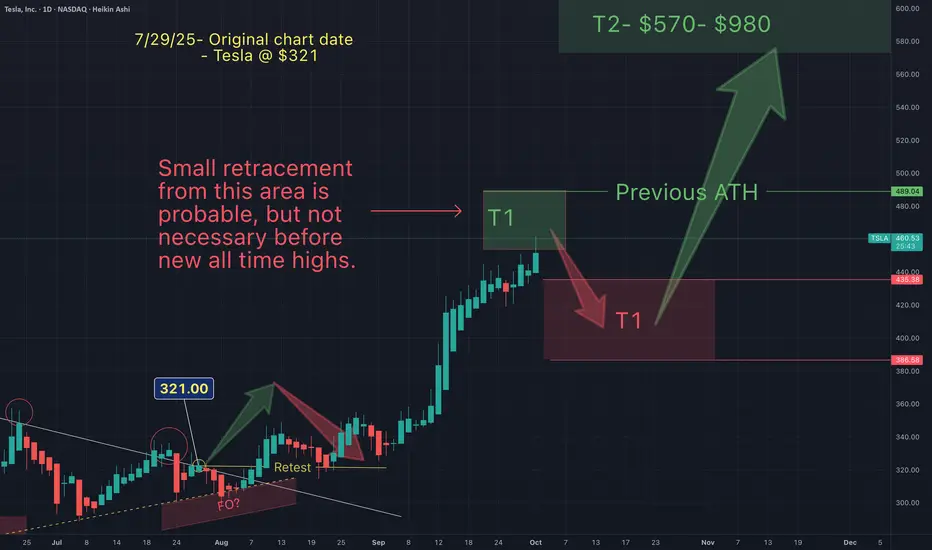
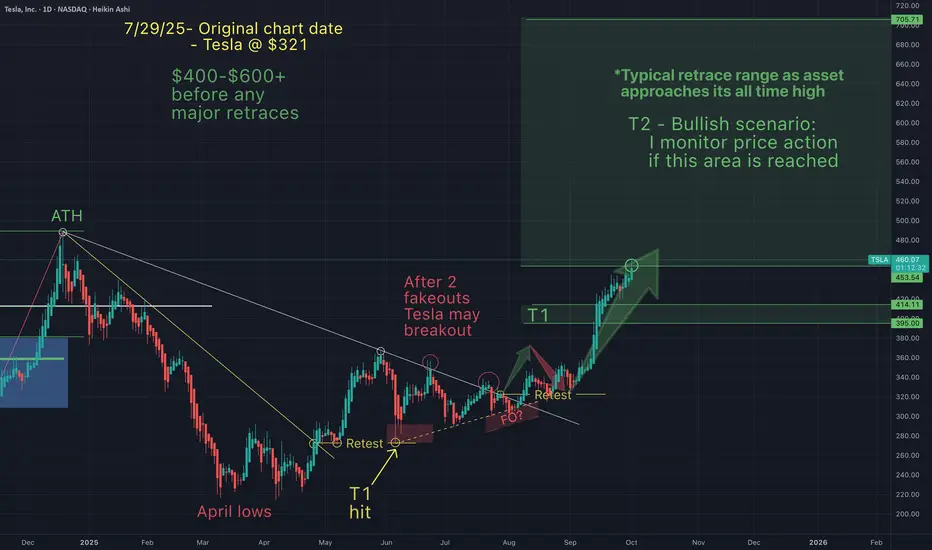
You will ask yourself "how did he know Tesla would do that"?On July 29th I suggested Telsa would follow a predicatble path. Price action has unfolded as anicipated every step of the way.
After a long run up, on Oct 1st I suggested that Tesla had topped at my green T1 and would retrace into my red support zone and bonce.
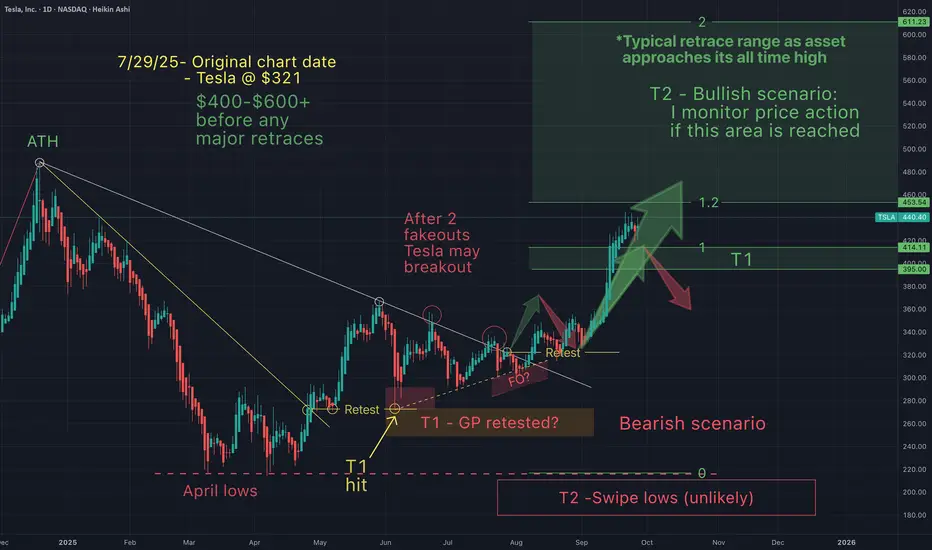
Now that this has played out, the only question that remains is Tesla going lower into my red T1...or simply all time highs from here?
Either way, Tesla may be about to melt faces (few & small retracements). For the next 2-10 weeks Tesla may form a blow off top (*"IF" Telsa continues this pattern). This blow off, will be the end of this bull pattern that I have been following since the April lows. Once Tesla hits my next range ($570-980) I expect a huge dump. I will monitor price action closely, once Tesla is in this next range.
May the trends be with you.
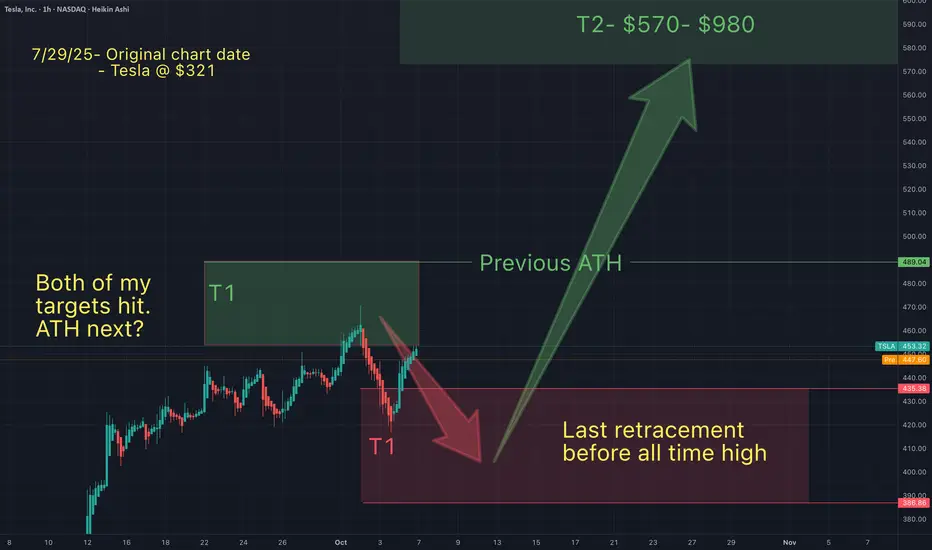
Telsa - NEW ALL TIME HIGHS INCOMING (price action simplified)Here's a simplified version of my short term targets. On July 29th Tesla was around $321 and I suggested that after a long downtrend, Tesla would breakout, retest and continue up ("without any major retraces)", to between $400-$600.
Tesla has now hit my T2 (currently $460) and I am anticipating a small retracement, before new all time highs in the near term.
Congrats to all of you who have made gains from my charts.
May the trends (continue) to be with you.
Tesla - NEW ALL TIME HIGH INCOMING (small pullback first?)On July 29th Tesla was around $320 and I suggested that after a long downtrend, Tesla would breakout, retest and continue up ("without any major retraces)", to between $400-$600.
Tesla has now hit my T2 (currently $460) and I am anticipating a small retest before new all time highs in the near term.
Congrats to all of you who have made gains from my charts.
May the trends (continue) to be with you.
You will ask yourself "how did he know Tesla would do that"?On July 29th Tesla was $321 and I suggested (after a breakout & retest) Tesla would pump straight to low $400s (without any retraces). Now that the trading week has closed here's an update:
Things are still going according to what I expected. But how is this possible...I don't have a crystal ball! How could I have predicted this even *before Elon claimed to have invested 1B into Tesla?
Did Elon know something that we didn't or did I know something you didn't?
Is it the "narative" or the ongoing, repeating, predicable chart patterns?
TA works!
Tesla - SHOW ME THE CHART AND I WILL TELL YOU THE NEWS!Back in June and July, Elon and Tesla were STILL getting a lot of bad press (Elon fighting with President Trump, people burning Tesla cars etc). Those that follow me may recall on July 29th I wrote the following:
"Tesla just needs a narrative shift (ie -new invention etc), & price action changes in a heart beat.
Yet, price action really has less to do with the news making Elon a hero, then a villain and then back and forth...but moreso to do with price action patterns that just keep repeating".
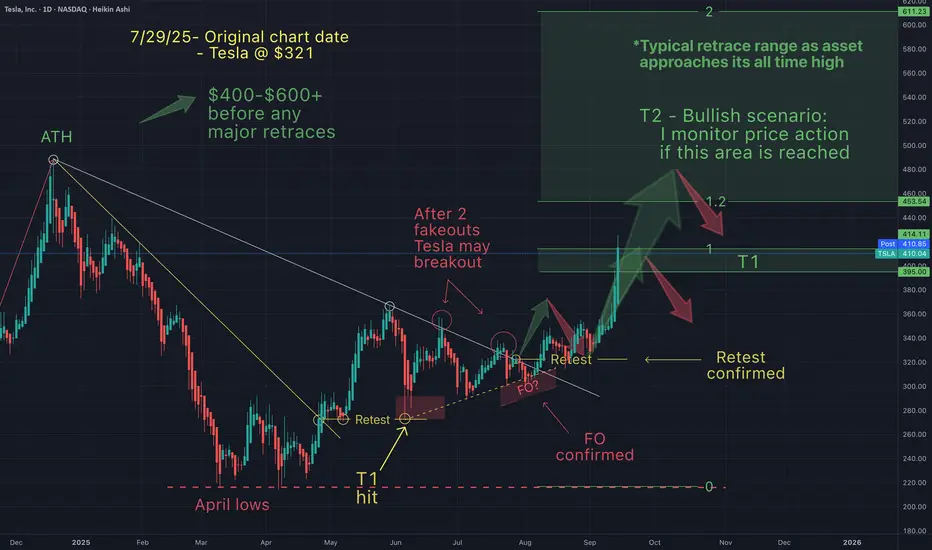
And you'll note that my July chart suggested that the huge pump to $400+ would begin around Sept 1st (Huge green arrow after the retest). What a coincidence that 2 weeks later Elon announces a $1Billion dollar Tesla stock buy (the new anticipated "narrative"). My huge green arrow was there many weeks before this "news". How could I have known?
SHOW ME THE CHART AND I WILL TELL YOU THE NEWS.
On July 29th Tesla was $321 and I suggested that Tesla was about to have a major breakout to at least $400 "with no major retraces". That target has now been hit. Is it because of the news or is it the patterns that just keep repeating?
My T1 targets are probable targets, so I anticipate them almost always getting hit. My ideal buy and sell targets are T2. Tesla now appears to be headed into my T2 target, so it's time to start monitoring price action closely.

You will ask yourself, "how did he know Tesla would do that"?On July 29th, I posted this chart suggesting that I anticipated a typical pattern to emerge. Things are going according to what I was expecting.
Congratulations to everyone who has been making some gains here based on everthing that was discussed in the charts.
The most important thing in my opinion is a trading strategy...and these strategies have made us incredible gains across the board.
Only question remains, will Tesla hit my T2. What do you think?
May the trends be with you.
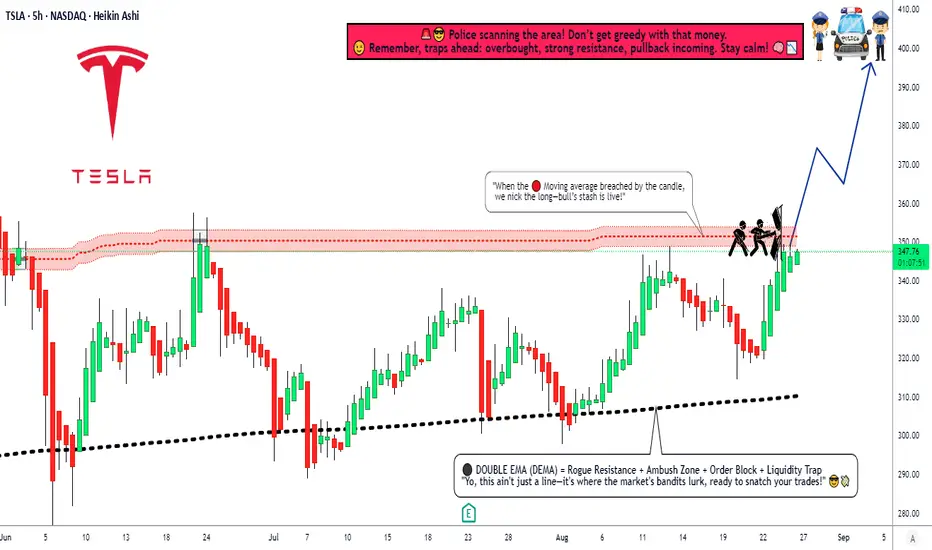
TSLA Breakout Play: Time to Steal Some Profits?🚨 TESLA INC (TSLA) HEIST PLAN - BULLISH SWING/Day LAYUP! 🚨
Yo, Thief OG's! 🐱👤🤑 Time to swarm the TSLA vault. The blueprint is set for a major bullish score. Our intel says the cops (bears) are losing their grip. Let's get this money! 💰💸✨
🎯 THE MASTER PLAN: BULLISH BREAKOUT (PENDING ORDERS)
Based on the Thief Trading Style™ technical analysis, we're plotting a bullish heist on TSLA. We wait for the breakout confirmation, then we strike with precision using our layered entry strategy.
Asset: TESLA INC (TSLA)
Trade Type: Swing / Day Trade
Bias: BULLISH ⬆️⚡
📍 ENTRY: THE HEIST INITIATES (SET YOUR ALARMS! ⏰)
Primary Entry: Breakout and close above $355.00 ⚡
THIEF'S LAYERED ENTRY STRATEGY: 🎯
Don't go all in at one price! We use multiple limit orders to layer into the position after the breakout confirms the move. This is how the pros (and thieves) do it!
Layer 1: Breakout Entry @ $355.00
Layer 2: Pullback Entry @ $350.00
Layer 3: Pullback Entry @ $345.00
Layer 4: Pullback Entry @ $340.00
Layer 5: Pullback Entry @ $335.00
(You can add more layers based on your own capital and risk appetite, you savage!)
📌 IMPORTANT: SET A TRADINGVIEW ALARM at $355.00! This is your signal that the heist is a GO! Don't get caught sleeping. 🛌💤
🛑 STOP LOSS: THE ESCAPE ROUTE
Thief SL for Breakout Entry: $320.00
⚠️ HEAR ME, HEAR ME! Dear Ladies & Gentleman (Thief OG's), adjust your SL based on your own strategy & risk! I am not your financial advisor; I'm just the guy with the blueprint. 🗺️ Place your SL ONLY AFTER the breakout happens. Protect your capital at all costs!
🎯 TARGET: CASH OUT & VANISH
Primary Target: $400.00 🚀
The police barricade is thick up there! 🚓🚧 Once the money is in the bag, don't get greedy! Escape with the stolen profits before they catch you!
Note: Dear Thief OG's, I am not recommending you use only my TP. Take profits at your own risk and based on your own analysis. Secure the bag when YOU feel comfortable! 💼🔥
💎 THIEF'S FINAL WORDS:
This is not a gamble; it's a calculated heist. Follow the plan, manage your risk, and let's eat! 🍽️
Hit the LIKE button if you're riding with us! ✅
BOOST this idea to empower the thief community! 💪❤️
Follow for more daily heist plans! 🎯
Stay sharp, stay profitable, and remember... in the market, be a thief, not a victim! 🐱💻🚀
NASDAQ:TSLA #TradingView #StockMarket #TradingPlan #SwingTrading #DayTrading #Investing #Bullish #TESLA #ThiefTradingStyle
Tesla Shares (TSLA) Drop Following Earnings ReportTesla Shares (TSLA) Drop Following Earnings Report
Yesterday, after the close of the main trading session on the stock market, Tesla released its quarterly earnings report. While both earnings per share (EPS) and gross profit slightly exceeded analysts’ expectations, the results reflected a negative trend driven by declining sales. This decline is being influenced by intensifying competition from Chinese EV manufacturers as well as Elon Musk’s political activity.
According to Elon Musk:
→ The company is facing “a few tough quarters” due to the withdrawal of electric vehicle incentives in the US;
→ The more affordable Tesla model (mass production expected in the second half of 2025) will resemble the Model Y;
→ By the end of next year, Tesla's financials should become "highly compelling".
Tesla’s share price (TSLA) fell by approximately 4.5% in after-hours trading, clearly reflecting the market’s reaction to the report. Today, the stock is likely to open around the $317 level, down from over $330 just the day before.
Technical Analysis of TSLA Stock Chart
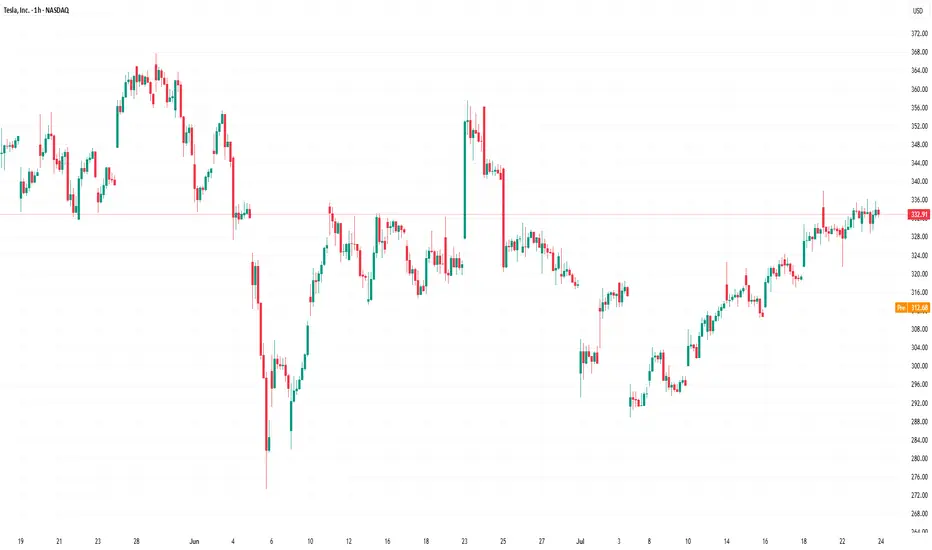
In our analysis of TSLA charts dated 2 July and 8 July, we outlined a scenario in which the stock price could form a broad contracting triangle, with its axis around the $317 level.
The new candlesticks that have appeared on the chart since then have reinforced the relevance of this triangle, as the price rebounded from the lower boundary (as indicated by the arrow) and headed towards the upper boundary. However, yesterday’s earnings report disrupted this upward move.
Thus, while the broader stock market is trending higher (with the S&P 500 reaching a historic high yesterday), TSLA may remain "stuck" in a consolidation phase, fluctuating around the $317 level—at least until new fundamental drivers shift market sentiment.
This article represents the opinion of the Companies operating under the FXOpen brand only. It is not to be construed as an offer, solicitation, or recommendation with respect to products and services provided by the Companies operating under the FXOpen brand, nor is it to be considered financial advice.
Musk-Trump Feud Sends Tesla (TSLA) Shares DownRenewed Feud Between Musk and Trump Drags Tesla (TSLA) Share Price Lower
The US Senate yesterday narrowly approved Trump’s so-called “big, beautiful budget bill.”
Elon Musk, who had previously criticised the bill for potentially adding $3.3 trillion to the national debt, warned that Republican lawmakers who supported it would face political consequences. In a post on X, Musk wrote:
“Every member of Congress who campaigned on reducing government spending and then immediately voted for the biggest debt increase in history should hang their head in shame! And they will lose their primary next year if it is the last thing I do on this Earth.”
He also reiterated his intention to establish a third political force under the name “America Party.”
In response, President Trump issued sharp threats:
→ to apply federal pressure on Musk’s companies by revisiting existing subsidies and government contracts (estimated by The Washington Post at $38 billion);
→ to deport Musk back to South Africa.
The market responded immediately to this renewed escalation in the Trump–Musk conflict. Tesla (TSLA) shares fell by over 5% yesterday, forming a significant bearish gap.
Technical Analysis of TSLA Stock Chart
Eight days ago, we analysed the TSLA price chart, continuing to observe price action within the context of an ascending channel (indicated in blue). At that point:
→ In mid-June, when the initial Musk–Trump tensions surfaced, TSLA managed to hold within the channel. However, as of yesterday, the price broke below the lower boundary, casting doubt on the sustainability of the uptrend that had been in place since March–April;
→ The price breached the lower channel limit near the $315 level — a zone that previously acted as support. This suggests that $315 may now serve as a resistance level.
As a result, optimism related to the late-June launch of Tesla’s robotaxi initiative has been eclipsed by concerns that the Musk–Trump confrontation may have broader implications.
If the former allies refrain from further escalation, TSLA may consolidate into a broadening contracting triangle (its upper boundary marked in red) in the near term, ahead of Tesla’s Q2 earnings release scheduled for 29 July.
This article represents the opinion of the Companies operating under the FXOpen brand only. It is not to be construed as an offer, solicitation, or recommendation with respect to products and services provided by the Companies operating under the FXOpen brand, nor is it to be considered financial advice.

Musk Steps Away from Politics: What Does It Mean for Tesla?Musk Steps Away from Politics: What Does It Mean for Tesla (TSLA) Stock?
Yesterday, it was announced that Elon Musk will be stepping down from the Trump administration as his term as head of DOGE—where he focused on reducing government spending—has come to an end.
This decision follows his statement at the economic forum in Qatar, where Musk said he plans to focus less on politics, as he feels he has already done enough in that realm.
What Does This Mean for Tesla (TSLA) Stock?
Musk’s move away from politics is likely a positive signal for investors. Here's why:
→ The company’s CEO can now devote more time to addressing issues such as declining vehicle sales in Europe;
→ Musk’s role at DOGE will no longer pose reputational risks for Tesla..
During yesterday’s main trading session, TSLA stock surged to $367—its highest level since mid-February.
Technical Analysis of TSLA Stock Chart
The price continues to hover near the upper boundary of an ascending channel (marked in blue), which could pose a challenge for further upward movement.
Additionally, the price has entered the $355–$375 range—a zone that previously triggered significant reversals (as indicated by arrows). Notably, there was a sharp decline from this zone between February 21–26. From a bearish standpoint, this area could act as resistance, and the candle’s close near its low yesterday supports this view.
From a bullish perspective, the fundamental outlook may still provide upward momentum:
→ A joint press conference with Trump and Musk is scheduled for today;
→ In early June, Tesla is expected to begin testing its autonomous taxis.
So, while a continued uptrend is possible, a short-term correction would seem reasonable after TSLA’s nearly 27% surge throughout May.
This article represents the opinion of the Companies operating under the FXOpen brand only. It is not to be construed as an offer, solicitation, or recommendation with respect to products and services provided by the Companies operating under the FXOpen brand, nor is it to be considered financial advice.

TESLA: Can it worth $4,000 a share buy end of 2026?Tesla is bullish on its 1D technical outlook (RSI = 65.527, MACD = 22.160, ADX = 43.922, being on a bullish wave to recover the ATH. Since the 2019 low the prevailing long term pattern is a Channel Up and the recent Feb-March correction resembles COVID's in March 2020. If that's the case then the stock is on a powerful long term bullish wave that can reach the 4.5 Fibonacci extension before the 5.0 time Fib. This implies that TSLA price per share can be $4,000 by the end of 2026. Do you think that's realistic?
See how our prior idea has worked out:
## If you like our free content follow our profile to get more daily ideas. ##
## Comments and likes are greatly appreciated. ##

Tesla is Going to 303 + Looks like Tesla is going to 303 or possibly higher
Kris/Mindbloome Exchange
Trade Smarter Live Better

TSLA at Key Resistance—Breakout or Rejection?Hi Traders! 🚀 TSLA is approaching a key resistance zone—will it break out or face rejection?
🔹 Scenarios:
📈 Buy if it breaks above $284, with a stop loss at $275 and targets at $290 and $320.
📉 Sell if it rejects $284 and falls below $270, with a stop loss at $280 and targets at $260 and $230.
📊 RSI is recovering from oversold territory—momentum could push prices higher! Keep an eye on the price action.
📢 Watch out for earnings reports and macro news! These could add volatility.
🔥 Smash that like button and show some energy! Let’s trade like pros! 🚀
⚠️ Disclaimer: This analysis is for educational purposes only and does not constitute financial advice. Trade at your own risk.

TESLA: Oversold but correction my not be over yet.Tesla is oversold on its 1D technical outlook (RSI = 25.606, MACD = -36.970, ADX = 56.250) but the correction may not be over. The brutal bearish wave since the December 18th 2024 ATH may technicall bottom on the HL trendline, despite having breached the 0.618 Fibonacci yesterday. That is because the April 22nd 2024 bottom was also priced below the 0.618 Fib, even under the S1 Zone. In order to buy confidently again for the long term, we need to see the 1D RSI forming HL again. We expect to see TESLA within the 200 - 190 range before a rebound takes place and then our long term target would be near the HH trendline, TP = 650.
## If you like our free content follow our profile to get more daily ideas. ##
## Comments and likes are greatly appreciated. ##

TESLA: The best buy entry is here. $600 long term.Tesla is bearish on its 1D technical outlook (RSI = 37.443, MACD = -16.180, ADX = 38.976) as it is expanding the bearish wave of the Channel Up, under the 1D MA50. As the 1D RSI rebounded at 30.000 and the 1D MACD is close to a BUllish Cross, we see a striking resemblance with the lows of August 5th 2024 and April 22nd 2024. With the help of the 1D MA100, we expect the price to start making a slow recovery. Go long on this bullish wave, TP = 600.
## If you like our free content follow our profile to get more daily ideas. ##
## Comments and likes are greatly appreciated. ##

Tesla in next few dayshello traders i think tesla path in next few days be like this base on price action I read. and it have to decide where its going to continuing up or down. we should wait and see i think odds will be in favor of down trend after that but till then we should do no thing. myself as day trader will trade by risking 2% of my account base on this idea till it rech my destination and then decide to risk more or not.

TESLA: Bullish reversal starting towards $480.Tesla is about to turn neutral again on the 1D technical outlook (RSI = 44.564, MACD = 2.800, ADX = 35.697) in an attempt to recover the 1D MA50 that it lost yesterday. The pattern since the ATH correction started looks a lot like July-September 2024, where a Channel Down made the necessary technical correction of the June rally and then a subsequent Channel Up recovered the losses all the way to almost the R1 level. With Tesla having corrected by almost -25%, it is worth going long now and aim for the R1 again (TP = 480.00).
## If you like our free content follow our profile to get more daily ideas. ##
## Comments and likes are greatly appreciated. ##

TESLA: Can it reach $500?Tesla is overbought both on its 1D (RSI = 76.375, MACD = 28.880, ADX = 43.174) and 1W (RSI = 76.043) technical outlooks. This however isn't by any means a bearish sign, at least not on the long term. Tesla appears to be aiming for $500 in the immediate future and in our view even higher on the long term. The reason is the convincing 1W Golden Cross that is about to be formed and the last time we had such a clear Cross was on January 21st 2020.
The stock was ona bullish breakout after a Channel Down correction. The breakout initiated a rally that was supported by the 1W MA50 all the way until the November 2021 Top on the 4.5 Fibonacci extension! Tesla's 2025 target shouldn't be $500 but instead the 2.0 Fibonacci extension at $640. As long as the 1W MA50 supports, we will stay long term bullish towards that target (TP = 640.00).
See how our prior idea has worked out:
## If you like our free content follow our profile to get more daily ideas. ##
## Comments and likes are greatly appreciated. ##

TESLA: Hit the July 2023. Doesn't look it will stop before $400.Tesla is approaching the overbought state on its 1D technical outlook (RSI = 68.976, MACD = 8.690, ADX = 38.748) but the 1W chart still on healthy enough levels (RSI = 63.761) to keep fuelling the uptrend despite today's enormous +15% rise approximately. The reason is that the double testing and hold of the 1W MA50 in October kickstarted Phase 2 of the bullish wave of the 2 year Channel Up. That can keep rising until the 1W RSI is well overbought. The first bullish wave completed a +194.25% rise at the top of the Channel Up, so there is no reason to expect otherwise on the current wave also. That is our long term target (TP = $400).
See how our prior idea has worked out:
## If you like our free content follow our profile to get more daily ideas. ##
## Comments and likes are greatly appreciated. ##
