XTZ: Historical Support#XTZ has been a leading old coin few years ago. After a long decline from its late 2021 top, it continues to hold above a key historical support level.
As long as it stays above the $0.317 stop-loss, a strong bullish comeback remains possible.
#Tezos
Tezos

XTZ Secondary Trend. Channel. Wedge. Capitulation Zone. 07 05 20Logarithm. Time frame 1 week (less is not necessary).
The secondary trend has formed a horizontal channel for several years, with repeating wedge-shaped formations, the third time we entered under the support of this channel not by squeezes to collect long stop-loss, but by full candles and the structure of a descending wedge. It looks more vertical. The corrective movement to this semi-vertical wedge, quite possibly, will similarly have an aggressive character. The wedge is almost in the final phase of its formation. I showed percentages for clarity to the key reversal zones, for orientation for your money management and setting the first medium-term, and possibly local targets.
The main trend of this previously hyped cryptocurrency since 2017
XTZ/USD Main Trend. Descending Channel 01 2023

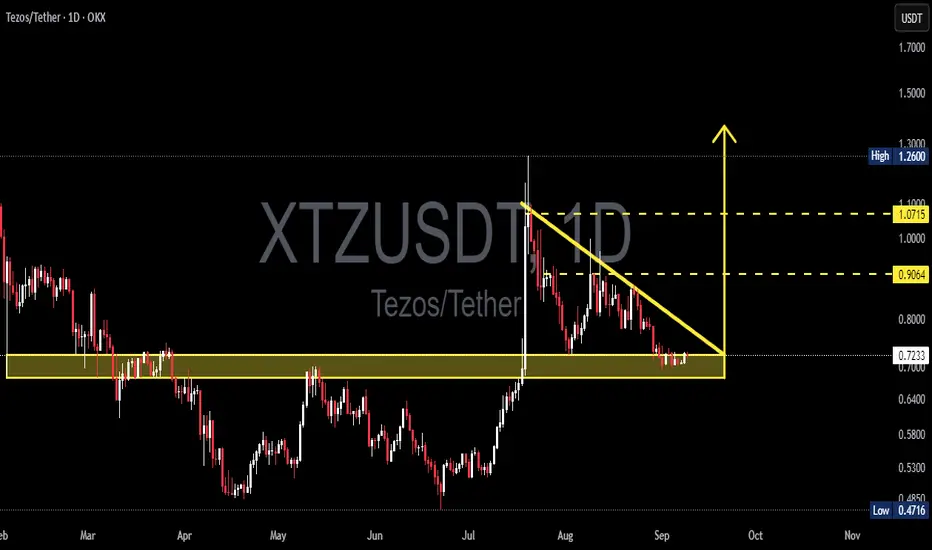
XTZ/USDT — Descending Triangle at a Critical Zone!Tezos (XTZ/USDT) is currently trading at a decision point. The chart shows a clear Descending Triangle pattern formed since late August, with price consolidating right above the major support zone at 0.64 – 0.74 USDT.
This structure is generally considered bearish, as consistent lower highs indicate selling pressure against a static demand zone. However, a confirmed breakout above the downtrend line could flip the pattern into a bullish reversal trigger.
---
🔑 Key Levels
Current Price: 0.7234 USDT
Major Support Zone: 0.64 – 0.74 USDT
Dynamic Resistance (downtrend line): ~0.78 – 0.82 USDT
Bullish Targets: 0.9064 → 1.0715 → 1.2600 USDT
Bearish Targets: 0.4716 (previous low), with a potential measured move down to ~0.37 USDT
---
🐂 Bullish Scenario (Reversal Potential)
Breakout above 0.78 – 0.82 with strong volume confirmation signals a bullish reversal.
First upside target at 0.9064, then 1.0715, and potentially 1.2600 if momentum continues.
Strategy: Buy on breakout or take aggressive entries near support with tight stops below 0.64.
Reward-to-Risk (R:R) ratio ≈ 2:1 if targeting 0.90.
---
🐻 Bearish Scenario (Breakdown Risk)
Breakdown below 0.64 – 0.70 with strong volume would confirm the descending triangle as bearish.
Downside targets: 0.4716 (structural support) and potentially 0.37 USDT (measured move).
Strategy: Short/hedge after confirmed breakdown and failed retest.
Potential R:R > 2.4:1 toward 0.37.
---
📌 Pattern Context
The Descending Triangle reflects market indecision: persistent sellers vs. defending buyers.
Such setups often end with a strong move, making this area a crucial inflection zone.
Volume will be the key confirmation factor — without it, false breakouts are highly likely.
XTZ is essentially in a “wait-and-see” equilibrium before its next decisive trend.
---
⚖️ Conclusion
XTZ is standing at a major turning point:
Bullish case: breakout could lift price toward 0.90 – 1.07.
Bearish case: breakdown may trigger a drop to 0.47 – 0.37.
Traders should wait for a daily close + volume confirmation before committing. This is a high-opportunity setup once direction is confirmed.
---
#XTZ #Tezos #XTZUSDT #Crypto #Altcoins #TechnicalAnalysis #PriceAction #ChartPatterns #SwingTrading

Is #XTZ Ready For a Major Breakout or Another Trap Ahead?Yello Paradisers! Are you prepared for what might be one of the sneakiest reversals brewing quietly on #XTZUSDT? Let's see the current setup of #Tezos:
💎#XTZ is trying to break out of a descending broadening wedge formation, a setup that typically signals the end of a corrective structure and the potential beginning of a major impulsive move. We’re likely witnessing the very first wave of this new impulse, and what happens next will depend entirely on how the price reacts to the overhead dynamic resistance.
💎The 1st impulsive wave appears to be nearing completion, and based on structure and current momentum, a minor pullback is both expected and healthy. This retracement will likely serve as a reset before the next leg higher begins, offering a potential entry for those who missed the breakout. However, we do not expect this correction to break below the origin of the first wave — doing so would undermine the integrity of the new trend.
💎Currently, the #XTZUSD is facing strong resistance from the EMA, which it must convincingly break and reclaim. This EMA level has repeatedly acted as a lid on price action, and until it’s cleared, any upside move remains tentative. However, if buyers step in with real volume, we could see a rapid acceleration toward the mid-term resistance at $0.916. That level has historically marked a shift in market control. And beyond it, the next major resistance lies at $1.134, a key supply zone that could trigger heavy distribution.
💎On the downside, the structure remains clean. The $0.491 – $0.516 zone is now our major support, and it must hold. If the price falls below this support and closes with weakness, it will invalidate the current bullish thesis and likely lead to a deeper correction.
Play it safe, respect the structure, and let the market come to you!
MyCryptoParadise
iFeel the success🌴

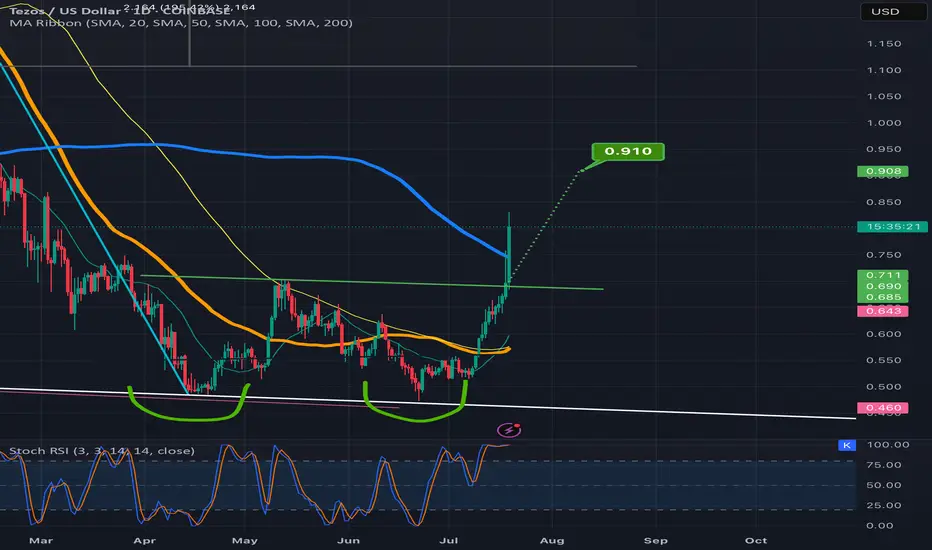
Tezos (XTZBTC) Ultra-Bullish · Short-Term Growth PossibleHere you have an ultra-bullish chart. The trend reversal is already confirmed and we have a higher low in place. That is, we have the initial bullish breakout after the early July low. This bullish move produced a retrace and the retrace ended as a higher low. As the higher low also reached its end, the next move is the continuation of the initial bullish breakout, the resumption of the bullish trend.
This chart is ultra-bullish. The signals are already confirmed and the action is already happening since early last month. Since we have a true bottom and years of sustained bearish action, we can expect the reverse now to unravel, an uptrend. Higher highs and higher lows.
Tezos vs Bitcoin (XTZBTC) looks great and it seems this pair is ready to start its third wave. A third wave tends to be super strong, huge momentum and volume ending in a major high. A multiple years strong high. And yet, this would not be the end. After wave three we get wave four, which is a correction and then one more final wave, the fifth wave.
Everything is good and the market looks great. Tezos is preparing to grow, a bullish continuation next. Crypto is going up. Bitcoin will also grow. We are approaching the 2025 bull market bull run phase.
Namaste.

TezosXTZ usdt daily analysis
Time frame 4hourls
Risk rewards ratio >4
Target 1.124$
LS is very tight
If my analysis failed l will lost a few but if it reaches my target good benefit
Linear Tezos · 2,000% 2025 Bull MarketThe same support zone from 2019, pre-massive 2021 bull market, is being activated ultra long-term, since November 2022. That is, XTZUSDT (Tezos) has been trading at bottom prices for almost three years.
Just a month within the current price range managed to support a 1,111%+ bull market, one that lasted 714 days. Who is to say that the next bull market will only last 2 months? I saw one of the top authors here saying that everything would end after just 1-2 months. Why not 2-3 years?
So Tezos grew for 714 days, higher highs and higher lows, a classic uptrend. Then it entered a bear market and went down for more than a year. So years going up and more than a year going down. And then the market went sideways for almost three years. Notice how everything last years. One year or more.
This chart and much more I've been seeing is letting me believe that we are set to experience an ultra, unusual, splendid, unique and long lasting bull market. It will be different. It will be the same in the sense that it happens every 4 years and we have massive marketwide growth. It will be different because some pairs will grow for months while others will continue to grow non-stop for a decade or more. Some pairs will grow for 2 years and then crash while others will grow 3 or 4. It is a mixed bag. It is a big market and it continues to evolve. This is awesome news, don't get it confused. This is the best possible news ever. We are used to fast and this gives little time for adaptation. Market conditions are different now. You will have all the time you need to become rich. The bull market is being turned on and it will never be turned off again, at least not for our generation.
Thank you for reading.
Tezos is going up long-term. Massive growth.
Namaste.

Tezos heading for a double bottom breakout targetPrice action is well above the neckline and already over halfway to the target. *not financial advice*
XTZ/USD Main trend. Downward channelLogarithm. Time frame 1 week. Main trend.
Idea for understanding the local work zone for traders in the main trend. It will also be useful for investors to understand the cheap/expensive zones for investing.
Linear price chart.
Secondary trend. Downward channel. Area to work. Time frame 3 days.
XTZ/USD Secondary trend. Downward channel.

Tezos: Your Altcoin Choice (S4)Tezos looks so ready to start on a new journey. Let's go with the basics first.
The last bullish wave was corrected by more than 100% and immediately the action recovers the early August 2024 low. Which was the lowest point hit after the 2022 bear market.
Since December 2022, XTZUSDT has been moving sideways within a long range. This is a classic consolidation period. This period is reaching its end and Tezos looks ready to start a new journey, the 2025 bull market.
First we have a long-term downtrend followed by long-term sideways, all that is missing in this chart is a long-term uptrend. This is what follows.
As the All-Time Low was hit in mid-April, trading volume goes really low. In fact, the entire correction between December 2024 and present day has very low bearish volume. Not a bear market but a necessary correction based on marketwide action and the broader market cycle. Now that this correction is over we can expect to see some change.
Since there is no bear volume on the drop we can assume the bears have no strength and weak bears is another signal that supports the bulls taking control of the market. In short, Tezos is about to grow.
I am giving you mainly three targets on the chart and all three are very easy targets. Tezos will cut through those. You can aim higher of course, but this is the minimum in the upcoming bullish cycle.
Thanks a lot for your continued support.
Namaste.

TradeCityPro | XTZ: Assessing Tezos' Layer 1 Market Dynamics👋 Welcome to TradeCityPro!
In this analysis, I want to review XTZ for you. This coin is one of the layer 1 cryptos with a market cap of $714 million, ranking 78th on Coin Market Cap.
📅 Daily Timeframe
We are observing a downward trend that began after breaking $1.2 and has continued without any significant corrections.
✨ Currently, the price has broken the support at $0.711 and could move towards its main floor at $0.593. If the price pulls back to $0.711, we can enter a short position targeting $0.593 in lower timeframes.
📉 For the main short position, the primary trigger is $0.593. If this area breaks, we can confirm a major trend change in this coin. Entry into the Oversell zone by the RSI can induce panic and a strong downward momentum in the market, increasing the likelihood of breaking $0.593.
🔼 For a long position and a bullish trend change, we must first wait for the RSI to rise above the 50 area to eliminate the downward momentum and capture the first sign of trend confirmation. For main confirmation, we must wait for the price to create a new bullish structure.
💥 If the upward movement is sharp, the first trigger we have is the break of $0.854. We can also confirm this with Dow theory.
🛒 For buying, the main trigger is $1.793, which is the main peak, and riskier triggers include $0.854, $1.045, and $1.2.
📝 Final Thoughts
This analysis reflects our opinions and is not financial advice.
Share your thoughts in the comments, and don’t forget to share this analysis with your friends! ❤️

The Bullish Case of XTZ#Tezos recently passed $1.594, presenting a bullish idea with the potential to target a new all-time high in the long run.
As long as the price holds above $0.578 (the stop-loss), further bullish momentum is anticipated.

XTZ TEZOS SeekingPips says "Let Price Come To You" XTZUSDTezos Price LEVELS Identified.
Once again "HURRY UP AND WAIT"
⚠️ Subscribe To 🟢SeekingPips🟢 here on TradingView & get our latest CHART ANALYSIS FIRST

XTZ Tezos 7x? SeekingPips First Look! TIME & PRICE MEET?ℹ️As noted in the title Tezos XTZ is NOT something SeekingPips has had on his RADAR BUT....
You know by now that for 🟢SeekingPips🟢 PRICE is ALWAYS SECOND to TIME.
Our TIME FILTER BELLS are ringing HARD VERY HARD.
✅️Those of you who have been around SeekingPips for sometime KNOW WELL that I care not about any news or fundermental analysis, we are strictly MATH based TIME TRADERS in here so when the stars align and our TIME filters TRIGGER we sit up.
✅️You will know too that when 🟢SeekingPips🟢 decides to use a TRENDLINE that SeekingPips SEES SOMETHING COOKING.
✅️Also I just want to remind you that we only LONG CRYPTO. Any selling we do is strictly to bank something. Therefore the majority of our CRYPTO CHARTS will have a BULLISH BIAS.
⚠️However it DOES NOT MEAN that we necessarily have a valid trigger to enter the market at that moment a chart is shared.
⭐️We have our alerts ready and very clear key levels on the chart NOW WE SIT & WAIT and see how the LOWER TIMEFRAMES STRUCTURE develops around our TRENDLINE TO START.⭐️
No doubt we will have more to talk on this in the NEAR FUTURE.
✅️ SUBSCRIBE TO SeekingPips NOW SO YOU GET OUR ANALYSIS FIRST✅️

Tezos (XTZ)🚀 Comprehensive Analysis of Tezos (XTZ/USDT)
🌟 Introduction to Tezos (XTZ):
Tezos is a next-generation blockchain platform focusing on smart contracts and decentralized governance.
What makes Tezos stand out is its ability to upgrade its blockchain without requiring a hard fork, making it highly appealing to developers and investors alike.
📌 Key Use Cases of Tezos:
1️⃣ Smart Contracts: Similar to Ethereum but with lower fees and enhanced security.
2️⃣ NFTs and DeFi: A preferred platform for NFT artists and decentralized finance projects.
3️⃣ High Scalability: Employs Proof of Stake (PoS) for energy efficiency and faster transactions.
✨ Thanks to its technical features and advanced governance, Tezos has become a favorite for long-term investors.
📊 Technical Analysis:
🔹 Price Pattern:
Currently, XTZ is trading within an Expanding Triangle on the weekly timeframe.
After testing the upper resistance line of the triangle, the price has entered a short-term correction and reached a weekly support zone (gray zone: $1.118 - $1.246).
💡 Key Characteristics of the Pattern:
In expanding triangles, a breakout in either direction often leads to significant price movements.
If buyers weaken, the price could fall further to the triangle’s lower boundary and the yellow support zone ($0.574 - $0.646).
📈 Bullish Scenario:
If XTZ manages to:
1️⃣ Break through the red resistance zone ($1.767 - $1.989) with strong momentum and volume, and
2️⃣ Penetrate above the triangle,
We can expect a move toward the following Fibonacci targets:
1.618: $2.426 - $2.920
2.272: $3.967 - $4.654
2.618: $5.782 - $6.486
📌 Confirmation Signals for an Uptrend:
Increasing volume during the breakout.
RSI entering the overbought zone, indicating strong upward momentum.
📉 Bearish Scenario:
If the gray support zone fails to hold:
The price may drop to the lower boundary of the triangle and the yellow support zone ($0.574 - $0.646).
This area could serve as a potential entry point for strong buyers.
🔑 Key Notes for Traders:
Pay close attention to price action around critical levels like the red resistance zone and the triangle boundaries.
📌 Decision Points:
1️⃣ Red Zone ($1.767 - $1.989): A breakout here confirms an upward move.
2️⃣ Yellow Zone ($0.574 - $0.646): Buyer reactions in this zone will reveal their strength.
Risk Management and emotional control are crucial to avoid impulsive entries.
🎯 Conclusion:
XTZ is at a critical technical juncture. The breakout from the triangle or key levels will determine its next direction.
Potential Scenarios:
🔺 A breakout above the red zone could lead to Fibonacci targets.
🔻 A breakdown to the yellow support zone may attract strong buyers.


Tezos XTZ price “finally” shoot outOldies here?) Do you remember that there was such a coin as #XTZ ?)
Yes - yes - this is the “stick” that shoots once a year and falls 3y)
It's hard to believe that the current growth of the OKX:XTZUSDT price will be above $1.58-1.78
Therefore, this idea will probably be more interesting for #Tezos holders
Although.... maybe we don't know something about the bright future of this project ?)
_____________________
Did you like our analysis? Leave a comment, like, and follow to get more

Tezos ( XTZ )Xtz usdt Daily analysis
Time frame daily
Risk rewards ratio >3.5 👈👌
I have another xtz usdt analysis ( hourly) in next page.

XTZUSDT (Tezos) Updated till 30-11-24XTZUSDT (Tezos) Daily timeframe range. PA moving very nicely till now and lots of space to cover. it got potential if we can get a valid close above 1.860. valid close can push it through further by clearing out stuck positions. recent support at 1.204.

XTZUSD - Bull RunAlthough a large down channel can be plotted an overarching W pattern can be observed with highs at the dashed white line
Right now XTZ is moving from a bear market into a bull one
I see a pump up to about ~$8
The vertical lines show the point where the shift from bear to bull occurs
Daily chart

Tezos | Triple Bottom PumpI've seen the future, the future is Tezos. You either be with or be without.

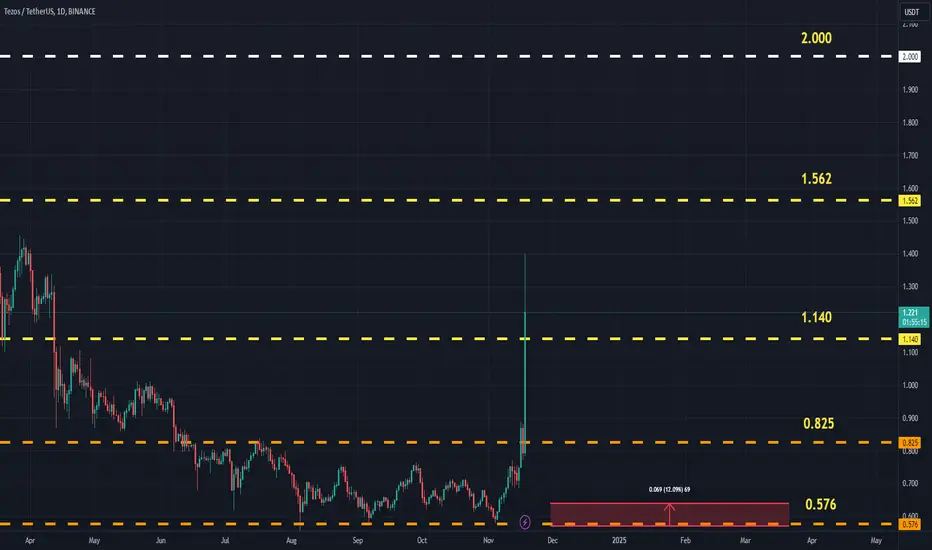
XTZUSDT (Tezos) Updated till 18-11-24XTZUSDT (Tezos) Daily timeframe range. we can see a really nice push today from its consolidation zone. now it needs a clean close over 1.140. if sellers dont over come 1.562 is not hard to reach. recent support at 0.825.