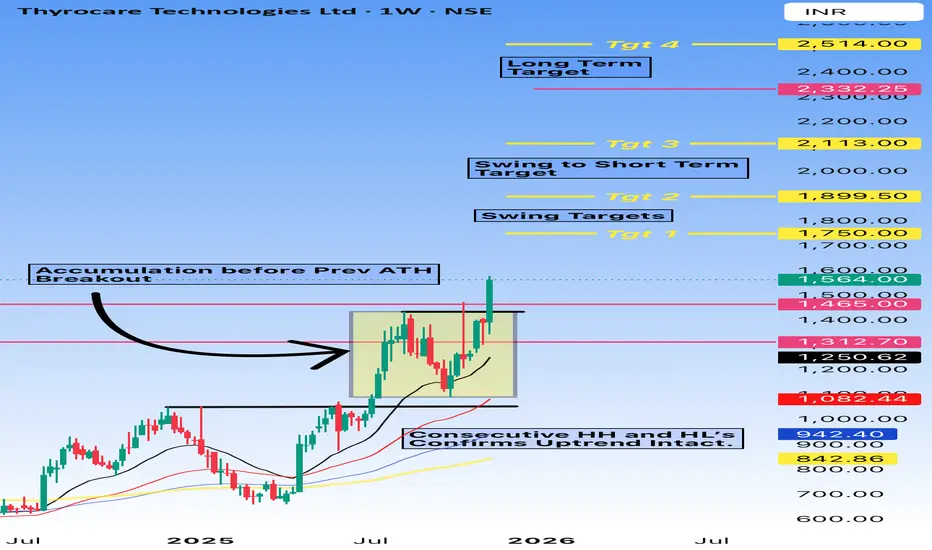
Thyrocare Long - ATH BreakoutThe Chart says it all.
Thyrocare is displaying strong #bullish #momentum, breaking out confidently after a solid period of #accumulation.
The structure is clean—consecutive higher highs and higher lows keep the #uptrend firmly intact.
Price has surged above key resistance levels, turning them into support, and is now marching toward multiple #swing and long-term #targets.
Overall, the chart reflects renewed strength, buyer dominance, and clear upside potential as the trend continues to build. 🚀📈
Levels and Targets in chart.
Disclaimer:
I am not a SEBI-registered advisor. The analysis shared is purely for educational and informational purposes and should not be considered investment or trading advice. Please consult a SEBI-registered financial advisor before making any investment decisions.
Trading and investing in the markets involve risk; you should perform your own research and due diligence.
THYROCARE
THYROCAREThyrocare technologies Ltd has breakout ATH and 4 years round pattern breakout so if stock come for retest level then entry will triggered.
This is just for educational purpose and not any buy and sell recommendation

Perfect Setup: Thyrocare Cup and Handle | Long-Term WealthSTRONG BUY Setup 🏥
Entry: ₹1,490-1,510 (Current Level)
Target 1: ₹1,557-1,570
Target 2: ₹1,611-1,630
Target 3: ₹1,665-1,685
Target 4: ₹1,750-1,800+ (Extended - Cup Depth Target)
Stop Loss: ₹1,400
Technical Rationale:
PERFECT CUP AND HANDLE PATTERN forming on Weekly Chart (educational diagram shown)
Massive multi-year Cup formation (pink shaded area) from 2021 highs
Handle consolidation currently forming near 1,400-1,500 range
Strong +7.15% surge today breaking above handle resistance
Volume at 2.82M - strong for weekly timeframe
Price breaking above descending trendline (black line)
Trading above both pink trendlines - bullish reversal confirmed
RSI around 60-65 - healthy momentum with room for upside
Healthcare/Diagnostics sector fundamentally strong
Cup depth: ~1,500 to bottom (~400) = ~1,100 points
Measured move: 1,500 base + 1,100 depth = 2,600 target (long-term)
Multiple resistance levels: 1,557, 1,611, 1,665
Clear support at handle base: 1,400
Risk-Reward: EXCEPTIONAL 1:10+ ratio for full cup target
Pattern: CUP AND HANDLE on WEEKLY Chart - one of the most powerful and reliable bullish continuation patterns in technical analysis
Strategy: Long-term positional/investment (months to year+)
Book 15% at T1 (1,565), 15% at T2 (1,620), 15% at T3 (1,675)
Hold remaining 55% for major target 2,000-2,600
Trail SL to 1,500 after crossing T1
Key Levels:
Handle Support (Critical): 1,400 - MUST HOLD
Cup Rim Resistance: 1,500-1,520 (breaking now)
Strong Resistance: 1,557, 1,611, 1,665
Extended Targets: 1,800, 2,000, 2,200-2,600
Major Support: 1,400, 1,350
Timeframe: WEEKLY chart - this is a MAJOR long-term investment setup (6-18 months)
Cup & Handle Characteristics:
✅ Cup: Multi-year rounded bottom (2021-2024) - ✓
✅ Handle: Consolidation at rim (current) - ✓
✅ Volume: Decreasing in handle, increasing on breakout - ✓
✅ Depth: Significant (1,100 points) - ✓
✅ Breakout: Occurring now with volume - ✓
Volume Analysis: 2.82M weekly is substantial, confirming breakout authenticity
Sector: Healthcare/Diagnostics - Thyrocare is major diagnostic chain, secular growth story
Measured Move Calculation:
Disclaimer: For educational purposes only. Not SEBI registered.
Cup bottom: ~400
Cup rim: ~1,500
Depth: 1,100 points
Target: 1,500 + 1,100 = 2,600 (100%+ upside potential)
Conservative target: 1,800-2,000 (50-70% upside)

Plan for 17th October 2025Nifty future and banknifty future analysis and intraday plan.
Quarterly results - analysed.
This video is for information/education purpose only. you are 100% responsible for any actions you take by reading/viewing this post.
please consult your financial advisor before taking any action.
----Vinaykumar hiremath, CMT

Strong Technical Buy Thyrocare cmp 602, target 690 sl 565The stock seems to have bottomed out and ready to make new highs so our first target is the initial resistance of 690 and later on it can shoot to 750-800 range.

#THYROCARE 583 recommended to buy - #stockstowatch Rachit SethiaNSE:THYROCARE
THYROCARE 583
TGT 680
SL 540
Return 16%
TF <6M
RR >2
Factors: BULLISH WEDGE BREAKOUT Trend Following Rising Volume with rising Prices. Flag pattern breakout. Pennant Pattern Breakout with Bullish Candle. Retest Successful. Higher Highs & Higher Lows. Broken above RESISTANCE levels Trading at SUPPORT levels Earnings are strong. Bullish Wedge Breakout Risk Return Ratio is healthy. And Rising from Double Bottom Pattern to Flag Pattern forming. If you like my work KINDLY LIKE SHARE & FOLLOW this page for free Stock Recommendations. With 💚 from Rachit Sethia

THYROCARE Daily timeframe analysis for long term
NSE:THYROCARE about to breakout Opening Price 665 when it was listed in NSE.
We can see long term move above 670 with can buy more till 574 with SL 545.
Major targets levels are highlighted in blue lines.

Thyrocare can thrust upwards from here in the long termThyrocare Technology Ltd. CMP – 560.40 (Long Term Investment Idea)
Market Capitalization Rs 2,966.2Cr
Red Flags:🟥
High Valuation (P.E. = 45.7)
Declining annual net profit
MFs are decreasing stake
High promoter pledge
Green Flags:🟩
No debt
FIIs are increasing stake
Improving cash from operations annual
Dividend Yield @CMP = 3.34%
Previous Happy Candles Number – 41/100
New Happy Candles Number – 43/100
Fresh Entry/ averaging / compounding after closing above 567
Targets: 585 and 606
Long term target: 630 and 674
Stop loss: Closing below 516
The above information is provided for educational purpose, analysis and paper trading only. Please don't treat this as a buy or sell recommendation for the stock. We do not guarantee any success in highly volatile market or otherwise. Stock market investment is subject to market risks which include global and regional risks. We will not be responsible for any Profit or loss that may occur due to any financial decision taken based on any data provided in this message.

Thyrocare is carefully consolidating and might take off. Thyrocare Technologies Ltd. is the 1st fully advanced and automated laboratory with a strong presence in over 2000 cities both nationally and internationally. The company conduct esoteric test with its Central Processing Laboratory (CPL) and also have Regional Processing Laboratories (RPLs) in major metro cities in India and parts of Asia. Thyrocare Technologies CMP is 569.50.
The Negative aspects of the company are high valuation (P.E. = 50.2), declining annual net profits, FIIs are decreasing and high promoter pledge. The Positive aspects of the company are improving cash from operations annual and MFs are increasing stake.
Entry after closing above 580. Target in the stock will be 630. Long term target in the stock will be 674. Stop loss in the stock should be maintained at closing below 516.
The above information is provided for educational purpose, analysis and paper trading only. Please don't treat this as a buy or sell recommendation for the stock. We will not be responsible for any Profit or loss that may occur due to any financial decision taken based on any data provided in this message.

#GUFICBIO #ZYDUSWELL #FORTIS #AARTIDRUGS #ALKEM #GLAND #BIOCON #GUFICBIO
NSE: GUFICBIO
CMP: 227
TP: 270
SL: 205
TF: <6m
RR > ~2 times
Return > 18%
GUFICBIO THYROCARE CNXPHARMA LUPIN SUNPHARMA SPARC DIVISLAB DRREDDY AUROPHARMA BALPHARMA GLENMARK SANOFI PFIZER BPLPHARMA MARKSANS BIOCON GRANULES IPCALAB LAURUSLABS NATCOPHARM GLAND ALKEM ZYDUSLIFE APOLLOHOSP FORTIS AARTIDRUGS ZYDUSWELL MAXHEALTH BAJAJHCARE
Factors:
BULLISH WEDGE BREAKOUT
Trend Following
Rising Volume with rising Prices.
Flag pattern breakout.
Pennant Pattern Breakout with Bullish Candle.
Retest Successful.
Higher Highs & Higher Lows.
Broken above RESISTANCE levels
Trading at SUPPORT levels
Earnings are strong.
Bullish Wedge Breakout
Risk Return Ratio is healthy.
And
Rising from Double Bottom Pattern to Flag Pattern forming.
If you like my work KINDLY LIKE SHARE & FOLLOW this page for free Stock Recommendations.
With 💚 from Rachit Sethia

#ASTERDM #BAJAJHCARE #MAXHEALTH #LAURUSLABS #NATCOPHARMA #GLAND #ASTERDM
NSE: ASTERDM
CMP: 225
TP: 300
SL: 200
TF: <6m
RR > ~3 times
Return > 33%
THYROCARE CNXPHARMA LUPIN SUNPHARMA SPARC DIVISLAB DRREDDY AUROPHARMA BALPHARMA GLENMARK SANOFI PFIZER BPLPHARMA MARKSANS BIOCON GRANULES IPCALAB LAURUSLABS NATCOPHARM GLAND ALKEM ZYDUSLIFE APOLLOHOSP FORTIS AARTIDRUGS ZYDUSWELL MAXHEALTH BAJAJHCARE
Factors:
BULLISH WEDGE BREAKOUT
Trend Following
Rising Volume with rising Prices.
Flag pattern breakout.
Pennant Pattern Breakout with Bullish Candle.
Retest Successful.
Higher Highs & Higher Lows.
Broken above RESISTANCE levels
Trading at SUPPORT levels
Earnings are strong.
Bullish Wedge Breakout
Risk Return Ratio is healthy.
And
Rising from Double Bottom Pattern to Flag Pattern forming.
If you like my work KINDLY LIKE SHARE & FOLLOW this page for free Stock Recommendations.
With 💚 from Rachit Sethia

#LUPIN #LAURUSLABS #ZYDUSLIFE #APOLLOHOSP #FORTIS #AARTIDRUGS #I#LUPIN
NSE: LUPIN
CMP: 756
TP: 910
SL: 700
TF: <6m
RR > 3 times
Return > 20%
THYROCARE CNXPHARMA LUPIN NSE:CIPLA SUNPHARMA SPARC DIVISLAB DRREDDY AUROPHARMA BALPHARMA GLENMARK SANOFI PFIZER BPLPHARMA MARKSANS BIOCON GRANULES IPCALAB LAURUSLABS NATCOPHARM GLAND ALKEM ZYDUSLIFE APOLLOHOSP FORTIS AARTIDRUGS
Factors:
BULLISH WEDGE BREAKOUT
Trend Following
Rising Volume with rising Prices.
Flag pattern breakout.
Pennant Pattern Breakout with Bullish Candle.
Retest Successful.
Higher Highs & Higher Lows.
Broken above RESISTANCE levels
Trading at SUPPORT levels
Earnings are strong.
Bullish Wedge Breakout
Risk Return Ratio is healthy.
And
Rising from Double Bottom Pattern to Flag Pattern forming.
If you like my work KINDLY LIKE SHARE & FOLLOW this page for free Stock Recommendations.
With 💚 from Rachit Sethia

#THYROCARE #CNXPHARMA #LUPIN #CIPLA #SUNPHARMA #SPARC #DIVISLAB #THYROCARE
NSE: THYROCARE
CMP: 700
TP: 920
SL: 600
TF: <6m
RR > 2.3 times
Return > 30%
THYROCARE CNXPHARMA LUPIN CIPLA SUNPHARMA SPARC DIVISLAB DRREDDY AUROPHARMA BALPHARMA
Factors:
BULLISH WEDGE BREAKOUT
Trend Following
Rising Volume with rising Prices.
Flag pattern breakout.
Pennant Pattern Breakout with Bullish Candle.
Retest Successful.
Higher Highs & Higher Lows.
Broken above RESISTANCE levels
Trading at SUPPORT levels
Earnings are strong.
Bullish Wedge Breakout
Risk Return Ratio is healthy.
And
Rising from Double Bottom Pattern to Flag Pattern forming.
If you like my work KINDLY LIKE SHARE & FOLLOW this page for free Stock Recommendations.
With 💚 from Rachit Sethia

Thyrocare Technol Buy ViewNSE:THYROCARE has consolidated for long time.
My view to go long from current levels (643) for target of 665 & 670
I will exit from trade if price trade below 631.
Note: This is my personal analysis, only for learning.
Thanks.

THYROCARE TECHNO Positional upside viewMy positional upper side view on NSE:THYROCARE consolidated for upper side.
My positional upper side target will be 1st 724, 2nd 811
Will exit from if price trade below 650.
Note: This is my personal analysis, only for learning.
thanks.

thyrocare #THYROCAREeducational purpose only
add to watchlist
longterm stock
thyrocare #THYROCARE thyrocare #THYROCARE thyrocare #THYROCARE
Negative: Promoters have pledged 100% of their holding


Thyrocare: Buy If Closes & Holds 910 levels ahead [CMP 866.65]Another chart for study the price action;
Thyrocare: Buy Above 910 levels for Mid-Long term : CMP 866.65
TGT 1 = 1010,
TGT 2 = 1200,
ROI 1 = 11%
ROI 2 = 32%
Hold with Patience for Greater Reward, To Manage risk - Consult your Financial advisor


Thyrocare- Beautiful moveGreat triangle breakout. Supported with nice volume, Stock reversed from good support level. 50% retracement sabka sangam.

THYROCARE - Breakout from Triangle Pattern - Swing TradeThe above analysis is done purely on basis of Price Action & Chart Patterns.
The analysis is done on daily TF hence price may take few days to few weeks in order to reach the targets
The price looks good for target of 1200+ levels if it sustains today's upmove.
Entry can be above today's high. SL = 805-810 range
The above analysis is purely for educational purpose. Traders must do their own study before entering into any trade. Traders must trade as per their own risk taking capacity and money management.
Feel Free to comment for any query or suggestion regarding this stock or Price Action Analysis.
Checkout my other ideas to understand how one can earn from stock markets with simple trade setups.

THYROCARE - Breakout from descending channel - Swing tradeThis analysis is purely based on price action and chart pattern. The analysis is done in live market.
Analysis is done on daily TF hence it may take several days to couple of weeks to reach its target. Traders can also take advantage of this analysis in intraday trades.
Entry can be made at CMP or tomorrow above the high of today's candle.
Targets are shown in image. SL can be placed either below consolidation zone or below 880.
Never Run after the price. Always plan your trade & trade your plan
Keep trailing SL accordingly once entered into the trade.
This analysis is purely for education purpose. Kindly do your own study before entering into any trade .
To check how the stock performed last time it took crucial support of 0.618 level - check below image and compare the present price.
Feel Free to comment for any suggestion or query regarding price action analysis.
