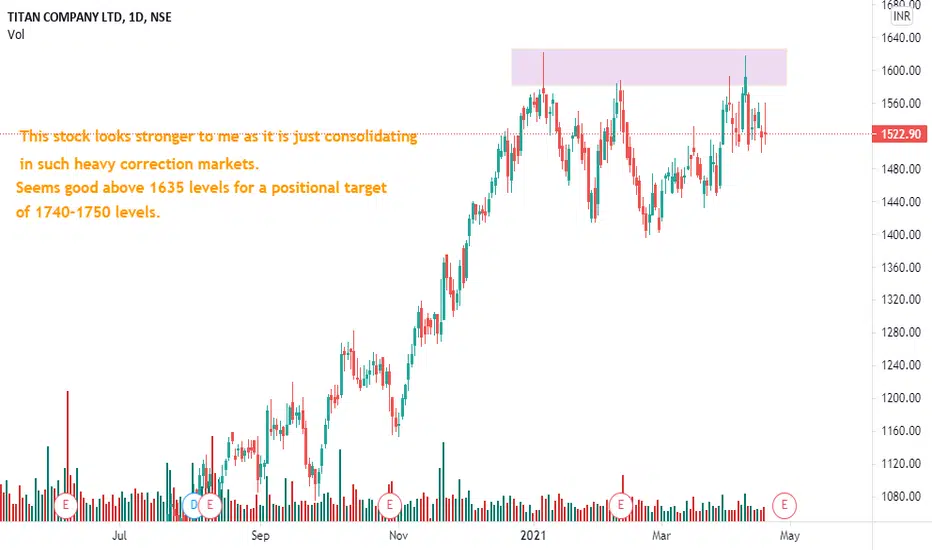
TITAN very tempting !!!I just post my prediction
Always make your analysis before a trade
Not financial advice !!!
Happy trade .....
Titan

TITAN - Wait for confirmationTITAN - Wait for confirmation
If you find my analysis useful and helpful, please do consider subscribing and liking my work. This helps me stay motivated.
For any questions or comments, do let me know!
-- For educational purposes only. Do your own research before making investment decisions.

TITAN LONG INTRADAY 23 JUN,2021Dear trader,
If u look at the chart of TITAN (analysis based intraday only) the TITAN Buy at 1780 and Target at 1790
Best Buy at 1776.
Our Best Buy is based on high quality research and when the instrument reaches this level , it’s a jackpot trade.
Best Buy level might be executed or might not be executed.
The chart clearly indicates Bullish Trend you can also see the candle stick patters for more indepth analysis.
In Intraday most important thing is to enter and exit points.
Our signals are based on analytics, algorithms, mathematical derivatives.
Always be a responsible trader, kindly trade only when you have maximum opportunity in the market with minimum risk and with keynotes like data, analysis and proper strategies.
Kindly message us for strategies and analysis.

#Titan Rugpull. Mark Cuban calls for Stablecoin Regulation, huh?Billionaires are not your friends.
Is something I repeat often
here is another example.

TITAN: BE MORESL-1580
BLUECHIP STOCK
As Nifty is breaking all time high again and again it is better to invest in some blue chip stocks on dips.
Only buy after retracement.
I will update the targets here.
So folks feel free to DM or comment.

Change in Titan company ltd (inversion) all my indicators with 85% tell me that the market change to buying


TITAN -- Possible reversal or cross the reistance? TITAN - testing this level 3rd time.
If cross the resistance .. 1650-1700 in short time possible.
Market at all time high .. any correction here will make TITAN to 1500 and lower levels...
Add to watch list --- trade as per trend.

gold and titan goes hand in hand!chances to fire up as inverted head and shoulders along with volume spurt...........

*Titan*Some few points before we going towards the Technical analysis
Covid cases declines Day by day
In june we can see Unlocking series of cities and states if Cases remains low
Vaccination is also started again ,very soon we will have enough Vaccine (Till Dec 2021 - 216cr 2X of our poppulation roughly) So do not panic for that,
Now comes towards Technical points
Titan breach very strong trendline came from Bottom of Covid
We can add small qty here and add more again at All time high breakout of level 1625
Note - Before taking any entry exit please concern with your financial advisor

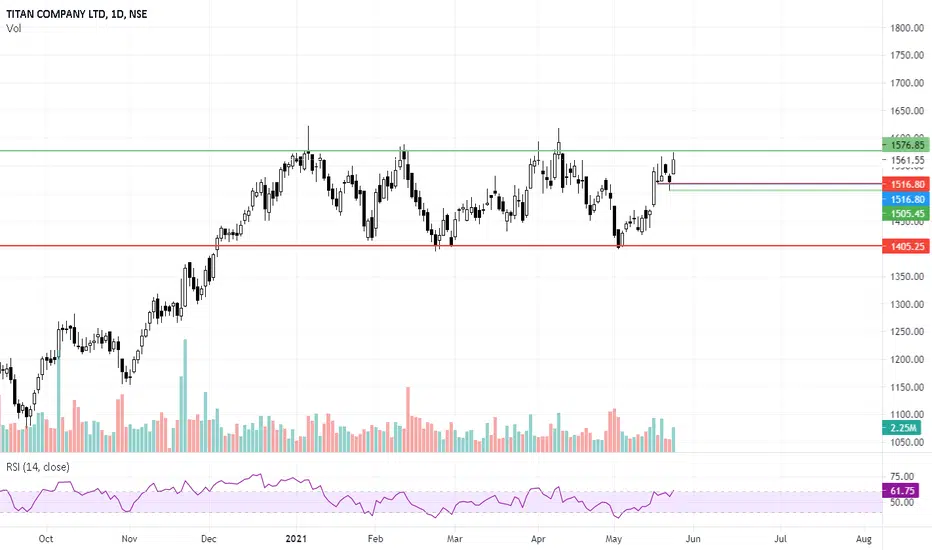
Keep Titan on Radar for Breakout TradeTitan is one such stock that has been trading in a range of about 15% for the past 5 months.
The Recent rally from range support ( the move I already captured - please refer to linked post ) looks quite good and the stock currently is trading at the range upper end, any breakout might bring a fresh buying in the stock and it can move
towards 1700 and 1750 levels.
Titan - Trendline Breakout TradeTrendline trading is the easiest form of trading, all you need to do is to learn the art of drawing trendlines.
In this post, I will tell you, how I identify trendline breakout trades
The first step is to identify the structure of the stock, which is necessary for identifying the current trend in the underlying stock.
Once you have identified the trend, start drawing the trendline in the direction of the trend for ex. in a downtrend structure, draw a trendline connecting high points and in an uptrend, draw a trendline connecting low points.
For Conforming trendline validity, make sure that it has a minimum of 3 points of supports or resistance as the case may be.
Then sit tight and wait for the trendline breakout with good volume and good momentum, and voila you have identified a breakout/Breakdown trade.
One more thing I do is to keep, higher time frame trend in consideration to find high probability trades.
Now, this an example of titan, where the structure of the stock on hourly is of lower lows and lower highs, so I drew trendline connecting highs and you can see the trendline had 4 resistance points, making it valid for breakout trades, plus as I said i keep higher time frame direction in consideration, which was bullish on the daily chart, hence this breakout trade is a high probability trade because it is in the direction of the daily chart.
I could also see so many parameters that are loading in favour of the trade, but it will only add confusion if I explain it here, hence keeping it simple, for now, will discuss that in other trades examples...

Titanswap is a nice Huobi gem!TITAN looking fairly strong here with tons of tests at that resistance. Definitely one that could have explosive price action similar to other Huobi gems like CRU.

support and resistance stratergyreasons to short:-
1) head and shoulder retest.
2) down trend line resistance
3) strong uptrend break and retest .

TITANMonthly pattern breakout.
Retrace done.
Price should take support & move-up to the next target.


Titan. Starting of fresh bullish motive wave on daily. Titan CMP 1559.
It has finished its latest ABC correction and now started fresh motive wave 1 on daily chart.
Looking at price action, 1940 is the first target at the end of current wave cycle.
SL 1408 DCB.

TITAN head and shoulder PatternTitan formed head and shoulder pattern and now it's closed below neckline... Below neckline targets are mentioned in chart.
Chart is for education purpose only. Take advise from your financial advisor before taking any position.. keep learning keep earning..

TITAN - Breakout at support - Short Term swing/Intraday TradeThis analysis is purely based on price action and Chart Patterns.
The analysis is on 30min TF hence target can be achieved in intraday trade or in couple of days.
Trade logic with SL and Target is explained in image itself.
Don't chase the price. Always plan your trade & trade your plan
Keep trailing SL accordingly once entered into the trade.
This analysis is purely for education purpose. Kindly do your own study before entering into any trade .
Also check out my other ideas to understand how price action works and how it can be used to make regular profits without any complex strategies.
Feel Free to comment for any queries regarding the above stock or price action analysis in general.


Trade Set up Buy some quantity at 1515 and some at 1510.6 if it takes support target 1 is 1528 and trail rest till 1550. This is positional trade may not hit in intraday.
