#TON/USDT : Short Wave Still In Progress#TON
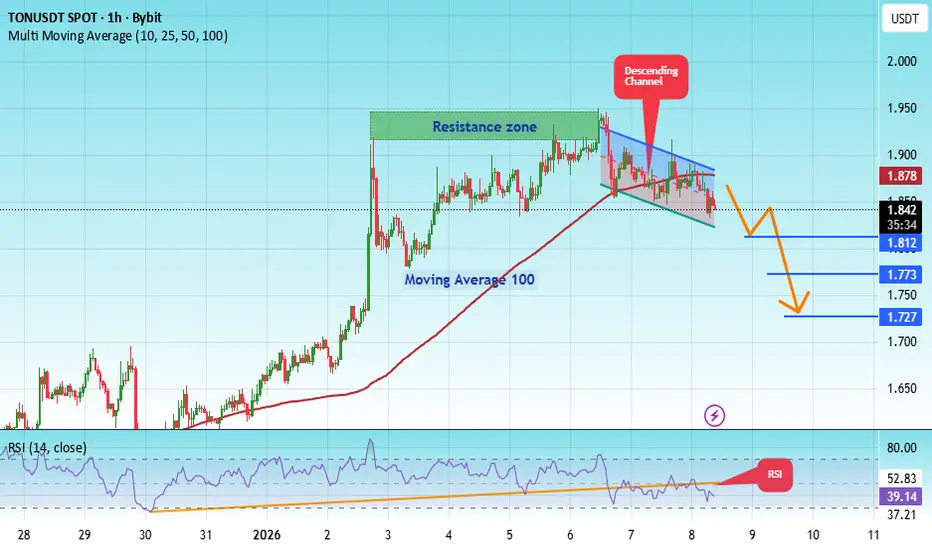
The price is moving in a descending channel on the 1-hour timeframe. It has reached the upper limit and is heading towards breaking downwards, with a retest of the upper limit expected.
We have an upward trend on the RSI indicator, which has reached near the upper limit, and a downward reversal is expected.
There is a major resistance zone in green at 1.94. The price has bounced from this zone multiple times and is expected to bounce again.
We have a trend of consolidation above the 100-period moving average, as we are moving close to it, which supports a downward move towards touching it.
Entry price: 1.84
First target: 1.81
Second target: 1.77
Third target: 1.72
Stop loss: Above the resistance zone in green.
Don't forget a simple thing: money management.
For inquiries, please leave a comment.
Thank you.
TONUSD
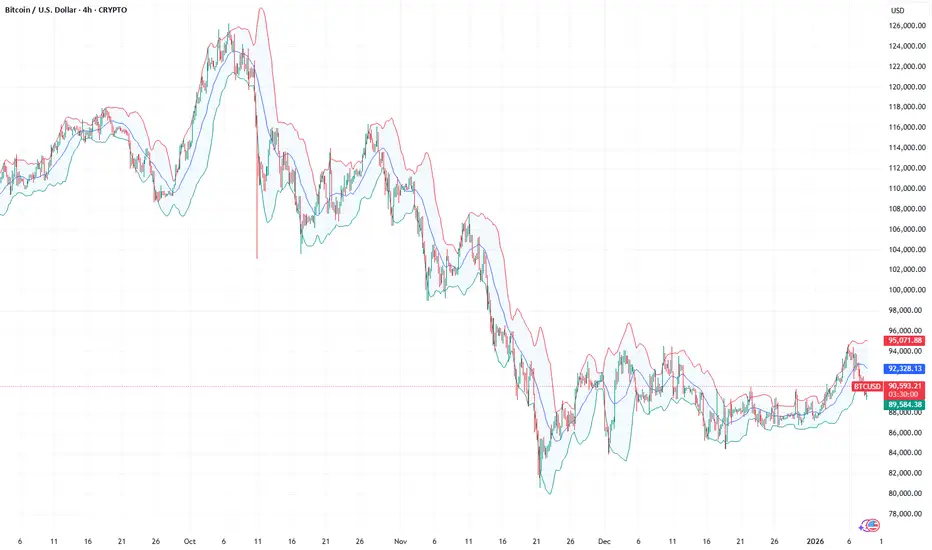
Crypto is charging higher again: BTCUSD and the pack are ready In December, our clients most actively traded cryptocurrencies such as BTCUSD, ETHUSD, BNBUSD, SOLUSD, and XRPUSD —and these instruments delivered the highest share of profitable trades. Today’s review focuses on the crypto market: demand from major investors, news from large corporations, and the ongoing development of leading blockchain platforms are setting the tone for early 2026.
Growth outlook for cryptocurrencies in Q1 2026:
BTCUSD — strong interest from institutional investors and the expansion of exchange-traded crypto products support demand even during pullbacks.
ETHUSD — increasing network usage and progress toward faster, cheaper transfers create room for strengthening in a calm external environment.
SOLUSD — active project development and rising attention from major market participants point to further upside potential if news remains positive.
BNBUSD — ecosystem service growth and infrastructure upgrades provide support, though price moves may be sharp.
TONUSD — expansion of Telegram-related services and user tools may drive additional demand if adoption momentum continues.
FreshForex analysts believe that in the coming months the market will be shaped by three key factors: overall global market sentiment, inflows and outflows into public crypto instruments, and news around the development of major networks. Even under a positive scenario, prudent risk limits should be set in advance.
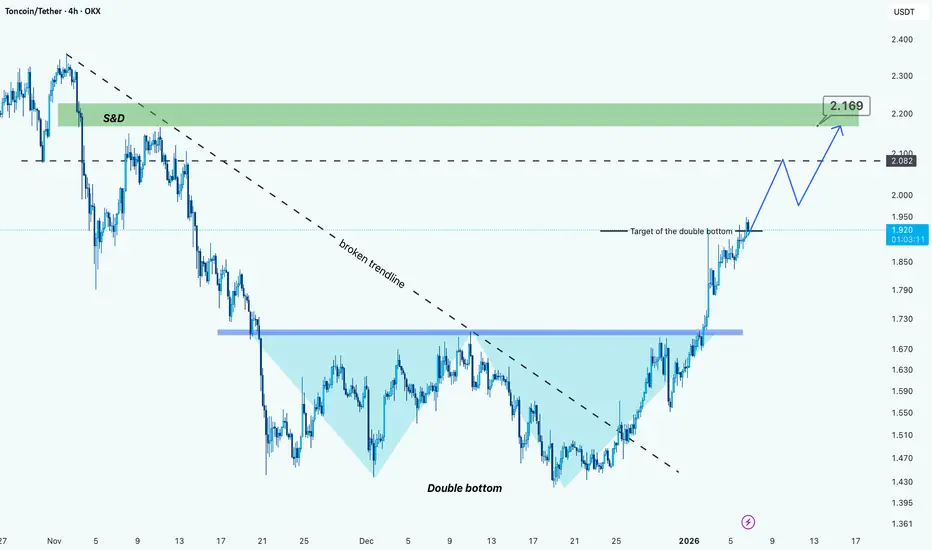
TON/USDT: Double Bottom BreakoutHi
TON formed a clear double bottom, signaling a potential trend reversal.
Price has now broken above the descending trendline, confirming a shift in market structure.
The former resistance zone is acting as support, which strengthens the bullish case. As long as price holds above this level, upside continuation remains likely.
Targets:
• 1.08 → internal resistance
• 2.16 → Major supply & demand zone
A short consolidation or pullback is possible, but the overall structure favors bullish continuation.
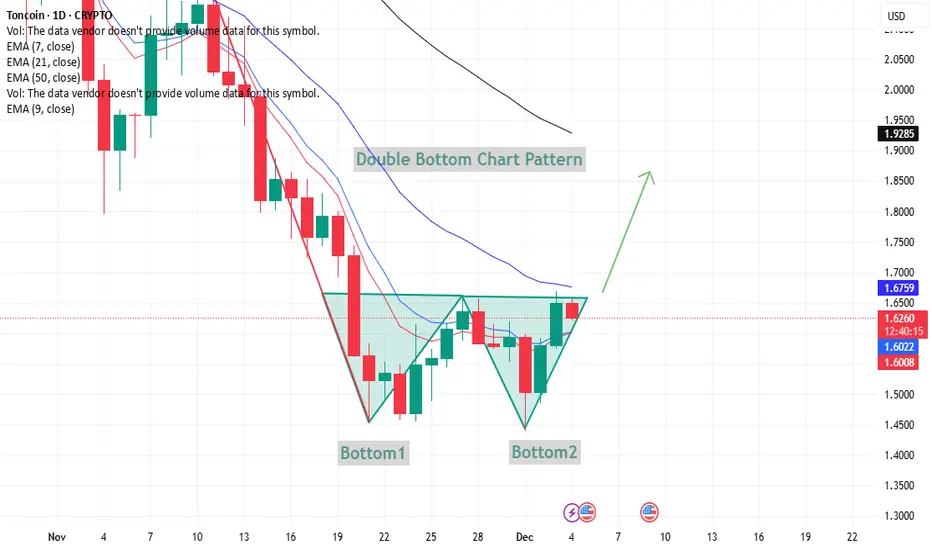
TONUSD – Double Bottom Formation TONUSD – Double Bottom Formation (Neutral Technical View)
The chart shows a double bottom structure, where price formed two lows (Bottom 1 and Bottom 2) near the same zone. This is generally watched as a potential reversal signal when price moves back toward the neckline.
Key observations:
Bottom 1 and Bottom 2 highlight buyers defending the same support area.
Price is now approaching the neckline zone around 1.65–1.67, which is an important technical barrier.
If candles can hold above the short-term EMAs (9 and 21), it strengthens the idea of momentum shifting upward.
A close above the neckline would indicate continuation toward higher resistance levels, while rejection could keep the pair in consolidation.
#TON/USDT : Trendline Break & Double Bottom#TON
The price is moving in a descending channel on the 1-hour timeframe. It has reached the lower boundary and is heading towards breaking above it, with a retest of the upper boundary expected.
We have a downtrend on the RSI indicator, which has reached near the lower boundary, and an upward rebound is expected.
There is a key support zone in green at 1.53. The price has bounced from this zone multiple times and is expected to bounce again.
We have a trend towards stability above the 100-period moving average, as we are moving close to it, which supports the upward movement.
Entry price: 1.60
First target: 1.64
Second target: 1.69
Third target: 1.755
Stop loss: Below the support zone in green.
Don't forget a simple thing: capital management.
For inquiries, please leave a comment.
Thank you.

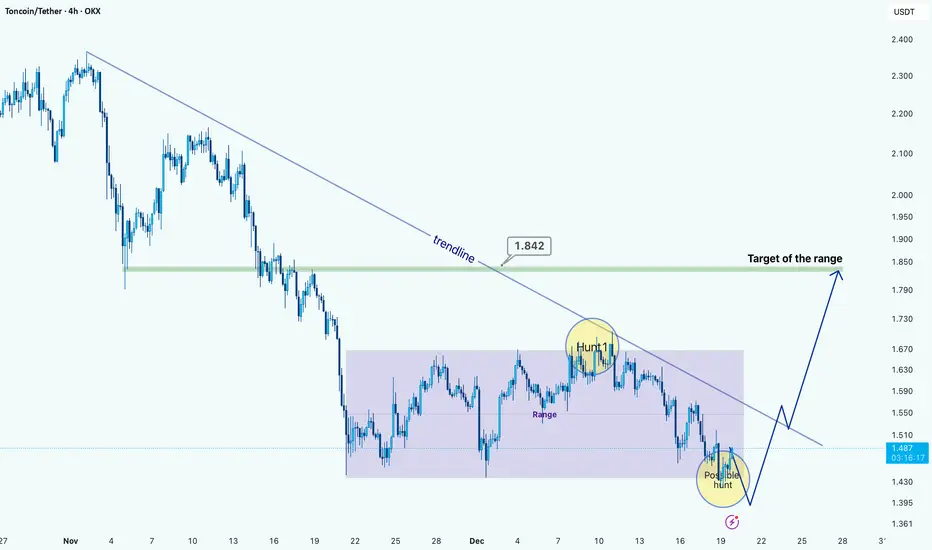
TON/USDT: Range Structure Within a Broader DowntrendHi!
TON is still trading under a well-defined descending trendline, confirming that the higher-timeframe structure remains bearish. After the impulsive sell-off, the price transitioned into a clear consolidation range, highlighted on the chart. This range shows multiple reactions at both extremes, validating it as an accumulation/distribution zone rather than random price action.
A notable liquidity hunt occurred near the upper boundary of the range, where price briefly swept highs and was immediately rejected, aligning with the descending trendline and reinforcing it as dynamic resistance. Currently, price is trading near the lower boundary of the range, where another potential liquidity sweep may occur before a directional move.
Bullish scenario: A downside sweep below the range lows, followed by strong acceptance back inside the range, could trigger a reversal toward the range high near 1.84, which also aligns with the descending trendline and acts as a logical target.
Bearish scenario: Failure to reclaim the range after a breakdown would confirm continuation of the downtrend, exposing lower supports.
TONUSD: Wave Structure in Search of Growth ImpulseTONUSD: Wave Structure in Search of Growth Impulse
TONUSD Wave Overview (D1 and H4)
As a trader who has been practicing wave analysis for over ten years, I note that the current picture for TONUSD shows the end of an extended corrective phase and the potential for a new movement.
D1 Chart: The global structure indicates that the market is gradually breaking out of its sideways range. The wave formation looks like the end of a correction, laying the foundation for the next impulse.
H4 Chart: Local dynamics confirm the first signs of an impulse. Key entry points are forming here, which could mark the beginning of a larger wave.
Main Scenario
After the completion of the corrective phase, a downward impulse sequence is expected to develop. This movement may be accompanied by increased seller activity and a shift in focus to the downside.
Alternative Scenario
If the price holds above local peaks and forms a stable upward impulse structure, the focus will shift to continued growth. In this case, the correction will be considered incomplete, and TONUSD may experience an additional rebound.
Trading Idea
Conservative approach: wait for confirmation of a breakout of key levels and enter with the trend.
Aggressive approach: use local impulses on H4 for earlier entries, but with tight stops.
In both cases, it is important to maintain strict risk management and adjust the plan as new impulses emerge.
Results
TONUSD is at a crossroads between the end of the correction and the beginning of a new impulse. The wave structure on D1 and H4 provides clear guidelines for action: watch for confirmation of the scenario and act with discipline.

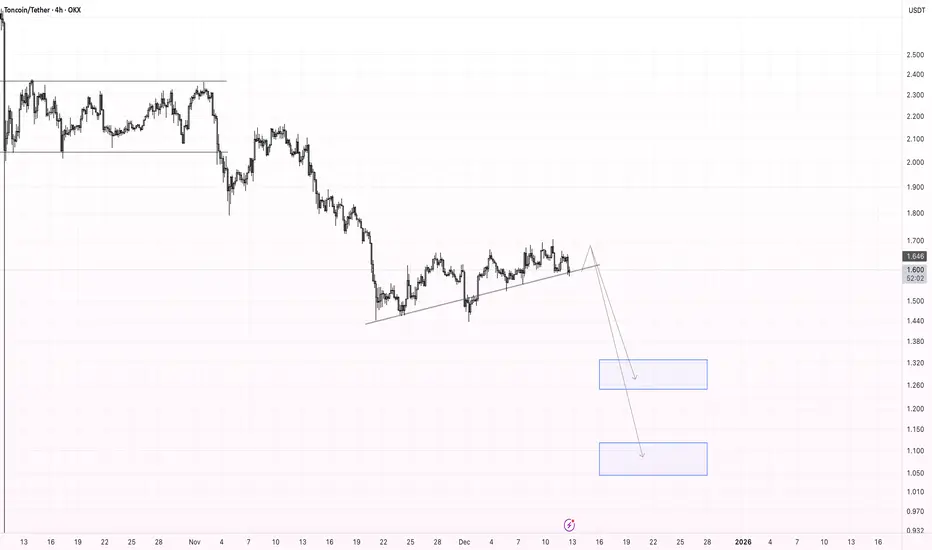
TON Correction Scenario: $1.33 → $1.10 TargetsPrice is breaking below the local ascending trendline, signalling a potential shift in short-term momentum. If the breakdown holds, I expect a continuation to the downside toward the next support zones. My targets are $1.33 as the first demand area and $1.10 as the secondary, deeper target.
TON - Long idea.The TON looks pretty long. The structure is good. I expect another test near the local low. Ideally, we should break through the low and rise!
I've sketched out a rough plan and set up alerts. I'll be watching!
The rally is back: from Ethereum to Toncoin!Recently, the pairs ETHUSD, TONUSD, LNKUSD, ADAUSD, and AAVUSD have been climbing amid improving market sentiment and inflows into ETFs — including spot ETFs (funds that buy the underlying asset itself rather than derivatives). Investors are reacting to ecosystem news and protocol upgrades that enhance the real utility of networks. As a result, the market has received fresh momentum: demand is expanding, and prices are following.
Five Growth Factors:
ETHUSD (Ethereum +15.3%) — Supported by inflows into spot ETFs and heightened developer activity around network upgrades, which strengthened buyer interest (spot ETFs are funds that directly hold ETH).
TONUSD (Toncoin +9.7%) — User growth driven by Telegram mini-apps and attention campaigns like SERA (a gaming/social ecosystem event; SERA is the initiative’s name) is expanding the user base.
LNKUSD (Chainlink +13.9%) — Adoption of CCIP (a cross-chain messaging and value transfer protocol) continues to grow, including through bridges (technology that transfers assets between networks) — on December 4, the Base–Solana bridge was announced (Base and Solana are blockchains; the bridge connects them).
ADAUSD (Cardano +16.2%) — December saw the launch of Midnight/NIGHT (Midnight is a privacy-focused sidechain — a separate network alongside the main one; NIGHT is its token). This gave Cardano a real new feature: private transactions and business-ready smart contracts.
AAVUSD (Aave +15.8%) — Progress toward protocol version v4 (the fourth major upgrade enhancing flexibility and reducing client risk): a public testnet and preparation for the mainnet are heating up expectations around functionality and token economics.
If interest in Ethereum ETFs remains strong, Ethereum can maintain its momentum. Toncoin benefits from easy access through Telegram apps; Chainlink gains strength as more services adopt its cross-chain “translator,” enabling secure data and token transfers; Cardano benefits from having a dedicated private network for business use cases; and Aave grows on expectations surrounding its upcoming core protocol upgrade.
FreshForex analysts note that in the coming weeks, the performance of ETH, TON, LINK, ADA, and AAVE will depend on three factors: sustained inflows into Ethereum-backed ETFs, real user and use-case growth (TON via Telegram mini-apps; LINK as the “connector” between blockchains), the pace of technological rollouts (the Midnight private network in the Cardano ecosystem and Aave’s transition from testing to the full v4 release). Investors are advised to maintain strict risk management and monitor the macroeconomic calendar.

TON : SELL LIMIT
Hello friends
considering the downtrend we are in, the power of sellers is quite clear and it is logical that we also move to the strong side, and in this downtrend, any price increase can be a selling opportunity.
So now, considering the buyers' support of the support area identified with Fibonacci, we need to see whether the sellers will enter again in the identified resistance area or not?
If the buyers weaken again in the resistance area, the price can fall to the specified targets.
This analysis is purely technically reviewed and is not a buy or sell recommendation, so do not act emotionally and observe risk and capital management.
*Trade safely with us*

FireHoseReel | TON’s Last Support of Defense🔥 Welcome to FireHoseReel !
Let’s dive into the analysis of Telegram Coin (TON).
👀 TONUSDT 4H Overview
TON has reached a very critical support zone. A clean break below this level could activate our next short trigger and lead to a deeper drop than many expect.
📊 Volume Analysis
Selling pressure during the formation of this support has been significant. With heavy market FOMO, many traders have already exited their TON positions. If this downside momentum continues, TON could enter a deeper corrective phase.
🔁 TONBTC Prespective
Meanwhile, the TON/BTC pair is also in a bearish structure, indicating that TON’s relative strength against Bitcoin is weakening.
📌 Trading Scenario
At the moment, TON presents one primary scenario, focused on the short side, which you can use alongside your own trading setup.
🔴 Short Scenario
A breakdown below the current support at $1.465, confirmed by a strong increase in sell volume, could trigger a sharp decline in TON.
❤️ Risk Management & Emotional Discipline
Crypto trading is highly risky. Without proper risk management and emotional control, trading is no different from gambling.
Logic must always come before emotions. Learn to manage your trades—and enjoy the process of trading with control and discipline.

Toncoin (TON/USDT): Trendline Break & Double BottomHi!
TON has formed a double-bottom reversal pattern after a sharp decline, signaling early bullish momentum. Price has also broken the minor descending trendline, confirming a short-term shift in structure.
Key Levels
Immediate Resistance: $1.63–$1.68 (first supply zone)
Major Resistance: $1.78–$1.82 (trendline + supply confluence)
Bullish Scenario
A sustained move above $1.63–$1.68 opens the path toward $1.78–$1.82, where the main descending trendline is located. A breakout there would confirm a stronger trend reversal.
Bearish Scenario
Failure to hold above the breakout zone may lead to a retest of $1.50–$1.52, the neckline of the double bottom.

#TON/USDT (TON/USDT): Trendline Break & Double Bottom#TON
The price is moving within an ascending channel on the 1-hour timeframe and is adhering to it well. It is poised to break out strongly and retest the channel.
We have a downtrend line on the RSI indicator that is about to break and retest, which supports the upward move.
There is a key support zone in green at the price of 1.47, representing a strong support point.
We have a trend of consolidation above the 100-period moving average.
Entry price: 1.50
First target: 1.53
Second target: 1.58
Third target: 1.63
Don't forget a simple money management rule:
Place your stop-loss order below the support zone in green.
Once you reach the first target, save some money and then change your stop-loss order to an entry order.
For any questions, please leave a comment.
Thank you.

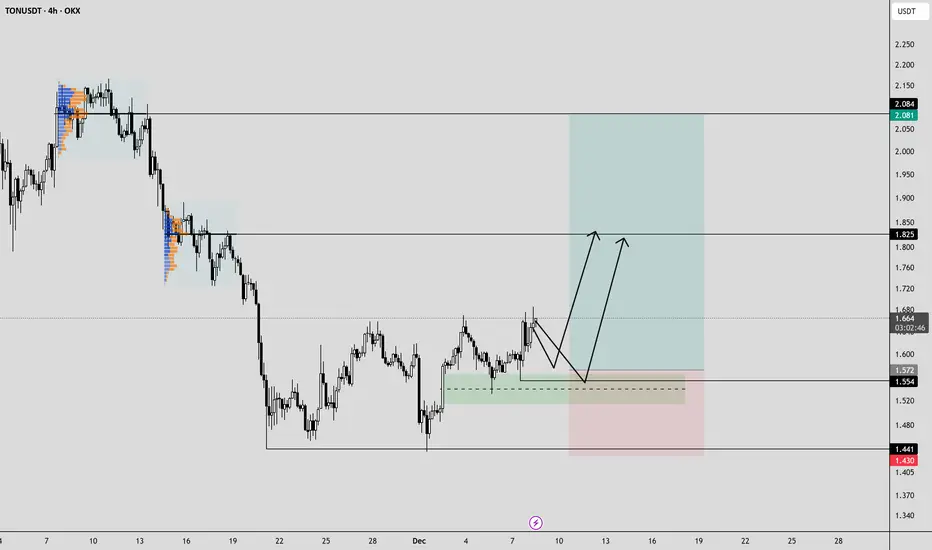
TON Buy/Long Setup (2H)On your chart, the coin has been forming consecutive higher lows and consistent bullish CHs on the lower timeframes.
We can enter positions around the green lines, which are our ENTRY levels.
The targets are marked on the chart.
Let’s wait and see what happens.
For risk management, please don't forget stop loss and capital management
When we reach the first target, save some profit and then change the stop to entry
Comment if you have any questions
Thank You

TON/USDT — Defense Zone at 2.20–1.92: Reversal or Breakdown?TON is now standing at a critical inflection point — the 2.20–1.92 zone (yellow block).
This area isn’t just another support level — it’s the make-or-break zone that will decide whether TON will rebound for a macro reversal or collapse into a deeper downtrend.
After a sharp fall from the 8.28 high, price has reached its historical demand base, showing a strong wick rejection below support — a classic sign of liquidity sweep or stop-hunt, often marking the final shakeout before larger players begin accumulating.
However, without a clear structure break and volume confirmation, the risk of a fake bounce remains high.
---
Structure & Pattern Analysis
1. Macro trend remains bearish, with a series of lower highs and lower lows since the 2024 peak.
2. The 2.20–1.92 zone represents a major accumulation range, also aligning with the previous breakout base from early 2023.
3. The deep wick indicates a potential spring phase in a Wyckoff Accumulation pattern, where weak hands are flushed out.
4. A confirmed close above 2.65 would mark a structural shift — signaling a possible start of a new bullish leg.
5. On the other hand, a close below 1.92 would validate a macro breakdown, opening room for a prolonged bearish continuation.
---
Bullish Scenario (Potential Reversal)
Confirmation: A 4D candle close above 2.65, supported by increasing volume.
Technical narrative: After a long liquidation event, price tends to form a V-shaped rebound or base breakout once smart money steps back in.
🎯 Upside Targets:
Target 1 → 3.55 (local distribution zone)
Target 2 → 4.60 (key structural pivot)
Target 3 → 6.84 – 8.09 (major supply zone & prior 2024 top)
💡 If momentum builds, this could evolve into a multi-month recovery rally, similar to the early bull phase of 2024.
---
Bearish Scenario (Continuation Risk)
Confirmation: A 4D close below 1.92 confirms breakdown of the macro support.
Technical narrative: Once this zone fails, buyer exhaustion could drive price toward 1.50–1.20, the next historical liquidity pool.
🎯 Downside Targets:
Short-term support → 1.80
Extended range → 1.50 – 1.20
A proper reversal would then require a new long accumulation base forming at lower levels.
---
Technical Summary
TON is currently hovering within its largest accumulation zone in over a year.
This yellow block (2.20–1.92) will determine the next major trend:
Hold and reclaim 2.65 → bullish reversal confirmed.
Fail and close below 1.92 → macro breakdown confirmed.
At this stage, TON offers a high-risk, high-reward setup for swing traders — ideal for those waiting for clear structural confirmation before entry.
#TON #TONUSDT #CryptoAnalysis #TONCoin #TechnicalAnalysis #SwingTrade #BreakoutSetup #SupportAndResistance #Wyckoff #MarketStructure #AccumulationPhase #CryptoUpdate #PriceAction

#TON/USDT Consolidation Buy After Sell-Off#TON
The price is moving in a descending channel on the 1-hour frame and is expected to break it and continue upward.
We have a trend to stabilize above the 100 moving average again.
We have a downtrend on the RSI indicator that supports the upward move with a breakout.
We have a major support area in green that pushed the price higher at 2.12.
Entry price: 2.15.
First target: 2.16.
Second target: 2.18.
Third target: 2.21.
To manage risk, don't forget stop loss and capital management.
The stop loss is below the support area in green.
When the first target is reached, save some profits and then change the stop order to an entry order.
For inquiries, please comment.
Thank you.

TON have a good Investment Opportunity Hi Everyone;
today we have one of the best risk to reward Investment opportunity
it is more than 34 times the risk and the chart is look very promising.
I expect breaking the previous bear market key point will clear the way to the final target

A TON of Hope — or Just a Slope?I expect TON/USDT to rebound toward 2.26.
The invalidation zone is marked in red on the chart.
Still, let’s keep our feet on the ground — we all remember that recent crash.
So far, there are no strong signals of a new bullish trend.
This move up looks more like a correction phase inside a broader bearish structure, not the start of something bigger.
Trade wisely — not emotionally

DeGRAM | TONUSD is correcting from the resistance line📊 Technical Analysis
● TON/USD remains in a descending channel, continuously rejecting the resistance near 2.30, indicating persistent bearish pressure.
● The structure suggests a potential continuation toward 1.85 support, with lower highs confirming a sustained downtrend and weak buying momentum.
💡 Fundamental Analysis
● Despite network growth, TON faces selling pressure amid declining market liquidity and reduced investor risk appetite in altcoins.
✨ Summary
● Short bias below 2.30; objectives 2.00–1.85. The intact bearish channel and fading sentiment point to a medium-term downside continuation.
-------------------
Share your opinion in the comments and support the idea with a like. Thanks for your support!

#TON/USDT Consolidation Buy After Sell-Off#TON
The price is moving within a descending channel on the 1-hour frame, adhering well to it, and is heading for a strong breakout and retest.
We have a bearish trend on the RSI indicator that is about to be broken and retested, which supports the upward breakout.
There is a major support area in green at 2.15, representing a strong support point.
We are heading for consolidation above the 100 moving average.
Entry price: 2.30
First target: 2.38
Second target: 2.47
Third target: 2.58
Don't forget a simple matter: capital management.
When you reach the first target, save some money and then change your stop-loss order to an entry order.
For inquiries, please leave a comment.
Thank you.

#TON/USDT : Bullish Wave Still In Progress#TON
The price is moving within a descending channel on the 1-hour frame, adhering well to it, and is heading for a strong breakout and retest.
We have a bearish trend on the RSI indicator that is about to be broken and retested, which supports the upward breakout.
There is a major support area in green at 2.70, representing a strong support point.
We are heading for consolidation above the 100 moving average.
Entry price: 2.76
First target: 2.80
Second target: 2.87
Third target: 2.96
Don't forget a simple matter: capital management.
When you reach the first target, save some money and then change your stop-loss order to an entry order.
For inquiries, please leave a comment.
Thank you.

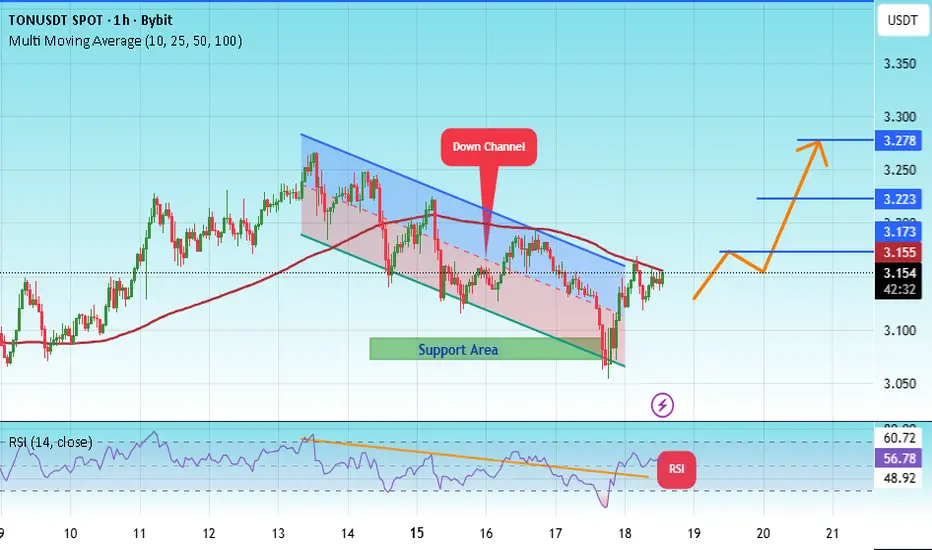
#TON/USDT | TON Testing Wedge Breakout Amid Key Support#TON
The price is moving within a descending channel on the 1-hour frame, adhering well to it, and is heading for a strong breakout and retest.
We have a bearish trend on the RSI indicator that is about to be broken and retested, which supports the upward breakout.
There is a major support area in green at 3.07, representing a strong support point.
We are heading for consolidation above the 100 moving average.
Entry price: 3.14
First target: 3.17
Second target: 3.22
Third target: 3.72
Don't forget a simple matter: capital management.
When you reach the first target, save some money and then change your stop-loss order to an entry order.
For inquiries, please leave a comment.
Thank you.