TOTAL 1W Outlook We are now two weeks into 2026. The broader crypto market structure looks like this:
- Nearly two months at the trendline support zone after ATH in early October.
- Breaking out of the downtrend after bouncing off the bullish trendline, could be the start of the next leg up for the crypto market?
- $3.68T would be the next significant level for the upside to target. Equal with the left shoulder set in December '24.
- Macro looks in support of the bulls, the FED now expanding the balance sheet introduced liquidity into the market again. It is likely that the cutting cycle continues this year towards the Mid-terms in November.
- For the bears it's a case of capitalizing on the momentum by pushing price through the trendline support. For me, that would be confirmation of a bearish HTF trend as structurally BTC would have lower highs and lower lows + a trendline break.
Total

TOTAL MARKET CAP – AMD + MONDAY RANGEPrice is currently moving inside a clear AMD structure.
After a long Accumulation phase, we saw a strong Manipulation move to the upside, creating FOMO and grabbing buy-side liquidity.
Right now, price is trading in Distribution, forming a lower high below the previous top.
It’s Monday, so for me this is a day to wait and observe. I want to see the Monday range fully form before taking any directional bias. Early Monday moves are often noise and liquidity positioning.
Key levels to watch:
Resistance: 3.10T – 3.12T
Support / Liquidity: ~3.02T
As long as price stays below 3.12T, the higher-timeframe bias remains bearish.
The equal lows around 3.02T still look like unfinished liquidity.
A sweep into resistance followed by a rejection could confirm Distribution → Markdown, with a potential move toward the daily MSB around 2.90T – 2.88T.
Bullish continuation only becomes valid after a clean break and hold above 3.12T with a higher low.
For now: patience until the Monday range is set.
👉 Do you expect a Monday liquidity sweep up, or a direct breakdown once the range is formed?
Like & comment if this helps your bias 👇
MrC

NEW YEAR WISH(BTC&ETh&ALTS)It was pretty hard year but Current Crypto Marcket Cap chart gives some optimism
EW structure looks like not completed
In my opinion we are still in last 5h wave
1 - 2 is already done
3d should be fast
4th should be also fast and sharp because 2nd is flat correction
If it will be realized - we should run from crypto and BTC for years
Maybe some global crisis will come

TOTAL Crypto Market Cap - Double Head & Shoulders?Market: CRYPTOCAP:TOTAL Crypto Market Cap
Assets referenced: COINBASE:BTCUSD , COINBASE:ETHUSD , COINBASE:SOLUSD , CRYPTO:BNBUSD , COINBASE:XRPUSD , COINBASE:ADAUSD , COINBASE:AVAXUSD , COINBASE:DOTUSD , COINBASE:LINKUSD , CRYPTO:MATICUSD
The TOTAL crypto market remains in a long-term bullish structure, supported by sustained adoption across major assets like Bitcoin, Ethereum, and Solana, alongside continued development in ecosystems such as BNB Chain, Avalanche, Polygon, and Polkadot.
That said, markets do not move in straight lines.
Historical cycle behavior
In previous crypto cycles (2017 and 2020–2021), periods of strong expansion across BTC, ETH, and large-cap altcoins were followed by:
Broad market pullbacks of ~20–40%
Corrections that held above prior cycle highs
Multi-month consolidations before continuation
These pullbacks ultimately offered the best long-term entries for Bitcoin, Ethereum, and quality altcoins like LINK, ADA, AVAX, and MATIC.
Current market structure
TOTAL market cap remains above key long-term support
Momentum has cooled without structural breakdown
Price action resembles a macro decision zone, not a trend reversal
A pullback toward prior resistance-turned-support would align with:
Historical crypto market cycles
Rising long-term trendlines
Past accumulation zones for BTC and ETH
This would represent a higher low on a multi-year timeframe, consistent with healthy bull markets.
Institutional context
This cycle differs from previous ones due to institutional participation:
Spot Bitcoin ETF flows
Growing Ethereum ETF exposure
Increased corporate and custodial adoption of digital assets
Sustained institutional demand could:
Limit downside volatility
Turn deeper corrections into sideways consolidation
Support continued strength across BTC, ETH, SOL, and large-cap altcoins
Conclusion
The long-term thesis for crypto remains intact.
Bitcoin and Ethereum continue to act as macro anchors, while ecosystems like Solana, Avalanche, Polygon, and Chainlink reflect ongoing innovation beneath the surface.
A pullback would not be bearish - it would be structurally healthy and potentially offer high-quality long-term entries.
Bullish long-term. Patient near-term.
Watching structure across the TOTAL market, not short-term noise.

TOTAL Market Cap — Still in a Bullish CycleThis idea is meant to provide perspective and a bit of reassurance during the current correction
At the moment the TOTAL still has some downside potential — roughly 11% (bottom of blue support zone =Max pain zone?)
As long as price remains above this level the market stays within a bullish/rising cycle
Only a breakdown below it would confirm a transition into a true bearish phase
For now we are still in a bullish phase and such corrections are completely normal
Looking at historically
- In the previous cycle corrections reached up to 60.5%
- In the current cycle the deepest correction so far has been around 49%
Even a further drop of 10% from here would still fall within the range of a healthy macro correction
Historically such corrections have consistently been followed by
- strong recoveries of 100%+
- and a break above the previous high
As long as structure holds - this remains a correction within a bullish trend

the chart doesn’t care about your fear.( repost, original post on my old account: @notoriousbids )
---
this is not your average joe count.
i’m not telling you that btc is going to 185k.
the chart is.
out here, we close our eyes, take a breath to clear the mind, and when our eyes open, we look at what is in front of us without bias.
the chart in front of me looks very constructive. from the lows at $15,460, btc appears to have advanced in a clear three wave move. wave three just printed an extension, which is common in crypto. if you look closely, the sub-waves of wave one and wave four show no overlap. sub-wave one itself extended, giving wave three a contracting appearance, but this was not a contraction. this was a manipulated pause, designed to re accumulate supply during wave four.
while you sell and flip bearish, there are entities out there with capital that dwarfs the entire market cap of your bitcoin, quietly absorbing every coin you are willing to give up at these discounted levels.
---
wave fours are notorious for producing fear, uncertainty, and doubt. however, we have something on our side that neutralizes that noise completely. it is called the law of alternation.
in elliott wave theory, the law of alternation states that if wave two is flat, wave four will be sharp (and vice versa). that is exactly what played out. wave two in 2023 was flat and corrective by nature, which opened the door for the sharp wave four we have been experiencing in the modern day.
---
during this sharp wave four, a significant hidden bullish divergence formed between the wave two low and the wave four low, as shown on the chart. this hidden bullish divergence exists across multiple timeframes and on several oscillators, even on the monthly scale. that alone suggests that my 185k upside target may actually be conservative.
don’t ask me how high i think this can go.
the answer will sound unreasonable to anyone still anchored to fear.
---
🎯 = 185k

CRYPTO TOTAL MARKET CAPCRYPTO TOTAL MARKET CAP – Small Update 📊
The market is compressing inside a falling wedge.
A breakout above the trendline could trigger a strong move toward $4.0T–$4.4T.
Holding the lower support keeps the bullish scenario intact; rejection may cause short-term consolidation.
DYOR | NFA.

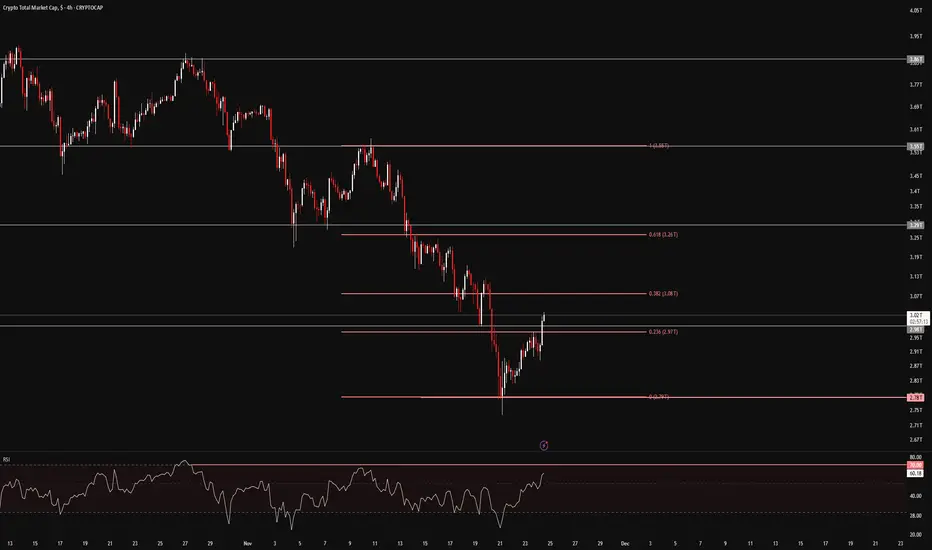
FireHoseReel | TOTAL3 Consolidation Signals the Next Market Move🔥 Welcome To FireHoseReel !
Let’s dive into Crypto Total Market Cap Excluding BTC & ETH (TOTAL3) analysis.
👀 TOTAL3 4H Overview
TOTAL3 is currently moving inside a 4-hour range, and the top 10 coins in the market are also consolidating within this box. From a pure supply–demand perspective, a breakdown below the range low could apply further downside pressure to this index and trigger broader weakness across the top 10 coins.
✍️ TOTAL3 Trading Scenarios
🟢 Long Scenario:
A breakout above $900B can act as an alert zone for the first bullish wave in the market. Setting an alert around this level allows you to stay engaged if upside momentum starts for top-tier assets.
🔴 Short Scenario:
A breakdown below the range low could increase selling pressure across the market, leading to stronger capital outflows from the top 10 coins.
🧠 Protect your capital first. No setup is worth blowing your account. If risk isn’t controlled, profit means nothing. Trade with rules, not emotions.

CRYPTO WORLD IN TERMS OF GOLD — HOW MUCH IS THE FISH..?!Were you ready or not a year ago, or even maybe still eye-balling on a next 'To-Da-Moon Arrow' in TT Reels/ YT Shorts...
..But the breathtaking rally in Crypto (including BTC and altcoins), as it has been discussed in previous ideas (see related publications), is coming to an end as in the expected horizon could be seen a decline of 99% or more (again and again).
And this isn't another attempt to sell you a cold, rock-bottom floor. The star kids aren't prepared for the fact that not just a bottom is coming for Crypto, incl BTC and altcoins everywhere, but a bottom with no hope of recovery.
They're repeatedly experiencing losses of up to 90% or more on their crypto accounts due to investments in sh#tcoins (whose dominance is declining throughout 2025, reaching a new 8-year low in October).
Then this number will increase to 95-100%.
Sh#tcoins, once the talk of the town (DOGE, PEPE, TON, SHIB, and many others), have been experiencing declines of between -50 and -80 percent since the beginning of 2025, while more than three-quarters of the Top 1000 coins are showing negative dynamics this year.
You may have noticed already, how the number of "crypto-peppers", "crypto-butterflies" and "crypto-pilots" has noticeably decreased recently.
But if you're still a star kid and have plenty of arguments in favor of altcoins (while still thinking we're idiots 🤭), I'll give you one important piece of advice about altcoins.
In 2013, there were fewer than 50 cryptocurrencies. By 2025, the number of cryptocurrencies had grown to over 17,000, although the exact number varies depending on whether you consider "active" or "total." While many new projects emerge, a significant number fail, and only a fraction maintain a significant presence.
Here's a more detailed breakdown:
2013: Fewer than 50 cryptocurrencies existed.
2017–2018: Fewer than 3,000 cryptocurrencies existed.
2021: The number of cryptocurrencies grew to nearly 6,000.
April 2025: More than 17,000 cryptocurrencies existed, although some sources suggest more than 37 million cryptocurrencies have been created, many of which are inactive.
This astonishing growth rate isn't good news and isn't exactly indicative of the crypto market. New cryptocurrencies are created simply to make money for their developers.
The total number of cryptocurrencies also includes many "dead" coins, including abandoned projects and scams.
All altcoins are created by "whales" using the "Pump and Dump" scheme, with strong marketing, influencers, promotion in thematic communities, and so on.
In this crypto game, it's all about money: the more you lose, the better for the whales. It would be a shame if you entered the crypto space and found yourself in a very bad casino. At least in a real casino, if you bet on red, your chance of winning is about 47%. In this bad crypto casino, if you enter and buy altcoins, you're sure to end up losing.
While everything is near all-time high, Ethereum BITSTAMP:ETHUSD - the poster child for all altcoins - has barely reached the "Double Top" technical pattern and is still struggling somewhere in the middle of the previous bear market.
The main reason so many cryptocurrencies exist is that the barrier to entry is virtually nonexistent. Anyone who wants to create a cryptocurrency can do so. Even if you have no technical knowledge, you can hire someone on Fiverr NYSE:FVRR , say, to create a cryptocurrency for $50-$100.
The main technical chart focuses on Total Crypto Market Cap CRYPTOCAP:TOTAL in terms of Gold (Kilos) FX_IDC:XAUUSDK .
The technical picture ) points to the collapse of a multi-year bubble, with the prospect of further decline.
--
Best wishes,
Your beloved @PandorraResearch Team

TOTAL Market Cap (4H) – Structure UpdatePrice has expanded lower after failing to reclaim prior range highs and remains below HTF supply.
Key observations
Clear 4H bearish MSS
Strong rejection from the bearish order block (3.10–3.18T)
Price broke below rising channel support
Previous support now acting as resistance
No bullish displacement or acceptance back above the OB
Liquidity & targets
First downside draw: 2.83T (4H bullish OB)
If that level fails → next target around 2.74T
Any reaction at 2.83T needs confirmation, otherwise continuation lower
Bias
Bearish
As long as price stays below 3.05–3.10T, downside remains likely
Pullbacks into resistance without acceptance = sell-the-rally
Only a strong reclaim above HTF supply invalidates the bearish bias
Execution note
It’s Monday, so I’m waiting for the Monday range to fully form.
I’ll only look for trade setups after the range is set and structure confirms.
Mr C

Bitcoin's massive fall to $50,000. OMGA massive bankruptcy for a strategy company with Bitcoin falling to $50,000, and this event will be the driving force behind the price explosion to $500,000 over the next 10 years, making it the biggest investment opportunity of the century. So, follow the market direction without bias and know that huge companies have gone bankrupt before with the fall of even gold, but gold has always recovered and remained a store of value, and this time it is Bitcoin's turn to test.
Patterns, fundamentals, technicals, and all indicators and oscillators confirm this scenario, so let's remain unbiased.

$OTHERS and altcoin mcap is hitting resistance zoneCRYPTOCAP:OTHERS is reaching a multi-year resistance zone.
From here, two scenarios are possible:
1️⃣ It breaks through and flips the zone into support, or
2️⃣ It gets rejected.
🔎 1H Time Frame
Price is touching the multi-year red resistance line — a key level to watch.
- Stochastic RSI is high, suggesting a possible short-term cooldown.
- However, the local structure remains bullish, showing a clear uptrend with periods of consolidation.
📆 1D Time Frame
- The trend boxes indicate that the broader, higher-timeframe trend is still bearish.
- We still have 2–3 days of Stochastic RSI uptrend, followed by about a week of downtrend.
📈 Summary
We’re seeing a bullish reaction in the short term (1H),
but the macro / higher timeframe (1D) trend remains bearish.
If I were looking for a long-term entry, I would personally wait until the 1D Stochastic RSI resets to the bottom, but in the current macro environment anything can happen — news and liquidity shocks can override technicals.
⚠️ DYOR and trade carefully.

FireHoseReel | TOTAL2 Facing Major 4H Resistance🔥 Welcome to FireHoseReel !
Let's dive into total2 market structure.
👀 TOTAL2 4H Analysis
TOTAL2 has reached its four-hour resistance around the one point two four level and is currently showing a clear reaction and rejection from this zone. This resistance can act as a key barrier for Ethereum and ETH-based altcoins, and a breakout above it could activate their long triggers. A descending trendline has already been broken, and then TOTAL2 hit this resistance with a strong whale-sized bullish candle, which clearly highlights the importance of this level.
RSI Osilator📊
Now focus on the RSI oscillator: it is currently sitting near its local top, and the four-hour overbought level has reached the same area as the resistance. This creates a strong overlap between momentum and price resistance. If the RSI pushes beyond this momentum limit together with a clean breakout of the resistance zone, the market could see a much stronger acceleration.
Triggers Zone 🎯
The short trigger for TOTAL2 is located lower at the support zone. A breakdown below this area could push TOTAL2 lower and lead to a deeper market correction. On the upside, a clean break of the resistance zone would confirm bullish continuation for ETH and related altcoins.
🛞 Risk Management & Disclaimer
Please remember to always use proper risk management and position sizing. Nothing in this analysis is financial advice. The market can change quickly, so always trade based on your own strategy, research, and risk tolerance. You are fully responsible for your own trades.

TOTAL Market Cap at key support, 100 EMA + Sto/RSI = BULLISH!The Total Market Cap is holding key trendline support going back many years, including the
Covid crash. Price is also holding at the 100 Week EMA and the stochastics RSI is turning up, which has been a good predictor of price on the weekly time frame.
So I would expect some kind of a bounce here especially now that the FED watch tool is showing we're back to an 85% chance of a further rate cut in December.
However the markets are very fragile and certainly can see another deeper drop come in December possibly forcing the FED to do a additional rate cut in January.
All of this leads toward possible QE and liquidity injection into the economy which would get these markets moving again.
I can see us hitting you highs in 2026 probably kicking off around May where Jerome Powell is replaced when his term is up with a more friendly fed chairman.
And then starting the money printers back up again.
For now, at least the markets aren't bleeding and haven't broken this key Market structure.
We will know soon enough.

FireHoseReel | Crypto Cap Rising TOTAL Signals Risk On Mode🔥 Welcome FireHoseReel !
Let’s explore the latest TOTAL market setup.
👀 TOTAL – 4H Timeframe Analysis
On the 4-hour chart, TOTAL shows the overall inflow of capital into the crypto market.
Price has successfully broken the 23% Fibonacci retracement level and is now moving toward the 38% zone.
If the 38% level breaks, traders who entered from lower supports can safely add to their position.
📊 RSI Momentum Check
The RSI has crossed above its previous high and has already moved above the 50 level, showing growing bullish momentum.
The next major RSI resistance sits around 70, which aligns perfectly with the 38% Fibonacci level, creating a strong confluence zone.
✔️ Correlation With Bitcoin
TOTAL shows a clear positive convergence with Bitcoin’s chart—both have built strong support levels and are pushing upward.
Institutional investors appear to have formed a solid accumulation base in this area, and the latest confirmations indicate this zone is becoming a reliable bottom.
With capital flowing into the crypto market and Bitcoin gaining momentum, the next moves across the market could be very powerful.
🛞 Risk Management & Disclaimer
Please remember to always use proper risk management and position sizing. Nothing in this analysis is financial advice. The market can change quickly, so always trade based on your own strategy, research, and risk tolerance. You are fully responsible for your own trades.
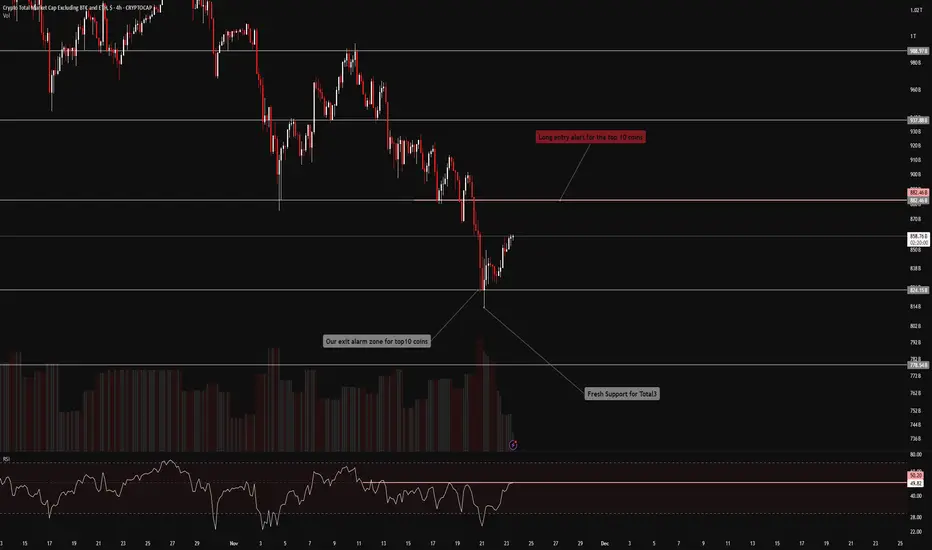
FireHoseReel | Total3: One Breakout Could Flip the Entire Market🔥 Welcome FireHoseReel !
Let’s break down what’s happening with TOTAL3 and see how the altcoin market is shaping up right now.
⭐ TOTAL3 Market Structure Update
The altcoin market (TOTAL3) has formed a solid support base around $824B after the recent pullback and is now pushing upward toward its major resistance at $882B.
A clean breakout above this zone could spark a broader bullish continuation, activate long triggers across top altcoins, and shift the market into a risk-on phase.
📊 RSI Momentum
The RSI is currently battling the 50 level, which has repeatedly acted as strong static resistance.
A confirmed breakout above RSI 50 would strengthen bullish momentum and support upward continuation — most likely during the China open session, where volatility usually increases.
🎯Impact on Top Altcoins
If USDT dominance declines, the top altcoins are likely to gain momentum quickly.
This can accelerate breakouts, create strong bullish impulses, and open up high-probability profit opportunities as liquidity rotates back into alts.
🧭 Trading Perspective
This is the kind of environment where staying close to the charts is essential.
Wait for index confirmations before entering new positions.
A potential altcoin rally could begin from these zones — and with proper risk management, layered entries across multiple altcoins can be highly effective.
🛞 Risk Management & Disclaimer
Please remember to always use proper risk management and position sizing. Nothing in this analysis is financial advice. The market can change quickly, so always trade based on your own strategy, research, and risk tolerance. You are fully responsible for your own trades.
The Brutal Math of a Bitcoin CrashThis is the brutal math of a Bitcoin crash that each one of us needs to understand.
The total crypto market cap (TOTAL) is currently ~$2.85T.
Bitcoin's market cap is ~$1.70T.
If BTC drops 50%, it loses ~$850B in value.
This would drag TOTAL down to approximately $2.00T.
The terrifying part? This means the entire rest of the market—every single altcoin from Ethereum to the smallest micro-cap—would be left with a combined market cap of only ~$300-400B to share between them.
The result would be a bloodbath of catastrophic proportions for alts. Most would see declines far exceeding Bitcoin's 50%, with many high-beta coins facing -70%, -90%, or even total collapse as liquidity evaporates.
When the TOTAL drops violently, it reveals who's swimming naked.
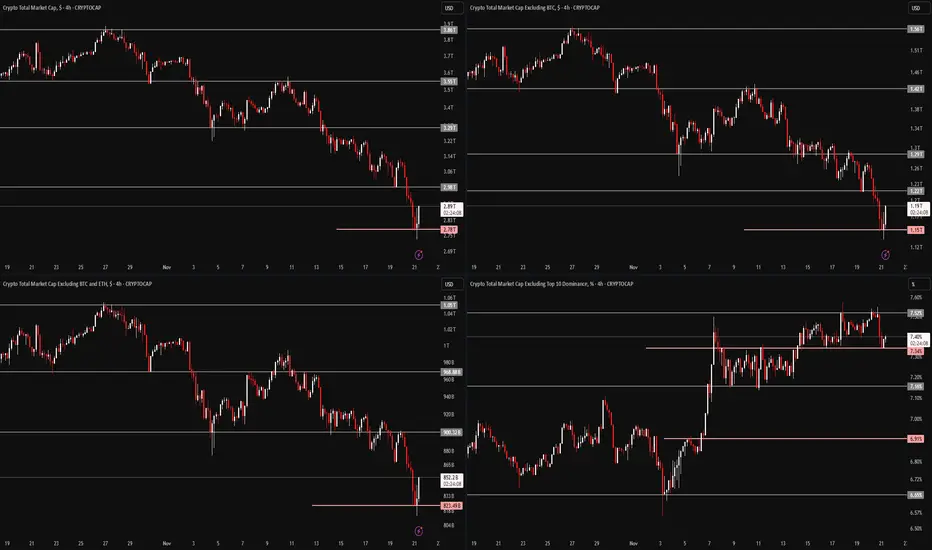
FireHoseReel | Crypto Index Overview🔥 Welcome FireHoseReel !
Let’s dive into the analysis of Four major crypto Index.
🔶 TOTAL (Crypto Market Cap) – 4H Timeframe
On the 4-hour timeframe of TOTAL, we can see a strong correlation with Bitcoin’s chart. After approaching the $4T zone, the total market cap went through a deep correction, testing multiple support levels and eventually breaking them.
It’s now sitting around $2.78T, marking a $1 trillion drop, which is something unprecedented in the crypto market.
The current support lies at $2.78T, and this level aligns closely with the upper resistance of USDT dominance, creating an important confluence. If this confluence strengthens, TOTAL may continue moving downward while USDT dominance pushes higher.
The major resistance for TOTAL is the $3T zone, and a breakout above it could create a pullback to the recent Bitcoin decline.
🔶 TOTAL2 (Altcoin Market Cap Excluding BTC) – 4H Timeframe
On the 4-hour timeframe of TOTAL2, we see a strong correlation with Ethereum’s chart.
TOTAL2 dropped from around $1.5T down to nearly $1T, following the recent sell-off in Bitcoin and Ethereum. It tested its supports and eventually lost them.
Currently, TOTAL2 is positioned near $1.15T, and breaking below this level could lead to a deeper correction in Ethereum.
On the other hand, reclaiming and breaking above $1.22T may push TOTAL2 upward and act as an early signal for a new bullish wave (mostly a pullback) in Ethereum and its ecosystem projects.
🔶 TOTAL3 (Altcoin Market Cap Excluding BTC & ETH) – 4H Timeframe
On the 4-hour timeframe of TOTAL3, the chart aligns with the performance of the top 10 altcoins.
TOTAL3 previously hovered around $1.05T and has experienced a milder decline compared to TOTAL and TOTAL2. It is currently sitting at its major support near $832B, testing a multi-timeframe support zone.
A breakdown of this level could extend the correction across the top altcoins.
However, breaking above the $900B area could generate a pullback and corrective wave against the recent downside leg, signaling potential upward movement.
🔶 OTHERS Dominance (others.d) – 4H Timeframe
On the 4-hour timeframe of OTHERS.D, we’re looking at one of the most important crypto indicators, especially in times like this. This index helps us understand when the altcoin bull market (altseason) may begin and when it's time to start building spot portfolios.
Despite the market volatility, OTHERS.D has held itself inside a stable 4H trading range and is currently reacting to the midline of its 1H range.
If Bitcoin dominance had increased during this period, altcoins could have faced an even deeper correction. However, on-chain data shows that altcoins are receiving far more attention compared to previous years.
A breakout above 7.52% on this indicator could be an early signal of a potential upcoming altcoin bull run.
🛞 Risk Management & Disclaimer
Please remember to always use proper risk management and position sizing. Nothing in this analysis is financial advice. The market can change quickly, so always trade based on your own strategy, research, and risk tolerance. You are fully responsible for your own trades.
"Falling Knife" Stable Coins Dominance Analysis (1W)Hello everyone.
The entire crypto market is about to face a crucial decline.
There are many technical ways to show it.
I'm here today to show you one of them.
One of the best ways of examining the crypto market is checking the stablecoin dominance.
The most famous way to do it is simply looking at the USDT.D chart, which is extremely bullish right now.
The problem with that is, if stablecoin dominance is rising, it means the market is going down. Also vice versa.
We can also combine them to see more complex details to understand what is about to happen in the near future.
Right now, you're looking at the “USDT.D + USDC.D” chart, so they are combined.
The problem here is, this chart is extremely bullish on the weekly timeframe.
It means extremely bearish for the entire crypto market.
There is a very common pattern known as a “triple bottom,” which is about to break. Moreover, a broken trendline on the weekly timeframe simply means that the trend is not likely to end very soon.
We might be witnessing a very bearish market next year.
Be prepared.
Good luck.

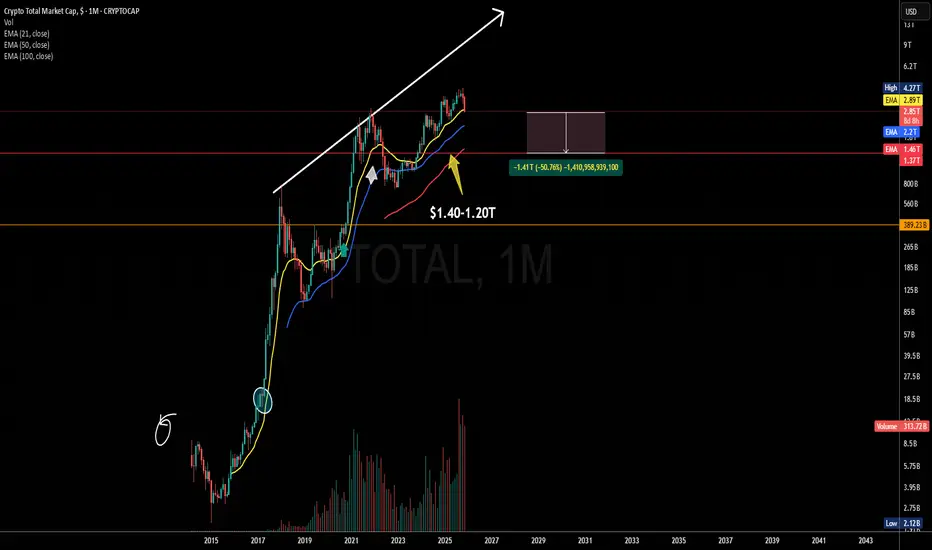
TOTAL market cap to hit all time high! 🚀 Why I believe TOTAL MARKET CAP is bottoming & gearing up for a run to new ATHs 🟢📈
After reviewing Elliott Wave counts + classical price action, the structure looks extremely constructive. Here’s why 👇
🔍 Key Reasons I'm Expecting a Major Rally:
Wave 4 appears complete 🧩
Price just tapped the long-term trendline exactly where Wave 4 should typically end — shallow, corrective, and sentiment-driven.
Clean ABC correction ✔️
The drop has formed a textbook A-B-C zigzag, with Wave C terminating right on structural support.
Approaching major long-term trendline 📉➡️📈
Total market cap is retesting a multi-year ascending trendline that has held throughout the entire macro cycle.
A bounce here would be structurally consistent with the start of a Wave 5 rally.
Wave 5 structurally due ✨
Elliott Wave theory expects a strong, impulsive Wave 5 after a clean Wave 4 retracement. These are typically high-momentum rallies.
Bullish confluence across timeframes ⏳
Daily + weekly oversold metrics line up directly at major structural support.
🔥 If this read holds, TOTAL MARKET CAP could be preparing for a rally straight into new all-time highs.

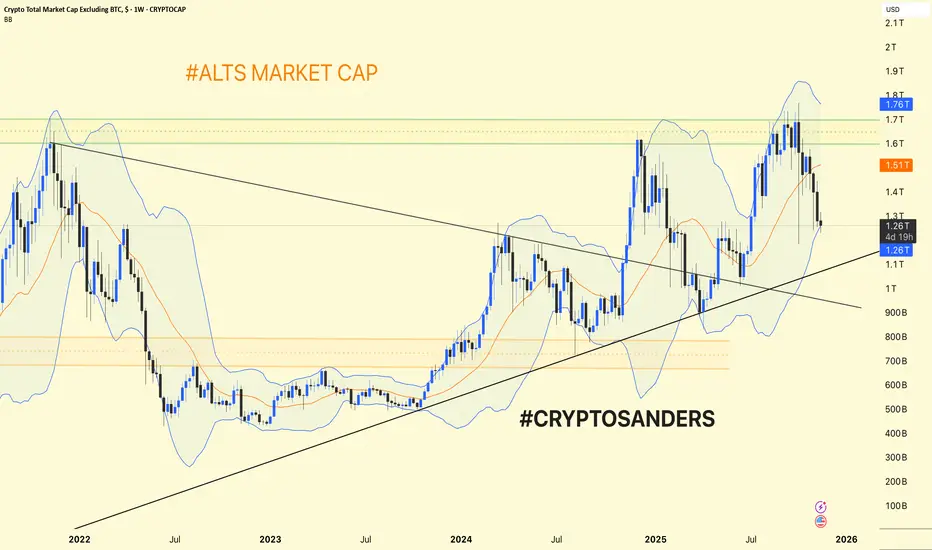
Alts Market Cap (#ALTS) Weekly Chart Update & Analysis. Alts Market Cap (#ALTS) Weekly Chart Update & Analysis
Trend Structure: The altcoin market cap (total crypto market cap excluding BTC) is trading within a broad uptrend channel after a major breakout in early 2024.
Support is currently found near $1.25T (recent swing low and channel support).
Resistance remains around $1.51T (orange line) and $1.76T (major horizontal/upper Bollinger Band zone).
Bollinger Bands: The chart uses weekly Bollinger Bands—price has pulled back from the upper band ($1.76T) and is now holding the midline ($1.26T) as short-term support.
A successful hold above $1.25T keeps the uptrend intact and sets the stage for a move back to $1.51–$1.76T.
A breakdown could lead to a deeper dip toward the long-term rising trendline (currently around $1T).
Alts are consolidating at higher lows inside an uptrend. Holding above the $1.25T area signals strength; a break above $1.51T confirms fresh upside momentum, while losing $1.25T would signal caution for further corrections.
DYOR | NFA
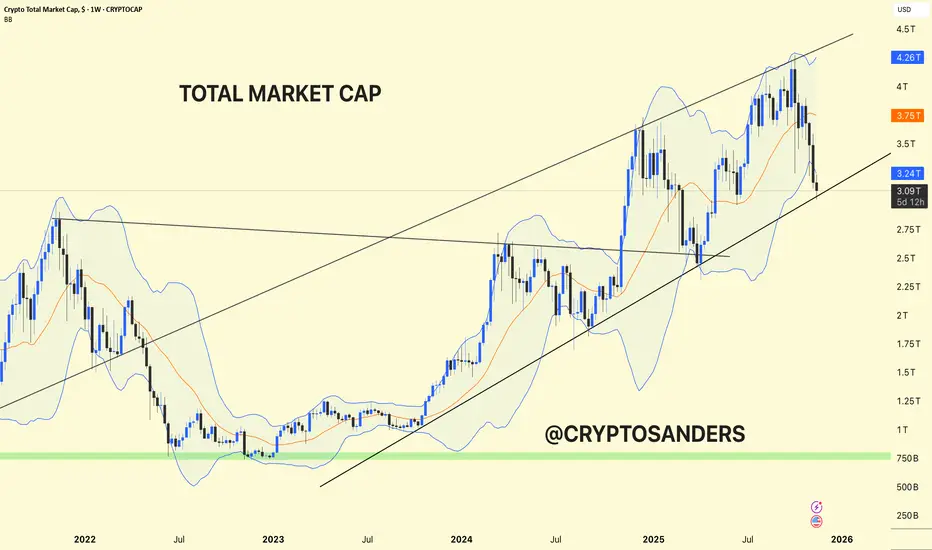
Crypto Total Market Cap. Crypto Total Market Cap – Weekly Chart Analysis & Full Update
The entire crypto market cap is trading within a large ascending channel, keeping the long-term uptrend intact.
Recent Action: After making new highs above $4 trillion, the market has corrected sharply, pulling back to the channel's lower support around $3 trillion USD. This area is a historic pivot and should act as strong support if bulls remain in control.
Upper channel resistance is near $4.4T.
Major horizontal support is well below, near $800B (green zone), but the current structure keeps the market safely above that.
A sustained break below the channel could lead to deeper retracement, while a bullish hold here sets up for another rally.
Holding this channel support can produce a recovery phase, targeting previous highs and new all-time highs.
Losing this support could trigger broader risk-off sentiment and test much lower ranges.
The crypto market is at a critical inflection—channel support is being tested after a steep correction. Staying above $3T maintains the bullish structure. Watch for a decisive bounce or breakdown in the coming weeks.
DYOR | NFA
Crypto Cycle: The Arrogance and The Irony — A Must ReadThe Cycle That Changed Everything
This cycle — which really started in October 2023 — broke every pattern from previous crypto bull runs.
Crypto was created as a rebellion:
Freedom from banks.
An anti-system technology.
Privacy.
Self-sovereignty.
A way for normal people to create wealth without permission.
And yet… somehow the exact people crypto was trying to escape have taken control of it.
Retail investors used to love the idea of owning their finances. No more banks telling them what to do. No more gatekeepers.
Until they arrived.
1 — The Arrogance
The rich run the world — that’s nothing new.
But crypto annoyed them. A lot.
Because crypto allowed ordinary people to do what Wall Street hates most:
Make money without giving the rich a cut.
So what did institutions do?
Simple:
“If you can’t kill it… own it.”
They stopped fighting crypto, took over the market, bought the exchanges, injected billions, partnered with the stablecoin printers, and unleashed industrial-scale manipulation.
The old days of making x10 or x100 on leverage?
Gone.
Retail got liquidated again… and again… and again.
Bitcoin pumped 3 times by billionaires (just look at the three green boxes on the chart).
Retail got excited — then destroyed.
Rinse and repeat.
Eventually, retail gave up.
They moved into gold, silver, or even plain USD — just to stop losing money.
Meanwhile institutions kept pumping Bitcoin and Ethereum artificially, hoping to lure back fresh meat…
but nobody came.
2 — The Irony
Then came October 11, 2025 — the day the curtain fell.
In a dry, illiquid market, Binance did their usual liquidation-hunting game, backed by newly-printed billions from Tether:
2 billion minted one day, 2 billion the next.
They pushed Bitcoin to $126,000.
Then the crash hit.
They chased longs so hard that, in a market with no liquidity, the entire altcoin market collapsed.
Some coins literally went to zero.
Binance had to halt trading.
The liquidation chain couldn’t be stopped.
Some market makers lost everything.
And now they’re furious.
Binance got exposed.
The pump-and-dump machine is broken.
And if they continue, they risk criminal investigations and lawsuits from every direction.
Suddenly BlackRock, Saylor, and friends had a problem:
Their favorite manipulation partner was knocked out.
And that’s when reality hit:
Institutions had pushed Bitcoin so high — without retail — that they found themselves holding billions in assets…
…with nobody left to buy their bags.
Old-time Bitcoin holders realized BTC was compromised and began to sell.
Bitcoin maxis rekt the institutions.
The billionaires who bought at $120k got destroyed by the exact people they planned to destroy.
Karma doesn’t miss.
Even Eric Trump started selling — too late.
Bitcoin fell under $89k, and there were no buyers left.
3 — The Lesson
Institutions need to understand one thing:
Crypto is not for institutions.
The tech? Sure.
The coins? No.
Crypto without retail is like a vampire trying to drink its own blood.
Pointless and self-destructive.
And retail won’t return for “fractional Trump coin” or corporate-approved BTC.
Retail wants:
x10, x100, x1000.
That means one thing:
ALTSEASON.
If institutions want liquidity to exit, they must engineer an altseason and share some profits.
Because without retail, they’re stuck in their expensive echo chamber holding overpriced bags that nobody wants.
And if they do create an altseason?
Retail will dump on them harder than ever — watching TradingView and influencers, selling every rally right back into the institutions’ faces.
Wall Street, stick to Wall Street.
Leave crypto to the crypto degenerates.
It’s a wild jungle, and you were never prepared.
#CryptoCycle #BitcoinCrash #AltseasonWhen #CryptoHumor #MarketManipulation #InstitutionsRekt #BinanceDrama #RetailVsWhales #CryptoReality #KarmaInCrypto #CryptoStory #PattayaCryptoDegens
