COPPER / GOLD & ISM PMI = Critical For AltseasonBeen seeing a lot of commentary on COPPER / GOLD.
This is a strong indication of industrial growth in the economy, as the demand for copper rises with build-outs.
The ISM PMI has a very strong correlation with C/G, also showing strength in the economy, as consumers buy more which gives businesses the ability to expand operations.
In a nutshell, these charts portray “Retail” ie “Main Street”.
There’s a very real possibility that we do not get our typical Alt Season at all this cycle if C/G & ISM PMI do not have a violent move up in the next few months. (more on this later)
The last time we saw such a divergence between these two was in January 2016 where it took C/G ~230 days to turn-up.
This would put Alt-Season Q4 ’26 - Q1 ’27, which makes sense theoretically based on Trump’s suspected stimulus plans which would come right before mid-terms.
This would give us our typical year-long bear market which has snuck up on us all because we lacked the retail euphoria phase due to very weak retail participation.
HOPIUM:
In 2016 When the ISM climbed above 50, COPPER soon found a bottom and Alts ripped.
Notice the bullish divergence on the RSI during that time, same as we are seeing now.
It looking like C/G may have found a bottom on this multi-decade parallel channel.
*Our livelihood depends on the ISM showing immense strength in the coming months so that C/G can follow.
Total2btc

ALTS MARKET CAP 12 HOURS UPDATEHi guys, This is CryptoMojo, One of the most active trading view authors and fastest-growing communities.
Do consider following me for the latest updates and Long /Short calls on almost every exchange.
I post short mid and long-term trade setups too.
Let’s get to the chart!
I have tried my best to bring the best possible outcome.
TOTAL 2 UPDATES:
total 2 is making this big EXPENDING channel pattern, currently, it looks like it is going to retest the lower support.
we can bounce from the lower support of this channel so let's see how it goes.
RSI is showing some bearish divergence move.
if it breaks the lower support of this channel then the chart will be invalided
This chart is likely to help you in making better trade decisions if it did consider upvoting this chart.
Would also love to know your charts and views in the comment section.
Thank you

IS ALTSEASON OVER ?Hi guys, This is CryptoMojo, One of the most active trading view authors and fastest-growing communities.
Do consider following me for the latest updates and Long /Short calls on almost every exchange.
I post short mid and long-term trade setups too.
Let’s get to the chart!
I have tried my best to bring the best possible outcome in this chart, Do not consider it as an
My previous total 2 charts are going wall currently It is lying on the support of this UPPER SUPPORT LEVEL OF THIS SYMMETRICAL TRIANGLE PATTERN.
MACD crossover is showing BULLISH momentum. RSI has entered the oversold region.
This chart is likely to help you in making better trade decisions if it did consider upvoting this chart.
Would also love to know your charts and views in the comment section.
Thank you

TOTAL MARKET CAP 12 HOURS UPDATE Hi guys, This is CryptoMojo, One of the most active trading view authors and fastest-growing communities.
Do consider following me for the latest updates and Long /Short calls on almost every exchange.
I post short mid and long-term trade setups too.
Let’s get to the chart!
I have tried my best to bring the best possible outcome in this chart, Do not consider it as an
My previous total 2 charts is going wall currently It is lying on the support of this EMA.MACD crossover is showing bearish momentum. RSI has entered the oversold region. We've to wait for a sustained breakout/breakdown to confirm the next move of ALTS.
This chart is likely to help you in making better trade decisions, if it did do consider upvoting this chart.
Would also love to know your charts and views in the comment section.
Thank you

ALTS MARKET CAP ANALYSIS Welcome to this quick update, everyone.
If you are reading my updates for the first time do follow me to get more complex charts in a very simplified way.
I also post altcoin setups on Spot, Margin, and Futures.
I have tried my best to bring the best possible outcome in this chart.
The total market cap bounces from the support level or I think the price can pump from here up to 2T and MACD is making some similar pattern.
What's your thought on this?
Do hit the like button if you like this update and share your views in the comment section.
Thank you
#PEACE

TOTAL2 The PullbackThe pullback exhibited within the bull run comparing to points in the previous bull run

TOTAL2/BTCUSDTOTAL2/BTCUSD has reached its previous ATH and correction is happening right now. Short term bearish possibility.

Bullflag TOTAL2On the weekly chart a bullflag has formed and seemingly is breaking out
TOTAL2 is the altcoin market
I recommend ETH for an alt buy, the NFT craze might produce some results for ETH
Lets go, HIGHER!
Here is where I think the market will TOP

Total2 - What Happens Next? Hi, this is my new analysis on crypto total market cap exclude BTC. Right now we are in good formation, the support level 495-500B was very strong. Now we have to check if we can get through the resistance 575B, if we do so, we are going to takeoff. But if we get rejected then we are going to make (head and shoulder bottom) and that is a good sign, for a bullish momentum. So be patient and don’t panic 🙌🏼 100% Bullish 🚀

#ALTMARKETCAP on Support! Keep CALM!Welcome to this quick update.
ALTMARKET CAP : Reason I have been covering this up again and again and not just a particular coin is the growth of every altcoin depends on this chart.
If it's bullish every altcoin will pump some more some less.
So keep an eye on TOTAL2 So far all looks good.
Daily must close above $508 BILLION rather I would say above 50D MA to continue to the upside.
Be cautious with altcoins, even I am holding some trades in which I forgot to put SL's (I know some of you did that too, it hurts ).
Currently the chart is holding both the MA and the support line.
Need to be careful with BTC.
Stay tuned

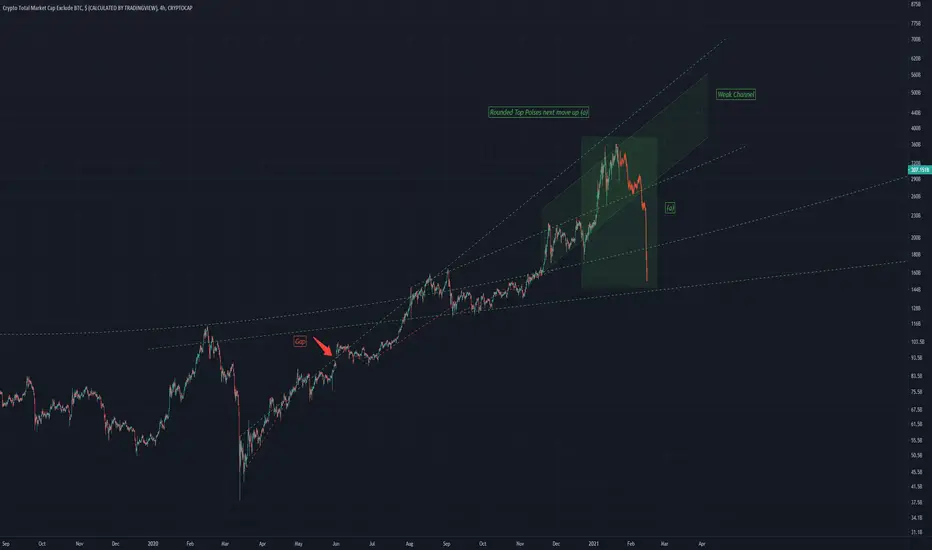
TOTAL2 Short Term Bearish ScenarioA bearish short term, ultra bullish longterm scenario
The drop forming a rounded top
Allowing a way higher move up
Alt Season HopiumThis time it's different?
Not much to say about this, but if Alt Season doesn't happen here, then I don't know when or if it'll ever happen again!
