ALTS MARKET CAP – Weekly Chart Update. ALTS MARKET CAP – Weekly Chart Update.
Altcoin market cap is respecting a rising support trendline, keeping the higher-low structure intact.
The recent pullback looks corrective, not a breakdown — price is consolidating above trend support.
Major liquidity zone/resistance sits around the 1.6T–1.7T area, where supply previously entered.
Holding above the 1.1T–1.2T base keeps the long-term bullish structure valid.
Support holds → continuation move toward 1.6T+, opening room for a fresh alt expansion.
Clean breakout & acceptance above resistance → strong altseason acceleration.
Loss of trendline → deeper range consolidation before next leg.
Altcoins are building strength quietly. Patience near support often precedes impulsive upside moves.
Focus on structure, not noise.
Not financial advice.
Total3

TOTAL MARKET CAP Chart Update. TOTAL MARKET CAP
Total crypto market cap is trading inside a rising parallel channel, maintaining the broader uptrend.
Price recently reacted from the lower channel support, indicating dip-buying interest.
The 100 MA and 25MA / dynamic average zone is acting as a key reaction area holding above it keeps structure healthy.
Previous rejections near the upper band highlight where profit booking usually starts.
Above channel support → Bullish continuation toward mid–upper channel levels.
Break below support → Short-term weakness, deeper pullback possible before next expansion.
As long as TOTAL holds the 3.0T–3.1T support zone, the broader market structure remains constructive, favoring gradual upside.
Watch weekly closes for confirmation.
Not financial advice.

Market Makers in Action on TOTAL 3 (1D)This index is one of the most important tools for predicting whether altcoins are about to turn bullish or not. Based on the structure it has formed we believe we are currently looking at a symmetrical pattern and it appears we are at the end of wave H.
On the chart we have highlighted two key demand zones that could potentially mark the completion of wave H. These zones are critical because they show where buying pressure is likely to step in potentially setting the stage for the next bullish wave.
Looking ahead wave I could provide a strong bullish move over the next few months offering significant opportunities for traders who are paying attention to the right levels.
It is crucial to monitor the two green levels closely they are not just arbitrary lines but a roadmap to decoding market maker activity. Market makers often manipulate price by pushing it up and down within certain ranges to accumulate liquidity shake out weak hands and set the stage for the next major move. By keeping a close eye on these levels you can better anticipate where the market may turn and position yourself strategically.
We have also identified two targets for wave I clearly marked on the chart which can serve as realistic goals for traders planning their entries and exits.
Now it is a matter of patience and observation lets watch and see how this unfolds. Traders who understand these patterns and market maker behavior will have a significant edge in navigating the altcoin market during this phase.
If you have a coin or altcoin you want analyzed, first hit the like button and then comment its name so I can review it for you.
This is not a trade setup, as it has no precise stop-loss, stop, or target. I do not publish my trade setups here.

ALTS - TOTAL 3 : similarities; bull balls caseALTS - TOTAL 3 : similarities; bull balls case
yeh.. maybe. looks similar macro wise there on momentum patterns
hopefully some dumbshites dont ruin the party. you prob know the global characters and issues im talking about right now.
gl

OTHERS.D (3D) — Structural Outlook and Scenarios (TOTAL-TOP10)On the chart global horizontal support and resistance zones are marked.
From the ATH on January 16.2022, USDT.D has been moving within a global descending channel. Inside this structure, we can observe two completed triangles and potentially the formation of a new triangle boundary.
The yellow zone of the global descending channel is a key zone of uncertainty.
The price reaction to this area will determine the future direction of the move.
Each triangle contains its own internal descending channel, along which price has been developing.
Historically, a breakout from an internal channel within a triangle tends to push price toward the resistance of the larger global descending channel.
-Bullish Liquidity Injection Scenario:
If the market experiences strong liquidity inflows, USDT.D may:
+Break above the internal descending channel
+Then attempt a breakout above the global descending channel
+In this case, price could move toward targets 1 → 2 → 3 → 4
Target interpretation:
1–2 (green/yellow zones): most probable and structurally justified
3: higher-risk extension
4: extreme / euphoric target with the highest risk
-Bearish / Weak Momentum Scenario
+If price fails to break out of the internal channel and instead gets rejected:
+A pullback toward the lower boundary of the internal channel becomes likely
+This scenario currently has an estimated probability of ~20%
At this stage, the structure suggests a higher probability of a breakout from the internal descending channel toward the outer (global) channel, rather than a deep corrective move.
However, all scenarios remain valid until a decisive structural break occurs.

Is This Chart Signaling the Next Alt Season?Hello,
If you want to recognize an alt season early, watch this chart: *TOTAL3-USDT/BTC*. It tracks the total market cap of all cryptocurrencies excluding Bitcoin and Ethereum, priced in Bitcoin terms. When this line rises, it means alts are gaining strength against BTC—the classic fingerprint of an alt season in the making.
Right now, we’re seeing consolidation after a prolonged downtrend, hovering around the 0.30s level. This isn’t just noise—it’s accumulation. Historically, breakouts from this pattern lead to powerful alt runs, especially when combined with a macro tailwind.
And that tailwind is forming. With interest rates poised to decrease, liquidity begins flowing back into risk assets. Lower rates mean cheaper money, which often moves from stablecoins and Bitcoin toward higher-growth, higher-beta altcoins. This cash rotation is the engine of an alt season: money seeking opportunity, narrative, and momentum.
Watch for a sustained move above 0.60—that could be your signal. Until then, hold support at 0.20s-0.30s and keep an eye on Fed policy and Bitcoin dominance. When this chart turns up, it’s not just a technical move—it’s a liquidity shift.
Trade wisely. Follow the flow.

4 X Crypto TOTAL charts showing direction of positive investmentThese charts use the " RK's 10 ∴ MA Types Ribbons (Fibonacci, Guppy and others) " indicator in TradingView.
It is simply SUPERB and is unparalleled.
So, to business. These are all WEEKLYc harts from early 2021 to current date
Top Left TOTAL chart - Top Right TOTAL2 (Excluding Bitcoin)
Bottom Left TOTAL3 ( Excluding BTC & Eth ) - Bottom right OTHERS ( Top 125 coins minus top 10 by Market Cap )
We also see the Bollenger Bands in these Charts, the orange line being the BASIS line of that indicator, an average of movement.
You will notice the vertical dashed line on the ATH from 2021, there as an anchor to work from...a Data point.
First thing to notice, NO ALT SEASON after that date. Investment reduced Drastically.
And we can see as we move to the right of these charts No ALT Season after each "Peaks" in this cycle.
Infact, if we look at these 3 Peaks this cycle, there is a Notable difference between the TOTAL chart and the OTHERS chart.
It is only in the TOTAL and TOTAL 2 charts ( Top line ) that we see the 3rd peak being higher than the previous peaks. A Close call on the TOTAL 2
From the TOTAL 3 and OTHERS charts, we see that 3rd peak lower than the 2nd.
To remind, TOTAL 3 is all crypto MINUS BTC and ETH -> OR, to put it another way, ALL ALTS
The OTHERS are the Mid to Low Cap ALTS>.....
Both of these Groups of Crypto have seen REDUCED investment than previously..
The TOTAL chart has the greatest level of stability, with shallower Dips between the Peaks than the TOTAL2 etc
To remind, TOTAL 2 is all Crypto minus Bitcoin.
So we can understand that BITCOIN is what brought that stability to the Market.
This can all be seen Faily quickly by looking at the BASIS line of the Bollinger Bands.
The Sad thing is, there are still people waiting for ALT Season.....
As with the DOT COM Bubble, we had the Rush of ALTS previously and now, The Crypto market is shedding so many CRAP coins.......
It is simply how things work, EVERY TIME
Trade Safe and Happy Holidays to you all

TOTAL3TOTAL3 has reached to a very important support, which is the 61% of Fibonacci as well. We possibly can see a good bounce from this area.

CRYPTO TOTAL MARKET CAPCRYPTO TOTAL MARKET CAP – Small Update 📊
The market is compressing inside a falling wedge.
A breakout above the trendline could trigger a strong move toward $4.0T–$4.4T.
Holding the lower support keeps the bullish scenario intact; rejection may cause short-term consolidation.
DYOR | NFA.

ONE Chart. SIX targets. Thats HYPE!The hyperliquid chart is showing signs of a head and shoulders pattern.
#HYPE has certainly garnered significant attention and acclaim for being one of the few altcoins to experience a surge this cycle.
This is due to the development of an innovative product: a decentralized perpetual DEX.
It has achieved product-market fit.
Receiving considerable attention on X.
However, it is not larger than the ongoing cycle.
At one point, they were purchasing $83M worth of tokens each month—this is why it has created a distorted head and shoulders pattern with multiple necklines.
Yet, in the world of crypto, if you develop something useful,
the code, idea, or platform will inevitably be replicated.
This highlights the fundamental issue with altcoins: the absence of a competitive moat and long-term sustainability.
Recently, they began unlocking a substantial amount of tokens, and it is likely that the team is offloading them through OTC transactions.
While innovation and profitable dapps are commendable... they can also become problematic.
Here are some bear targets for your consideration.
Which you can use to your advantage on their perp DEX ;)

FireHoseReel | TOTAL3 Consolidation Signals the Next Market Move🔥 Welcome To FireHoseReel !
Let’s dive into Crypto Total Market Cap Excluding BTC & ETH (TOTAL3) analysis.
👀 TOTAL3 4H Overview
TOTAL3 is currently moving inside a 4-hour range, and the top 10 coins in the market are also consolidating within this box. From a pure supply–demand perspective, a breakdown below the range low could apply further downside pressure to this index and trigger broader weakness across the top 10 coins.
✍️ TOTAL3 Trading Scenarios
🟢 Long Scenario:
A breakout above $900B can act as an alert zone for the first bullish wave in the market. Setting an alert around this level allows you to stay engaged if upside momentum starts for top-tier assets.
🔴 Short Scenario:
A breakdown below the range low could increase selling pressure across the market, leading to stronger capital outflows from the top 10 coins.
🧠 Protect your capital first. No setup is worth blowing your account. If risk isn’t controlled, profit means nothing. Trade with rules, not emotions.

TOTAL MARKET CAP. The total crypto market cap is still in a strong weekly uptrend, currently bouncing off the main ascending channel support and trading around the 3.1T area.
The price has respected the long-term ascending channel since 2023, and the recent correction from the 4T+ highs has so far held at the lower trendline and within the Ichimoku cloud, keeping the macro bullish structure intact.
Recent weekly candles show a rejection wick at the channel support, followed by a positive reaction, indicating that buyers are defending this zone rather than a complete breakdown occurring.
DYOR | NFA

TOTAL3 Market Cap (Crypto Total Market Cap Excluding BTC and ETHTOTAL3 Market Cap (Crypto Total Market Cap Excluding BTC and ETH).
In simple terms, this chart represents the health and trend of the Altcoin Market.
1. Market Structure: The Macro View
The chart shows a clear, long-term bullish progression within a large ascending parallel channel (the dotted upper and lower lines).
The Trend: Since 2018, despite massive volatility, the "higher lows" structure remains intact. The market is trending upward over the multi-year timeframe.
Current Location: The price is currently trading in the upper half of this channel, suggesting strong momentum but also indicating we are approaching historical resistance zones.
2. Indicator Analysis: The Gaussian Channel
The colored ribbon flowing through the price action is likely a Gaussian Channel (GC), which is a momentum indicator.
Green Band: Indicates a bullish trend. Notice how the band turned green in late 2023/early 2024. The price has been "surfing" the top of this green band, using it as dynamic support. This is a classic characteristic of a strong bull run.
Red Band: Represents the bear market (2022). The flip from Red to Green is a major "buy" signal for long-term holders.
3. Key Patterns & Breakouts
The Wedge Breakout: There are black trendlines forming a falling wedge or triangle pattern during the 2021-2023 correction. The price decisively broke out of this structure to the upside, confirming the end of the bear market.
The Dashed Resistance: There is a dashed diagonal line connecting the 2021 highs to the current price action. The market cap is currently pressing right up against this diagonal resistance. A clean break above this line is usually the precursor to an explosive move.
4. Critical Levels to Watch
Resistance (The Ceiling):
$1.13 Trillion (ATH): marked by the red horizontal line. This is the All-Time High from the 2021 peak. This is the most critical level on the chart. If TOTAL3 breaks and closes above $1.13T, the market enters "Price Discovery," which is often when the most aggressive "Altseason" rallies occur.
Current Support (The Floor):
The Green Ribbon (~$700B - $800B): If the price gets rejected at the current resistance, it will likely pull back to test the top of the green Gaussian band. As long as the price stays above the green band, the macro trend remains bullish.
Summary
The chart depicts an Altcoin market that has successfully exited a bear market and is currently in a mid-cycle accumulation/markup phase.
A breakout above the dashed trendline and subsequently the $1.13T ATH level would signal the start of a parabolic phase.
The Correlation: TOTAL3 vs. ETH/BTC
There is currently a massive divergence:
TOTAL3 is attacking ATHs ($1.13T).
ETH/BTC is at multi-year lows.
This divergence is bullish for ETH. It implies that the Altcoin rally has been driven by "Others" (Solana, mid-caps, etc.), and capital has not yet rotated back into Ethereum. When TOTAL3 breaks its resistance (the dashed line in your image), profits typically rotate from high-risk alts back into ETH, causing the ETH/BTC pair to launch vertically from this 0.035 support.
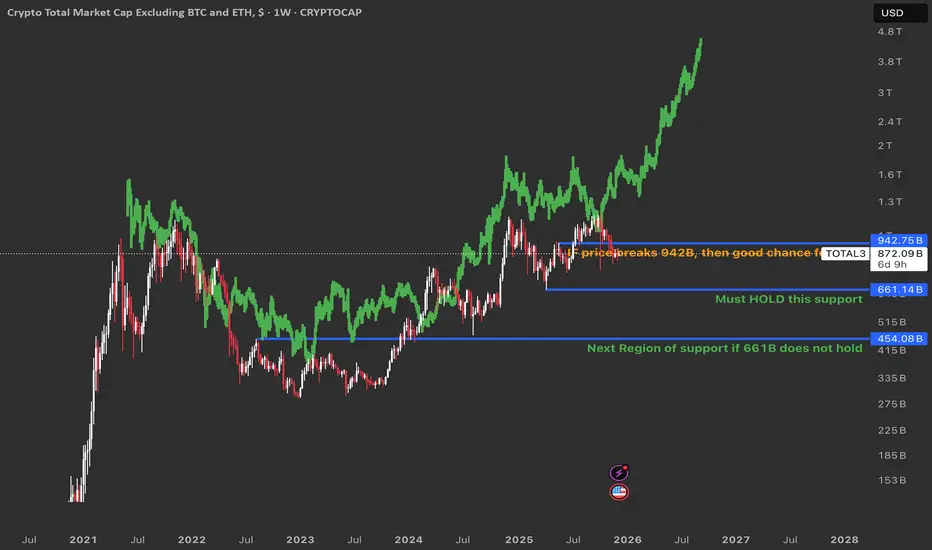
TOTAL3: Altcoin Market At A Big Decision PointThe green line is a fractal of gold’s price from 2011–2020, meaning the altcoin market is moving in a very similar pattern to how gold moved back then.
Scenario 1: Break above 942B 🚀
If TOTAL3 breaks and holds above 942B, it means buyers are strong and the market is likely ready for a big altcoin bull run.
In this case, there is a good chance the price action will continue to follow the green gold fractal, with higher highs and a long, powerful uptrend for altcoins.
Scenario 2: Lose 661B support 😬
If TOTAL3 falls below 661B, price can drop to the next major support area lower on the chart, where buyers previously stepped in.
This bearish scenario is less likely at the moment, but if it happens it would probably mean a deeper correction and a longer wait before a strong altcoin season returns.
ALTS HAVE ROOM TO THE DOWNSIDE.Alt's need retail participation to thrive.
If Global Liquidity tightens, #BTC rolls over into 4 year cycle lows (q4 2026)
BTC.d will rise along with Stablecoin dominance.
This inverted chart shows a well formed Head and Shoulders that is about to test again a key level of significance.
I DO NOT expect it to hold.

Understanding BTC, Bitcoin Dominance and TOTAL3 Rotations✅Bitcoin Dominance, BTC, Altcoins✅
Today, We're talking about the rotation of cash between Bitcoin and altcoins.
Imagine a pie where each slice represents a different cryptocurrency. The pie here indicates the total cryptocurrency market cap of both Bitcoin and altcoins, which can increase or decrease at any given time. In other words the TOTAL chart.
- If BTC market cap increases but altcoin market cap shrinks (relative), the pie stays the same size.
- If BTC market cap increase and altcoin market cap increases, the pie size increase and so forth.
Total Market Cap and BTC.D
At most of the key moments, we see a clear inverse relationship here. Alts drop harder than BTC, as this clearly shows. But during the cycle, investors hop on and off, injecting money into the ride (buying) and taking it out (selling). This constant movement is what keeps the crypto markets going.
Let's break it down with visuals:
Chart 1: Bitcoin
This rollercoaster represents Bitcoin's price action, and also my view on where we are in the current cycle. (I believe we're in a multimonth correction, followed by the last impulse wave up probably close to XMAS 2025 as usual). You'll need this to know where we are in the cycle right now:
Chart 2: Bitcoin & Bitcoin Dominance
This chart shows Bitcoin's dominance, which is basically its share of the total crypto market capitalization (market cap = total value of all cryptocurrencies). When Bitcoin's dominance goes up (higher on the chart), it means investors are putting more money into Bitcoin, potentially at the expense of altcoins. Conversely, when dominance goes down, it suggests capital is flowing towards altcoins. The difference is clear:
Chart 3: BTC.D vs TOTAL3
In this chart, we overlay the Total 3 Priceline (BLUE) on top of the Bitcoin Dominance chart. TOTAL3 shows us all alts except ETH.
The Bitcoin Rollercoaster and the S&P 500:
When Bitcoin surges (line goes up), it can sometimes lead to increased investor risk appetite. This might entice some investors to move funds from the S&P 500 into riskier assets like Bitcoin, potentially causing a slight dip in the S&P 500. Conversely, when Bitcoin experiences a price drop, investors might flock back to the perceived stability of the stock market, potentially causing a rise in the S&P 500.
So, is there a guaranteed CORRECTION? All the signs are proving this may be the case. By understanding the relationship between Bitcoin, altcoin prices and dominance, you can get a better sense of where the money merry-go-round might be headed.

FireHoseReel | TOTAL2 Facing Major 4H Resistance🔥 Welcome to FireHoseReel !
Let's dive into total2 market structure.
👀 TOTAL2 4H Analysis
TOTAL2 has reached its four-hour resistance around the one point two four level and is currently showing a clear reaction and rejection from this zone. This resistance can act as a key barrier for Ethereum and ETH-based altcoins, and a breakout above it could activate their long triggers. A descending trendline has already been broken, and then TOTAL2 hit this resistance with a strong whale-sized bullish candle, which clearly highlights the importance of this level.
RSI Osilator📊
Now focus on the RSI oscillator: it is currently sitting near its local top, and the four-hour overbought level has reached the same area as the resistance. This creates a strong overlap between momentum and price resistance. If the RSI pushes beyond this momentum limit together with a clean breakout of the resistance zone, the market could see a much stronger acceleration.
Triggers Zone 🎯
The short trigger for TOTAL2 is located lower at the support zone. A breakdown below this area could push TOTAL2 lower and lead to a deeper market correction. On the upside, a clean break of the resistance zone would confirm bullish continuation for ETH and related altcoins.
🛞 Risk Management & Disclaimer
Please remember to always use proper risk management and position sizing. Nothing in this analysis is financial advice. The market can change quickly, so always trade based on your own strategy, research, and risk tolerance. You are fully responsible for your own trades.

FireHoseReel | Crypto Cap Rising TOTAL Signals Risk On Mode🔥 Welcome FireHoseReel !
Let’s explore the latest TOTAL market setup.
👀 TOTAL – 4H Timeframe Analysis
On the 4-hour chart, TOTAL shows the overall inflow of capital into the crypto market.
Price has successfully broken the 23% Fibonacci retracement level and is now moving toward the 38% zone.
If the 38% level breaks, traders who entered from lower supports can safely add to their position.
📊 RSI Momentum Check
The RSI has crossed above its previous high and has already moved above the 50 level, showing growing bullish momentum.
The next major RSI resistance sits around 70, which aligns perfectly with the 38% Fibonacci level, creating a strong confluence zone.
✔️ Correlation With Bitcoin
TOTAL shows a clear positive convergence with Bitcoin’s chart—both have built strong support levels and are pushing upward.
Institutional investors appear to have formed a solid accumulation base in this area, and the latest confirmations indicate this zone is becoming a reliable bottom.
With capital flowing into the crypto market and Bitcoin gaining momentum, the next moves across the market could be very powerful.
🛞 Risk Management & Disclaimer
Please remember to always use proper risk management and position sizing. Nothing in this analysis is financial advice. The market can change quickly, so always trade based on your own strategy, research, and risk tolerance. You are fully responsible for your own trades.
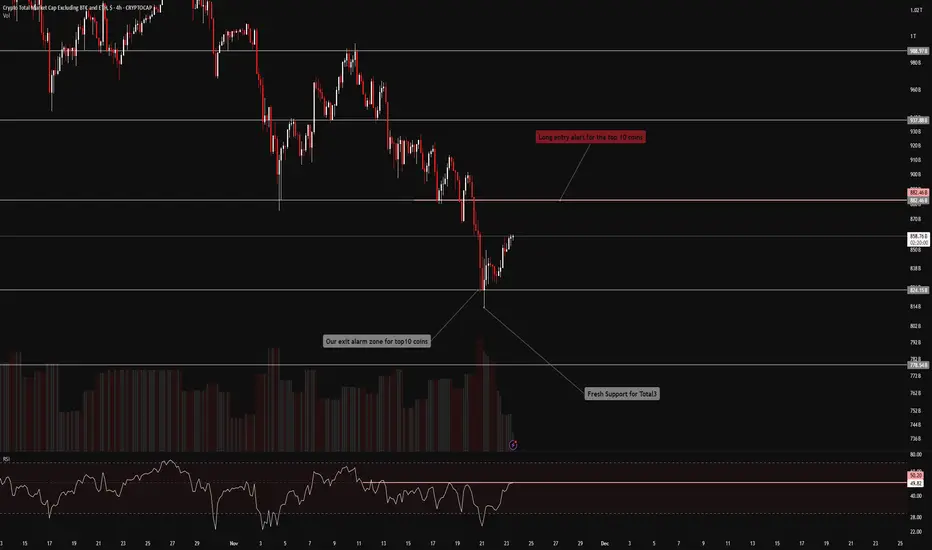
FireHoseReel | Total3: One Breakout Could Flip the Entire Market🔥 Welcome FireHoseReel !
Let’s break down what’s happening with TOTAL3 and see how the altcoin market is shaping up right now.
⭐ TOTAL3 Market Structure Update
The altcoin market (TOTAL3) has formed a solid support base around $824B after the recent pullback and is now pushing upward toward its major resistance at $882B.
A clean breakout above this zone could spark a broader bullish continuation, activate long triggers across top altcoins, and shift the market into a risk-on phase.
📊 RSI Momentum
The RSI is currently battling the 50 level, which has repeatedly acted as strong static resistance.
A confirmed breakout above RSI 50 would strengthen bullish momentum and support upward continuation — most likely during the China open session, where volatility usually increases.
🎯Impact on Top Altcoins
If USDT dominance declines, the top altcoins are likely to gain momentum quickly.
This can accelerate breakouts, create strong bullish impulses, and open up high-probability profit opportunities as liquidity rotates back into alts.
🧭 Trading Perspective
This is the kind of environment where staying close to the charts is essential.
Wait for index confirmations before entering new positions.
A potential altcoin rally could begin from these zones — and with proper risk management, layered entries across multiple altcoins can be highly effective.
🛞 Risk Management & Disclaimer
Please remember to always use proper risk management and position sizing. Nothing in this analysis is financial advice. The market can change quickly, so always trade based on your own strategy, research, and risk tolerance. You are fully responsible for your own trades.
PURE TOTAL 3 ALTCOIN INDICATOR without stable coins, BTC and ETHCRYPTOCAP:TOTAL3-CRYPTOCAP:USDT-CRYPTOCAP:USDC-CRYPTOCAP:DAI
Original idea inspired by trader SpartaBTC — highly recommend checking out his page.

TOTAL 3 New Update (1D)It appears that wave G of Total 3 has completed, and the price has entered wave H. Wave H is expected to end within the green zone, after which we’ll move toward wave I.
For now, our outlook on Total 3 remains bearish, as the strong move a few days ago and the market crash indicate the formation of new corrective waves.
A daily candle closing above the invalidation level will invalidate this analysis.
For risk management, please don't forget stop loss and capital management
When we reach the first target, save some profit and then change the stop to entry
Comment if you have any questions
Thank You

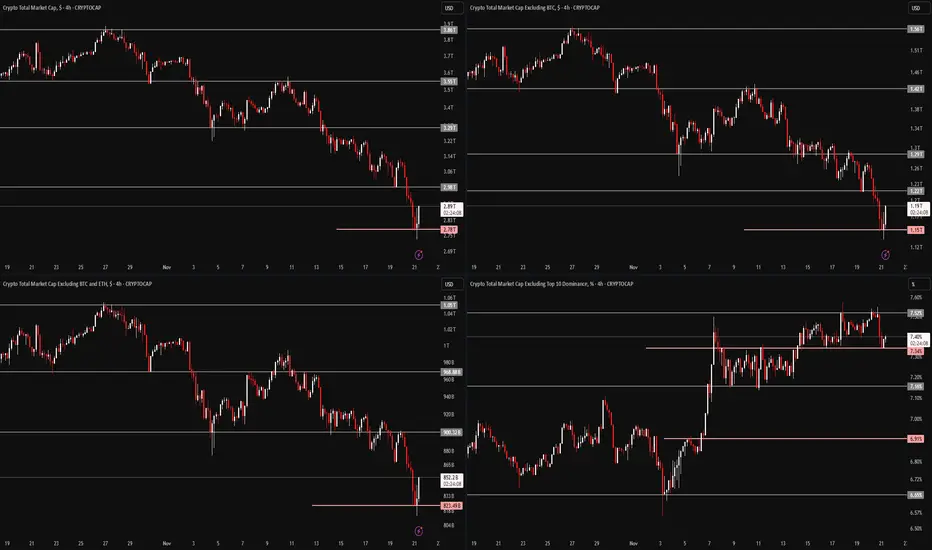
FireHoseReel | Crypto Index Overview🔥 Welcome FireHoseReel !
Let’s dive into the analysis of Four major crypto Index.
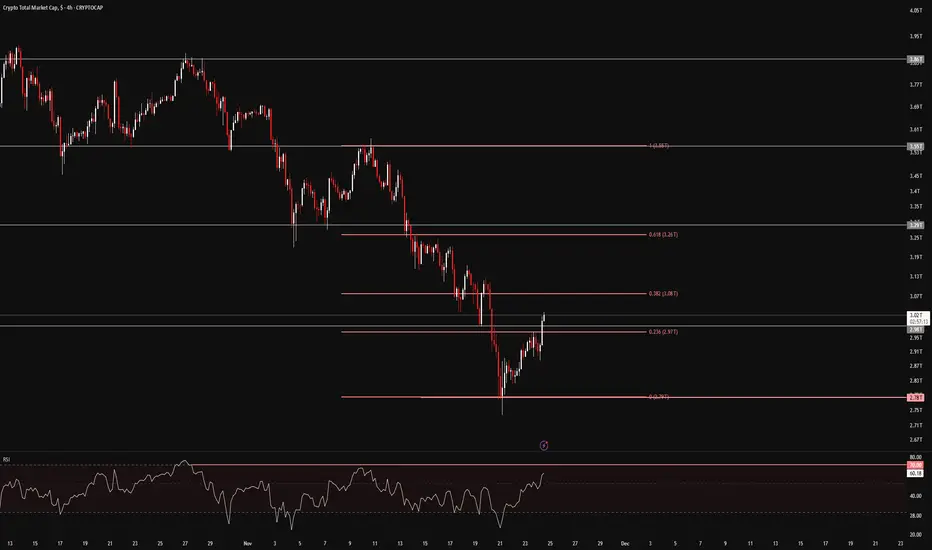
🔶 TOTAL (Crypto Market Cap) – 4H Timeframe
On the 4-hour timeframe of TOTAL, we can see a strong correlation with Bitcoin’s chart. After approaching the $4T zone, the total market cap went through a deep correction, testing multiple support levels and eventually breaking them.
It’s now sitting around $2.78T, marking a $1 trillion drop, which is something unprecedented in the crypto market.
The current support lies at $2.78T, and this level aligns closely with the upper resistance of USDT dominance, creating an important confluence. If this confluence strengthens, TOTAL may continue moving downward while USDT dominance pushes higher.
The major resistance for TOTAL is the $3T zone, and a breakout above it could create a pullback to the recent Bitcoin decline.
🔶 TOTAL2 (Altcoin Market Cap Excluding BTC) – 4H Timeframe
On the 4-hour timeframe of TOTAL2, we see a strong correlation with Ethereum’s chart.
TOTAL2 dropped from around $1.5T down to nearly $1T, following the recent sell-off in Bitcoin and Ethereum. It tested its supports and eventually lost them.
Currently, TOTAL2 is positioned near $1.15T, and breaking below this level could lead to a deeper correction in Ethereum.
On the other hand, reclaiming and breaking above $1.22T may push TOTAL2 upward and act as an early signal for a new bullish wave (mostly a pullback) in Ethereum and its ecosystem projects.
🔶 TOTAL3 (Altcoin Market Cap Excluding BTC & ETH) – 4H Timeframe
On the 4-hour timeframe of TOTAL3, the chart aligns with the performance of the top 10 altcoins.
TOTAL3 previously hovered around $1.05T and has experienced a milder decline compared to TOTAL and TOTAL2. It is currently sitting at its major support near $832B, testing a multi-timeframe support zone.
A breakdown of this level could extend the correction across the top altcoins.
However, breaking above the $900B area could generate a pullback and corrective wave against the recent downside leg, signaling potential upward movement.
🔶 OTHERS Dominance (others.d) – 4H Timeframe
On the 4-hour timeframe of OTHERS.D, we’re looking at one of the most important crypto indicators, especially in times like this. This index helps us understand when the altcoin bull market (altseason) may begin and when it's time to start building spot portfolios.
Despite the market volatility, OTHERS.D has held itself inside a stable 4H trading range and is currently reacting to the midline of its 1H range.
If Bitcoin dominance had increased during this period, altcoins could have faced an even deeper correction. However, on-chain data shows that altcoins are receiving far more attention compared to previous years.
A breakout above 7.52% on this indicator could be an early signal of a potential upcoming altcoin bull run.
🛞 Risk Management & Disclaimer
Please remember to always use proper risk management and position sizing. Nothing in this analysis is financial advice. The market can change quickly, so always trade based on your own strategy, research, and risk tolerance. You are fully responsible for your own trades.
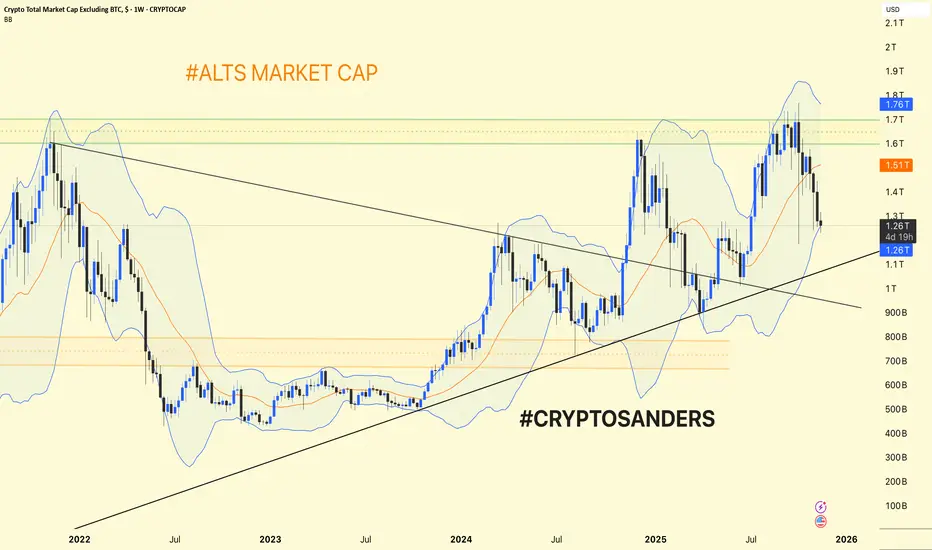
Alts Market Cap (#ALTS) Weekly Chart Update & Analysis. Alts Market Cap (#ALTS) Weekly Chart Update & Analysis
Trend Structure: The altcoin market cap (total crypto market cap excluding BTC) is trading within a broad uptrend channel after a major breakout in early 2024.
Support is currently found near $1.25T (recent swing low and channel support).
Resistance remains around $1.51T (orange line) and $1.76T (major horizontal/upper Bollinger Band zone).
Bollinger Bands: The chart uses weekly Bollinger Bands—price has pulled back from the upper band ($1.76T) and is now holding the midline ($1.26T) as short-term support.
A successful hold above $1.25T keeps the uptrend intact and sets the stage for a move back to $1.51–$1.76T.
A breakdown could lead to a deeper dip toward the long-term rising trendline (currently around $1T).
Alts are consolidating at higher lows inside an uptrend. Holding above the $1.25T area signals strength; a break above $1.51T confirms fresh upside momentum, while losing $1.25T would signal caution for further corrections.
DYOR | NFA