Whale Watching - Whale Spike Calls on Squeeze Momentum IndicatorDown for next 2 weeks.
Ran out of time in video but was going to end with ETH popping yesterday right before BTC drop was final curtain call. Then shib rocketing today was further distraction while dropping other tokens. Kindof like when CNN promoted Doge at peak in May.
Totalcap

Why Nobody Don't talk about TOTAL2 ? Potential Double TopSo many people says crypto is unpredictable actually its true but if we if we put the puzzles together we can see the picture.
You guys see market give reaction from previosly ath.
Right now we can see potential double top here so if we close daily fib 261.80 I will turn slightly bearish again.
Last support is fib 227.20
If you like this idea please dont forget to hit like button

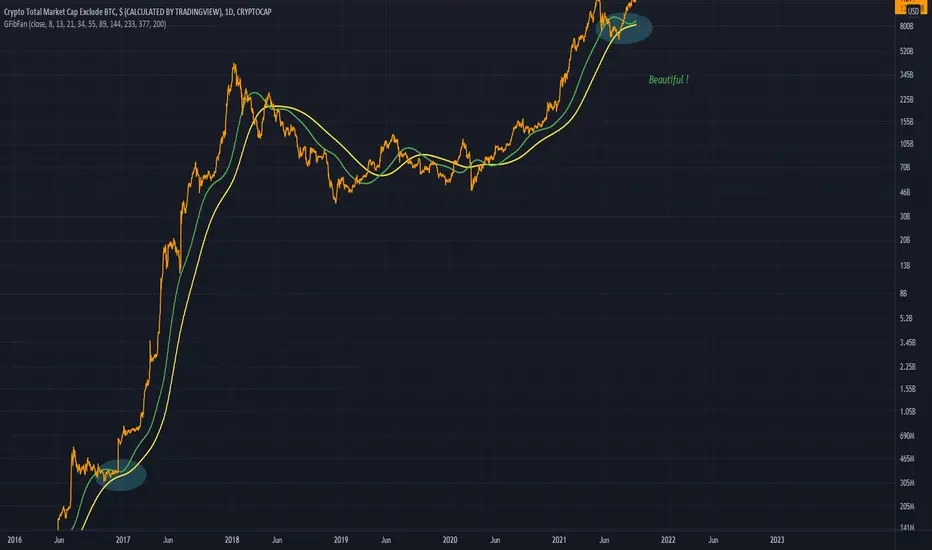
Total, Cryotocurrencies, Bitcoin, Daily Chart, BTC $Total return 26%! We love a cup and handle especially when #total is ready to take off

TOTAL2 - BIG MOMENT Hi, this is mye new update for Total Market Cap Exclude BTC. This is the moment guys, we have now completed a cup and handle pattern, in the NEXT couple of weeks we are going to see massive gains in Total Market Cap. One thing we have to notice is that the gains from bottom to previous top is 132% and from the definition of cup and handle, when we break the all time high then we are going to see another 132% gains, so be patient the new ALT season is going to start soon. I am LONG here ;)

#TOTAL WHERE WE DO GO?#TOTAL , Hello everyone, I will share the analysis of the index that measures the total size of the cryptocurrency market (which shows the total market cap of the top 125 cryptocurrencies).
2.16T is the resistance level where the sellers who turn the price direction down are more dominant. We can also call it an area of strong resistance. If the price continues to stay above the 2.16T level, a bullish structure will come, and if everything goes positive, I think the cryptocurrency market will go up to 2.45T levels and rise 13%.
How far can it go down if the price doesn't show an upward movement? When we stay below the 2T level, I expect the decline to continue and the blue zone to hold the price depending on the state of the structure.
If the price continues to drop, how far can it go down? A decrease may occur up to the gray zone just below the blue zone. I don't think we will go below this level any further.
Finally, the price has not fully determined its direction at the moment, there is no structure. It's worth waiting.

Cool Breakout Pattern TOTAL2Just observing the altcoin market rn
I see the breakout continuing
This is on a 4Hr timeframe so it doesn't really matter in the long run
thought it was cool tho
Inversely related points? TOTAL2An observation on the altcoin market
It seems we are moving in a downward fashion (still in bullrun)
Comparable to the previous markets rising fashion
Both following a large period of consolidation
We still have more exponential growth to experience

TOTAL2 An Avoided DeathcrossLooks like a very clean miss of the death cross
More bull action is coming based on this comparison to the early bull run
Looks great really
Climbing Through the Circles TOTAL2Some circles showing the intersection and connection to the circle as time passes
~2.2 years is my expectation for the current bull run
Previous bull run labelled along with the bear market also
Above is the chart analyzing how I came to the conclusion of 2.2 years

Defi is outperforming BTC!Bitcoin vs defi of the last bull run. I would wait right now and strike when the right time comes haha. USD 90%

A Major Trend Reclamation TOTAL2A major trend being reclaimed on the altcoin market
Similarities can be seen to the prior reclamation of the same trend line (in yellow box)
We are in for some more bull action..

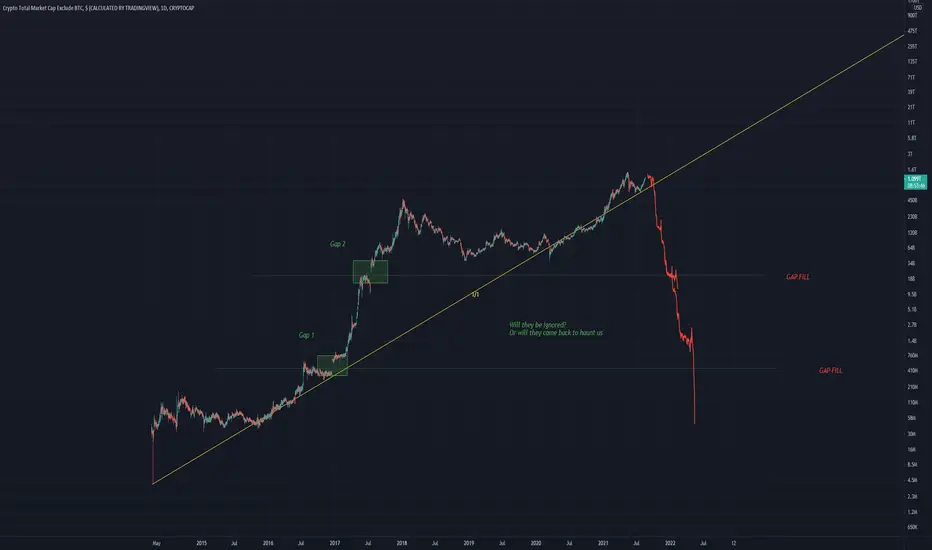
TOTALMCAP GapsWill the gaps be filled in the future with a massive bubble pop?
Or will they remain unfilled
Time will tell
Two different stories TOTAL2The log chart suggest incredible further bullish movement
While the standard chart displays a possible top formation comparable to the previous bull run
Which one do we trust?

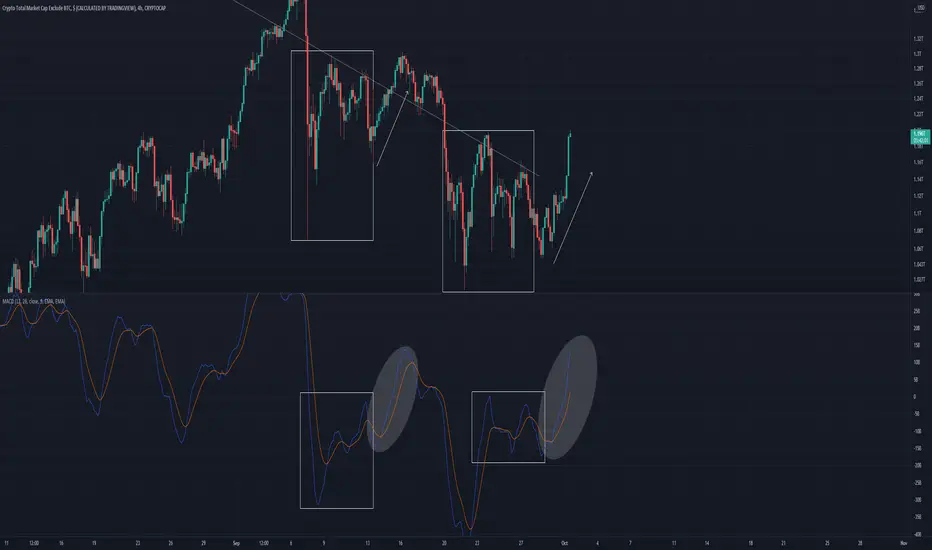
Total Market Cap - Correction? Hi, this is my new update for total market cap exclude BTC. In the last 3 weeks Total2 has risen more than 75%. We are now in a critical moment, that can give us a 30% correction. If we look at the green ellipses, then we see that every time we have risen 60-70% like a straight line, then we have had a correction between 25-35%. Don't be sad, because corrections can give us a healthier upside. I expect there is only one way to skip the correction move and that is if we clear the 70.2 % retracement level and the resistance level 1.145T, then we are good to go, otherwise we are going to see a small correction. Be patient and don't panic ;)

#TOTAL CRYPTO MCAP in Danger Position! Here's Why...Welcome to this quick Sunday update, everyone.
If you are reading my updates for the first time do follow me to get more complex charts in a very simplified way.
I also post altcoin setups on Spot, Margin, and Futures.
Let's get to the chart.
This is the total crypto market cap chart.
It's very important to follow this chart in order to understand the overall trend of the crypto market.
W have seen almost third consecutive bullish candle for BTC in weekly.
IMHO BTC needs some pullback including many other altcoins too.
I've said this before
No one got rekt by taking profits.
Although there's a chance that BTC could hit the 48k straight that won't be sustained for long.
In this chart, the mcap is hitting the most important resistance level.
If this resistance is broken and we get a daily close above the 1.84 trillion resistance (the red zone) It's highly likely we will hit the 48k -49k level on or before 15th Aug 2021 in BTC. The whole market will pump together.
The support remains from 1.53 to 1.67 trillion.
What's your thought on this?
Do hit the like button if you like this Analysis and share your views in the comment section.
It takes a lot of time and attention to create this educational content for you all to understand the market and take your trades wisely with the right information! Hit that follow button if you haven't yet.
Thank you
#PEACE

TOTAL2 Where we get super richThe covid run and post covid run completed
The formation that has been described as a 'bear market' is finally breaking out to the upside
I can't wait to see where this heads
This is the alt coin market
June 2022!

Total Marketcap breaking out...Welcome to this quick update, everyone.
If you are reading my updates for the first time do follow me to get more complex charts in a very simplified way.
I also post altcoin setups on Spot, Margin, and Futures.
Let's get to the chart.
The total market cap chart looks really bullish here after breaking the $1.4 Trillion resistance level.
By the end of this week if the Total market cap closes above $1.68 trillion it's highly likely we will see a rally towards $1.77 to $1.8 trillion which will eventually push the whole crypto market. Both Altcoins and Bitcoin will pump together.
This is a very important chart that only a few people who always want to stay ahead use.
The structure exactly looks like BTC at 36k level.
INVALIDATION: Weekly close below $1.41 trillion.
What's your thought on this?
Do hit the like button if you like this update and share your views in the comment section.
Thank you
#PEACE

Time to enter altcoins slowlyHello Traders,
I just published an idea on June 11 and warned you about the upcoming downtrend on altcoins. And, it happened. Now, it's time to enter altcoins slowly because we will see a bounce up to 50k on Bitcoin soon.
Reason: 38.20% Fibonacci reversal level (~593B). We had a bounce up from the 38.20% fib level so far.
Please like and share the idea.
Thanks.

TOTAL2 RepeatAltcoin market cap similarities obvious
Critical point approaching
will it turn out as last time? (2)

TOTAL Where we are at in the bullrunSimilar pullbacks in red
Green line is the major trendline that is holding
We are currently moving through a big fib area, which I do not think is an appropriate Top

Commence Phase 2 - TOTALAn idea for the TOTAL market cap
Phase 2 is a more aggressive bullish stage in comparison to what we have recently seen
Similar structures in green
Points of confluence in red

#ALTCOINs in Danger? Welcome to this quick update.
In my last update, I said if ALT Mcap CLOSES BELOW 738 Billion altcoins will be bearish AND YET WE SAW dump in ALTCOINS but it didn't follow how I expected.
Just shifting a few trendlines and I got the chart above.
Looks like it's still under the channel and a bounce is likely from here.
It will take some time with sideways action or even little pullbacks during the weekend.
Close below this channel could create a panic in the altcoin market with blood everywhere.
Let's hope we see a bounce from here.
Let me know your thoughts on this.
Thanks for reading, Do hit the like button if you like it and share your views in the comment section.
Thank you
Stay safe
#PEACE

TOTAL2 The PullbackThe pullback exhibited within the bull run comparing to points in the previous bull run
