TOTAL MARKET CAP – UpdatePrice is still reacting exactly as planned.
My bias remains unchanged.
3.22T remains my primary target
This level aligns with the 50% Daily retracement
Also a key area of previous liquidity + resistance
As long as price trades below this zone, this move still looks like a retracement within a higher-timeframe range, not a confirmed continuation.
Once 3.22T is tapped, I’ll re-evaluate the thesis and start watching for possible short setups, depending on reaction and structure.
No rush. Let price come to you.
What do you expect to happen at 3.22T: clean breakout or rejection?
MrC
Totalmarketcap

RENDER / USDT – Trade ideaPrice is still trading inside a range after a strong sell-off.
Market shows indecision, but structure is holding for now.
This trade is already active, based on confluence with the Total Market Cap analysis.
Market conditions align with a potential relief move, as long as structure holds.
Technical View
* Price is reacting around a key support zone
* Multiple rejections from range lows
* Break above range highs could confirm continuation
* Loss of support would invalidate the setup
Do you expect continuation from this range or a breakdown first?
MrC

TOTAL2 - Testing Trend Line Altcoin market is testing this long term up trend
Likely will be a reversal from this trend line upwards
If trend line breaks i dont think alt season is in

TOTAL Market Cap – 4H UpdateIn my previous update I highlighted a key level to watch.
That level has now been cleanly reclaimed with a strong 4H candle close, confirming strength.
Since then, we’ve seen a 50% retracement, which is a healthy pullback after the impulsive move.
With this structure in place, I’m switching my bias to bullish.
Context
Key level successfully reclaimed
Strong 4H close confirms acceptance
50% retracement completed
Multiple long setups already shared align with this higher-timeframe context
Are you positioning with the higher-timeframe bias or still waiting for confirmation? 📊👀
Please share your toughts
MrC

4 X Crypto TOTAL charts showing direction of positive investmentThese charts use the " RK's 10 ∴ MA Types Ribbons (Fibonacci, Guppy and others) " indicator in TradingView.
It is simply SUPERB and is unparalleled.
So, to business. These are all WEEKLYc harts from early 2021 to current date
Top Left TOTAL chart - Top Right TOTAL2 (Excluding Bitcoin)
Bottom Left TOTAL3 ( Excluding BTC & Eth ) - Bottom right OTHERS ( Top 125 coins minus top 10 by Market Cap )
We also see the Bollenger Bands in these Charts, the orange line being the BASIS line of that indicator, an average of movement.
You will notice the vertical dashed line on the ATH from 2021, there as an anchor to work from...a Data point.
First thing to notice, NO ALT SEASON after that date. Investment reduced Drastically.
And we can see as we move to the right of these charts No ALT Season after each "Peaks" in this cycle.
Infact, if we look at these 3 Peaks this cycle, there is a Notable difference between the TOTAL chart and the OTHERS chart.
It is only in the TOTAL and TOTAL 2 charts ( Top line ) that we see the 3rd peak being higher than the previous peaks. A Close call on the TOTAL 2
From the TOTAL 3 and OTHERS charts, we see that 3rd peak lower than the 2nd.
To remind, TOTAL 3 is all crypto MINUS BTC and ETH -> OR, to put it another way, ALL ALTS
The OTHERS are the Mid to Low Cap ALTS>.....
Both of these Groups of Crypto have seen REDUCED investment than previously..
The TOTAL chart has the greatest level of stability, with shallower Dips between the Peaks than the TOTAL2 etc
To remind, TOTAL 2 is all Crypto minus Bitcoin.
So we can understand that BITCOIN is what brought that stability to the Market.
This can all be seen Faily quickly by looking at the BASIS line of the Bollinger Bands.
The Sad thing is, there are still people waiting for ALT Season.....
As with the DOT COM Bubble, we had the Rush of ALTS previously and now, The Crypto market is shedding so many CRAP coins.......
It is simply how things work, EVERY TIME
Trade Safe and Happy Holidays to you all

TOTAL MARKET CAP (TOTAL) – UpdateTotal Market Cap tapped the 2.83T support and is now showing a potential V-shape reaction.
Market structure is still bearish (lower highs & lower lows), so downside risk remains.
However, momentum is shifting.
Key level to watch: 2.98T
A 1H / 4H candle close above 2.98T
• I will close all short positions
• Bias flips to bullish
• Looking for continuation toward higher liquidity levels
Until then: counter-trend bounce inside a downtrend.
Patience > prediction.
Is 2.98T the level that flips your bias bullish?
@mrctradinglab

TOTAL Market Cap — Still in a Bullish CycleThis idea is meant to provide perspective and a bit of reassurance during the current correction
At the moment the TOTAL still has some downside potential — roughly 11% (bottom of blue support zone =Max pain zone?)
As long as price remains above this level the market stays within a bullish/rising cycle
Only a breakdown below it would confirm a transition into a true bearish phase
For now we are still in a bullish phase and such corrections are completely normal
Looking at historically
- In the previous cycle corrections reached up to 60.5%
- In the current cycle the deepest correction so far has been around 49%
Even a further drop of 10% from here would still fall within the range of a healthy macro correction
Historically such corrections have consistently been followed by
- strong recoveries of 100%+
- and a break above the previous high
As long as structure holds - this remains a correction within a bullish trend

CRYPTO TOTAL MARKET CAPCRYPTO TOTAL MARKET CAP – Small Update 📊
The market is compressing inside a falling wedge.
A breakout above the trendline could trigger a strong move toward $4.0T–$4.4T.
Holding the lower support keeps the bullish scenario intact; rejection may cause short-term consolidation.
DYOR | NFA.

FireHoseReel | TOTAL3 Consolidation Signals the Next Market Move🔥 Welcome To FireHoseReel !
Let’s dive into Crypto Total Market Cap Excluding BTC & ETH (TOTAL3) analysis.
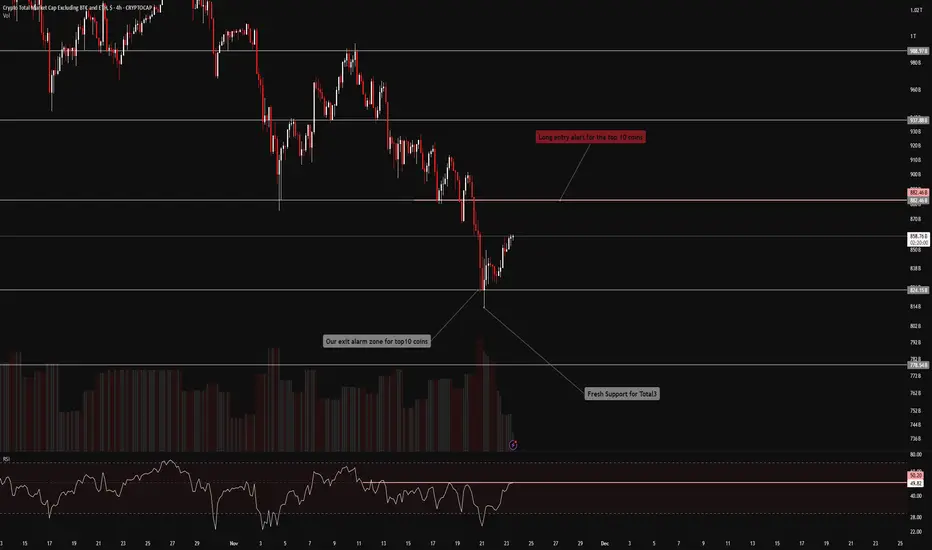
👀 TOTAL3 4H Overview
TOTAL3 is currently moving inside a 4-hour range, and the top 10 coins in the market are also consolidating within this box. From a pure supply–demand perspective, a breakdown below the range low could apply further downside pressure to this index and trigger broader weakness across the top 10 coins.
✍️ TOTAL3 Trading Scenarios
🟢 Long Scenario:
A breakout above $900B can act as an alert zone for the first bullish wave in the market. Setting an alert around this level allows you to stay engaged if upside momentum starts for top-tier assets.
🔴 Short Scenario:
A breakdown below the range low could increase selling pressure across the market, leading to stronger capital outflows from the top 10 coins.
🧠 Protect your capital first. No setup is worth blowing your account. If risk isn’t controlled, profit means nothing. Trade with rules, not emotions.

CRYPTO WORLD IN TERMS OF GOLD — HOW MUCH IS THE FISH..?!Were you ready or not a year ago, or even maybe still eye-balling on a next 'To-Da-Moon Arrow' in TT Reels/ YT Shorts...
..But the breathtaking rally in Crypto (including BTC and altcoins), as it has been discussed in previous ideas (see related publications), is coming to an end as in the expected horizon could be seen a decline of 99% or more (again and again).
And this isn't another attempt to sell you a cold, rock-bottom floor. The star kids aren't prepared for the fact that not just a bottom is coming for Crypto, incl BTC and altcoins everywhere, but a bottom with no hope of recovery.
They're repeatedly experiencing losses of up to 90% or more on their crypto accounts due to investments in sh#tcoins (whose dominance is declining throughout 2025, reaching a new 8-year low in October).
Then this number will increase to 95-100%.
Sh#tcoins, once the talk of the town (DOGE, PEPE, TON, SHIB, and many others), have been experiencing declines of between -50 and -80 percent since the beginning of 2025, while more than three-quarters of the Top 1000 coins are showing negative dynamics this year.
You may have noticed already, how the number of "crypto-peppers", "crypto-butterflies" and "crypto-pilots" has noticeably decreased recently.
But if you're still a star kid and have plenty of arguments in favor of altcoins (while still thinking we're idiots 🤭), I'll give you one important piece of advice about altcoins.
In 2013, there were fewer than 50 cryptocurrencies. By 2025, the number of cryptocurrencies had grown to over 17,000, although the exact number varies depending on whether you consider "active" or "total." While many new projects emerge, a significant number fail, and only a fraction maintain a significant presence.
Here's a more detailed breakdown:
2013: Fewer than 50 cryptocurrencies existed.
2017–2018: Fewer than 3,000 cryptocurrencies existed.
2021: The number of cryptocurrencies grew to nearly 6,000.
April 2025: More than 17,000 cryptocurrencies existed, although some sources suggest more than 37 million cryptocurrencies have been created, many of which are inactive.
This astonishing growth rate isn't good news and isn't exactly indicative of the crypto market. New cryptocurrencies are created simply to make money for their developers.
The total number of cryptocurrencies also includes many "dead" coins, including abandoned projects and scams.
All altcoins are created by "whales" using the "Pump and Dump" scheme, with strong marketing, influencers, promotion in thematic communities, and so on.
In this crypto game, it's all about money: the more you lose, the better for the whales. It would be a shame if you entered the crypto space and found yourself in a very bad casino. At least in a real casino, if you bet on red, your chance of winning is about 47%. In this bad crypto casino, if you enter and buy altcoins, you're sure to end up losing.
While everything is near all-time high, Ethereum BITSTAMP:ETHUSD - the poster child for all altcoins - has barely reached the "Double Top" technical pattern and is still struggling somewhere in the middle of the previous bear market.
The main reason so many cryptocurrencies exist is that the barrier to entry is virtually nonexistent. Anyone who wants to create a cryptocurrency can do so. Even if you have no technical knowledge, you can hire someone on Fiverr NYSE:FVRR , say, to create a cryptocurrency for $50-$100.
The main technical chart focuses on Total Crypto Market Cap CRYPTOCAP:TOTAL in terms of Gold (Kilos) FX_IDC:XAUUSDK .
The technical picture ) points to the collapse of a multi-year bubble, with the prospect of further decline.
--
Best wishes,
Your beloved @PandorraResearch Team

TOTAL Market Cap (4H) – Structure UpdatePrice has expanded lower after failing to reclaim prior range highs and remains below HTF supply.
Key observations
Clear 4H bearish MSS
Strong rejection from the bearish order block (3.10–3.18T)
Price broke below rising channel support
Previous support now acting as resistance
No bullish displacement or acceptance back above the OB
Liquidity & targets
First downside draw: 2.83T (4H bullish OB)
If that level fails → next target around 2.74T
Any reaction at 2.83T needs confirmation, otherwise continuation lower
Bias
Bearish
As long as price stays below 3.05–3.10T, downside remains likely
Pullbacks into resistance without acceptance = sell-the-rally
Only a strong reclaim above HTF supply invalidates the bearish bias
Execution note
It’s Monday, so I’m waiting for the Monday range to fully form.
I’ll only look for trade setups after the range is set and structure confirms.
Mr C

Altcoin Market Cap Building Energy Before Next ExpansionThe total crypto market cap excluding the top 10 continues to follow a familiar cycle of accumulation, breakout, expansion, and consolidation. After strong moves, the market typically ranges for a period before the next leg.
Currently, it is consolidating within a wide range, similar to past phases before major expansions. This suggests the market is building energy, not distributing.
A breakout above the range could trigger the next expansion phase for altcoins, while patience is needed until that happens.
NFA
Please hit the like button if you like it, and share your views in the comments section.

TOTAL MARKET CAP. The total crypto market cap is still in a strong weekly uptrend, currently bouncing off the main ascending channel support and trading around the 3.1T area.
The price has respected the long-term ascending channel since 2023, and the recent correction from the 4T+ highs has so far held at the lower trendline and within the Ichimoku cloud, keeping the macro bullish structure intact.
Recent weekly candles show a rejection wick at the channel support, followed by a positive reaction, indicating that buyers are defending this zone rather than a complete breakdown occurring.
DYOR | NFA

USDT DOMINANCE ANALYSIS (2D)Hello.
I'd like to share my ideas about USDT Dominance today.
When I start to analyze a chart, the first thing I do is look at past events and patterns.
As I can see, around August 2025, USDT completed its double zig-zag corrective move.
Now we're seeing that the entire market is bleeding, and of course this parameter is also moving in the opposite direction of the market.
Due to its nature, it's easy to analyze the entire market by looking at this parameter alone.
We realize that after the first change of character around the market, this parameter began forming a five-wave impulsive movement. October 10th also confirms this idea in a way.
As anyone who knows about Elliott Theory understands, there are many possibilities when a sudden crash appears in the market. That's the reason why I waited patiently to update my thoughts on this chart.
At the moment, I'm almost sure that what we're seeing here is another five-wave impulsive upward pattern.
The good news is that we are about to see this bleeding in the market come to an end.
The reason is simple: volume.
As you can examine on the chart, volume has been decreasing for days now.
Even if it's not the end of wave 5 yet, we are going to see this parameter drop significantly in the coming weeks — possibly with an A-B-C zig-zag or a double zig-zag pattern.
The orange line on the chart represents an ascending channel. When it breaks, it will also confirm a change of character in the entire market. What I expect is that when this happens, we’ll most likely see a drop of around -20% in this parameter. This will allow the market to recover from its ashes once more.
Thanks for reading.

TOTAL2 - Testing Middle Band Using this Gaussian Channel indicator it can be seen on Weekly chart that price is testing this middle line
This line has been a point of strong support and many breakouts have been seen along it
Price will likely bounce off it allowing a rally for alts

Global Long Imbalance — Structural UpdateYesterday I posted an idea describing a rare long-side imbalance detected by Long Zigg , where the 10% depth reached its maximum value of 100 several times over the past days.
This update focuses on what changed since then and how the current structure looks on the hourly chart.
Recent observations
On the chart I’ve marked all recent moments where Long Zigg = 100 .
Despite the continued price decline, the structural picture remains the same:
– The 10% depth is printing 100 again
– Limit order structure is still tilted toward buyers
– Price continues to move lower while the imbalance remains extreme
In other words, the market is showing a combination of falling price and a maximum long imbalance.
What this may indicate
Such setups often appear during periods of spot accumulation, where passive buyers continue absorbing sell pressure despite short-term declines.
This does not imply an immediate reversal, but for now the structure resembles accumulation, not panic distribution.

FireHoseReel | TOTAL2 Facing Major 4H Resistance🔥 Welcome to FireHoseReel !
Let's dive into total2 market structure.
👀 TOTAL2 4H Analysis
TOTAL2 has reached its four-hour resistance around the one point two four level and is currently showing a clear reaction and rejection from this zone. This resistance can act as a key barrier for Ethereum and ETH-based altcoins, and a breakout above it could activate their long triggers. A descending trendline has already been broken, and then TOTAL2 hit this resistance with a strong whale-sized bullish candle, which clearly highlights the importance of this level.
RSI Osilator📊
Now focus on the RSI oscillator: it is currently sitting near its local top, and the four-hour overbought level has reached the same area as the resistance. This creates a strong overlap between momentum and price resistance. If the RSI pushes beyond this momentum limit together with a clean breakout of the resistance zone, the market could see a much stronger acceleration.
Triggers Zone 🎯
The short trigger for TOTAL2 is located lower at the support zone. A breakdown below this area could push TOTAL2 lower and lead to a deeper market correction. On the upside, a clean break of the resistance zone would confirm bullish continuation for ETH and related altcoins.
🛞 Risk Management & Disclaimer
Please remember to always use proper risk management and position sizing. Nothing in this analysis is financial advice. The market can change quickly, so always trade based on your own strategy, research, and risk tolerance. You are fully responsible for your own trades.

TOTAL Market Cap at key support, 100 EMA + Sto/RSI = BULLISH!The Total Market Cap is holding key trendline support going back many years, including the
Covid crash. Price is also holding at the 100 Week EMA and the stochastics RSI is turning up, which has been a good predictor of price on the weekly time frame.
So I would expect some kind of a bounce here especially now that the FED watch tool is showing we're back to an 85% chance of a further rate cut in December.
However the markets are very fragile and certainly can see another deeper drop come in December possibly forcing the FED to do a additional rate cut in January.
All of this leads toward possible QE and liquidity injection into the economy which would get these markets moving again.
I can see us hitting you highs in 2026 probably kicking off around May where Jerome Powell is replaced when his term is up with a more friendly fed chairman.
And then starting the money printers back up again.
For now, at least the markets aren't bleeding and haven't broken this key Market structure.
We will know soon enough.

FireHoseReel | Crypto Cap Rising TOTAL Signals Risk On Mode🔥 Welcome FireHoseReel !
Let’s explore the latest TOTAL market setup.
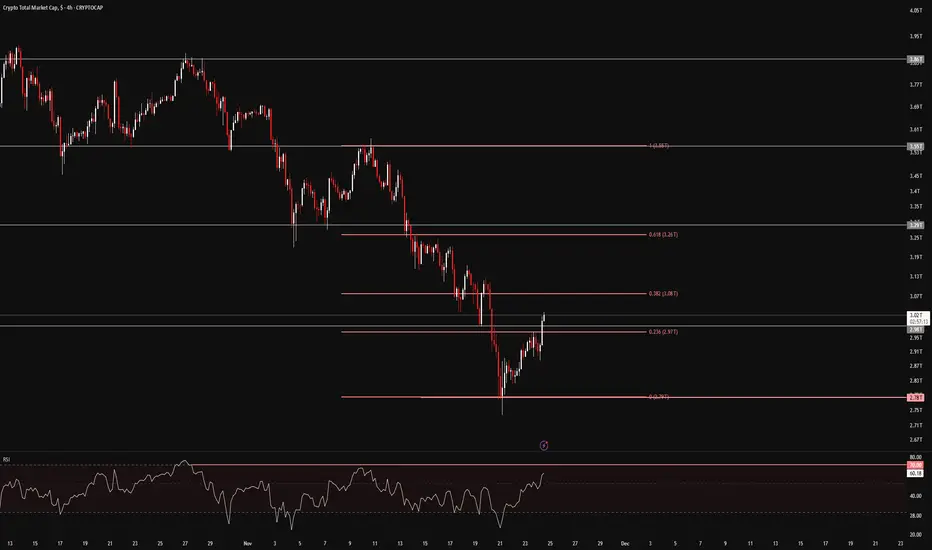
👀 TOTAL – 4H Timeframe Analysis
On the 4-hour chart, TOTAL shows the overall inflow of capital into the crypto market.
Price has successfully broken the 23% Fibonacci retracement level and is now moving toward the 38% zone.
If the 38% level breaks, traders who entered from lower supports can safely add to their position.
📊 RSI Momentum Check
The RSI has crossed above its previous high and has already moved above the 50 level, showing growing bullish momentum.
The next major RSI resistance sits around 70, which aligns perfectly with the 38% Fibonacci level, creating a strong confluence zone.
✔️ Correlation With Bitcoin
TOTAL shows a clear positive convergence with Bitcoin’s chart—both have built strong support levels and are pushing upward.
Institutional investors appear to have formed a solid accumulation base in this area, and the latest confirmations indicate this zone is becoming a reliable bottom.
With capital flowing into the crypto market and Bitcoin gaining momentum, the next moves across the market could be very powerful.
🛞 Risk Management & Disclaimer
Please remember to always use proper risk management and position sizing. Nothing in this analysis is financial advice. The market can change quickly, so always trade based on your own strategy, research, and risk tolerance. You are fully responsible for your own trades.
#ETHUSD 2,700 Strong Support !!We can say that 2,700 has acted as a stable short-term support level. On the positive side:
- ]RSI is at 60 and above its moving average.
- Expectations for a Fed rate cut have strengthened.
- SuperTrend has flipped to a buy signal.
I think the 2,940 support level, which worked previously in July, may hold again and help drive the price higher. After that, a breakout from the descending channel could offer around a 24% upside in the short term.

FireHoseReel | Total3: One Breakout Could Flip the Entire Market🔥 Welcome FireHoseReel !
Let’s break down what’s happening with TOTAL3 and see how the altcoin market is shaping up right now.
⭐ TOTAL3 Market Structure Update
The altcoin market (TOTAL3) has formed a solid support base around $824B after the recent pullback and is now pushing upward toward its major resistance at $882B.
A clean breakout above this zone could spark a broader bullish continuation, activate long triggers across top altcoins, and shift the market into a risk-on phase.
📊 RSI Momentum
The RSI is currently battling the 50 level, which has repeatedly acted as strong static resistance.
A confirmed breakout above RSI 50 would strengthen bullish momentum and support upward continuation — most likely during the China open session, where volatility usually increases.
🎯Impact on Top Altcoins
If USDT dominance declines, the top altcoins are likely to gain momentum quickly.
This can accelerate breakouts, create strong bullish impulses, and open up high-probability profit opportunities as liquidity rotates back into alts.
🧭 Trading Perspective
This is the kind of environment where staying close to the charts is essential.
Wait for index confirmations before entering new positions.
A potential altcoin rally could begin from these zones — and with proper risk management, layered entries across multiple altcoins can be highly effective.
🛞 Risk Management & Disclaimer
Please remember to always use proper risk management and position sizing. Nothing in this analysis is financial advice. The market can change quickly, so always trade based on your own strategy, research, and risk tolerance. You are fully responsible for your own trades.
PURE TOTAL 3 ALTCOIN INDICATOR without stable coins, BTC and ETHCRYPTOCAP:TOTAL3-CRYPTOCAP:USDT-CRYPTOCAP:USDC-CRYPTOCAP:DAI
Original idea inspired by trader SpartaBTC — highly recommend checking out his page.

TOTAL market cap to hit all time high! 🚀 Why I believe TOTAL MARKET CAP is bottoming & gearing up for a run to new ATHs 🟢📈
After reviewing Elliott Wave counts + classical price action, the structure looks extremely constructive. Here’s why 👇
🔍 Key Reasons I'm Expecting a Major Rally:
Wave 4 appears complete 🧩
Price just tapped the long-term trendline exactly where Wave 4 should typically end — shallow, corrective, and sentiment-driven.
Clean ABC correction ✔️
The drop has formed a textbook A-B-C zigzag, with Wave C terminating right on structural support.
Approaching major long-term trendline 📉➡️📈
Total market cap is retesting a multi-year ascending trendline that has held throughout the entire macro cycle.
A bounce here would be structurally consistent with the start of a Wave 5 rally.
Wave 5 structurally due ✨
Elliott Wave theory expects a strong, impulsive Wave 5 after a clean Wave 4 retracement. These are typically high-momentum rallies.
Bullish confluence across timeframes ⏳
Daily + weekly oversold metrics line up directly at major structural support.
🔥 If this read holds, TOTAL MARKET CAP could be preparing for a rally straight into new all-time highs.
