Bitcoin: Next Move = Drop to $85K (Then Either Moon or Doom)Hey everyone! 👋
How was your trading week? Hope it was green and profitable! 💰
Sharing my current Bitcoin view with you.
In my opinion, the recent rally we’ve seen was either part of an ongoing correction or the final leg of a correction after the previous sharp drop.
Either way, I expect the next meaningful move to be to the downside.
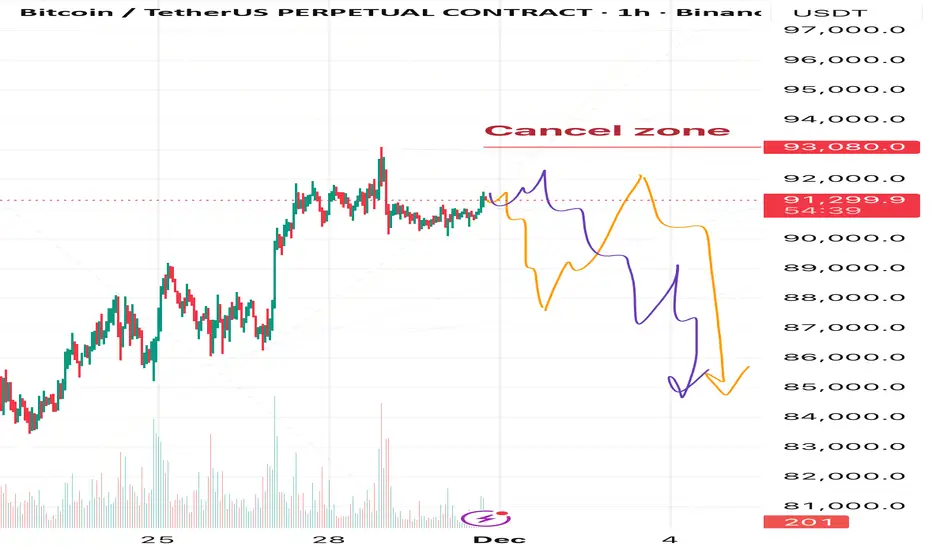
Right now I see two possible scenarios, but both lead to the same outcome in the near term:
→ A decline toward the $85,000 area
🟠either straight from the current price
🟣or after one more push higher toward ~$92,000–$92,500
This coming drop can be interpreted in two ways:
1. As wave B of the ABC correction from the recent crash → after $85K is reached we can expect a strong recovery and new highs above $93K (and likely much higher).
2. If the correction from the crash is already fully complete, then the drop to $85K will mark the start of a new bearish trend continuation.
We’ll watch the internal structure of the upcoming decline — it will give us the clues which of the two bigger pictures is playing out.
❌Invalidation level for the entire bearish scenario: $93,080
Any clear touch and break above this level cancels the idea completely.
Of course, I’ll keep posting fresh updates and chart markups as the price action unfolds, so make sure to hit that
Follow button and turn on notifications — you don’t want to miss the next posts! 🔔
Stay sharp and trade safe, friends! 🚀
See you in the charts! 📊
Tothemoon!!!
ZK: The Calm Before the ImpulseDespite the fact that the invalidation zones from my previous ZK idea were breached, the long setup didn’t break at all — it simply completed its final missing piece.
ZK is now shaping up for something big.
It really feels like the spring is getting tighter and about to snap upward.
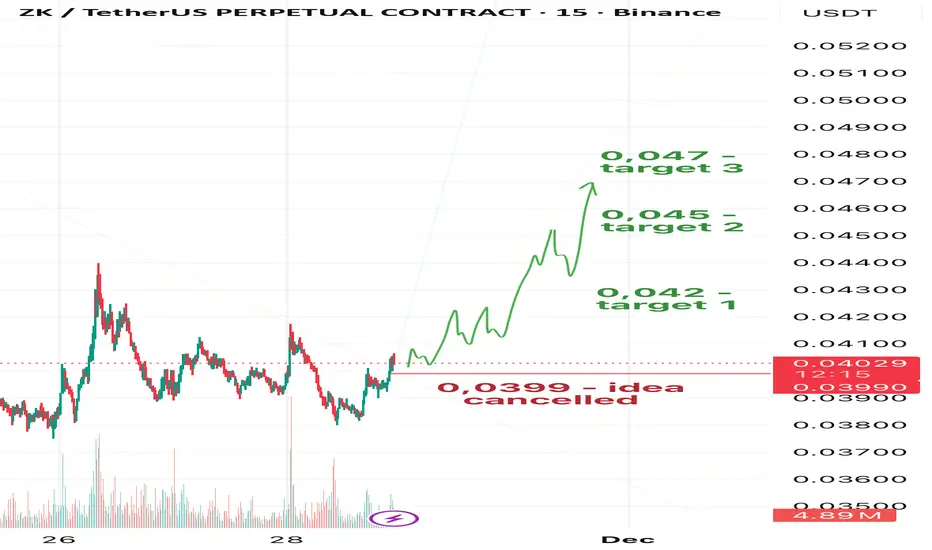
🎯From the current price, my targets remain the same:
Target 1: 0.042
Target 2: 0.045
Target 3: 0.047
⚡️Risk/Reward:
• To T1 (0.042): ~2.6R
• To T2 (0.045): ~7.6R
• To T3 (0.047): ~11R
❌My idea gets cancelled only if price drops to 0.0399.
Until then, the structure looks clean, momentum is building, and an impulsive move seems close. 🚀
TAO — Bearish Continuation Setup📉In my view, TAO continues to show signs of wanting to move lower. The market structure still looks bearish, and sellers remain in control.
🎯 Target 1: 274
🎯 Target 2: 268
❌ Idea cancel zone: 285
❓I also think we may see TAO at 260, but this level is still uncertain for me.
🔔So stay tuned — I’ll post an update once TAO gets closer to 268

$BYND - The Next GMELet's look at the thesis behind this idea :-
1) Massive Short interest.
2) Falling Wedge Pattern.
3) Diamond Hands are back again and This time they are supporting BYND.
4) Untapped Liquidity Resting above and possibility of liquidating Shorts would also be appealing to Market makers to supply Liquidity to HIGHER Bidders for building new Short positions.
From my speculation, this is highly risky play. But how to play it?
No need to go full APE.
Risk Assessment can be used. Assess your risk. Use a Stop loss. Accept your Risk. Always use a Stop loss with risk in mind of what you can afford to lose.
This is not a Financial Advice. Your gains and losses are your responsibility. I wish you good luck.
This idea is for educational purposes only. DYOR.
If you like this idea then Follow me please.

Orange Path to Glory – Monero’s 420 StoryTwo possible routes are shown on the Monero chart, yet both tell one story — the road to 420.
❌The invalidation zone is highlighted in red at 318,74.
💭 From here, I’m expecting more likely a move down to 324-330 first, before we see Monero shining at 420. That’s the move along the orange arrow.
I’m expecting more of a downside first, only then a strong move upward. Let’s see what the chart will show us.
This is not financial advice — everyone should manage their own risks

ETH : Accumulation Before Next Big Rally??Ethereum continues to show strength on the weekly timeframe.
Weekly structure remains firmly bullish, IMO. Pullbacks are natural, but the weekly structure favors continuation.
Weekly closing about 4.2-4.3K could trigger massive rally on weekly TF.
Chart is self explanatory. This is purely my interpretation of the chart and it could go wrong.
Note: This post reflects my personal views for educational purposes. It is not financial advice. Always DYOR before making any and every decision.

GOLD is BACK with a new potential move... so I m back to it tooCommodities have such a good time time this month. After a period of ranging and no specific direction, I secured over 9R in the last 21 days with a +8.85R on XAGUSD, a loss on XPTUSD, a BE on US2000, a +2.64R on COFFEE and another loss on JP225.

GME §8-)OK boys and girls – a little weekend fantasy for you (sneaky giggle 😏).
See those pink zones?
Notice what happened every time the market broke out there?
Now look at the whole width of those zones (highlighted in green).
What if that entire fat chunk is actually one giant buy zone? A monster pit where smart money is scooping up loads… quietly, secretly…? 🤔💸
Alright, enough daydreaming:
Don’t FOMO 🚫🐑
Have a happy weekend 😎🎉

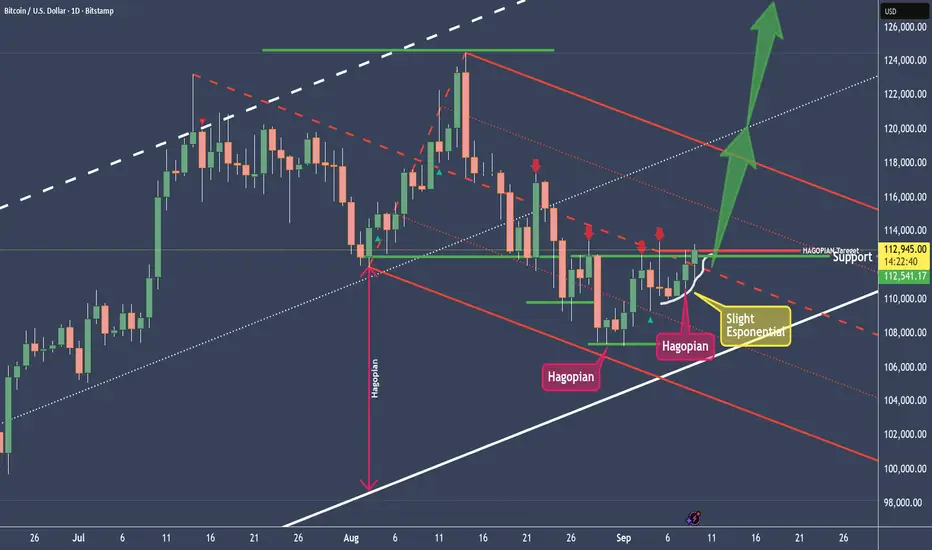
BTCUSD is moving exponential and here's the setupBecause BTCUSD couldn't reach the L-MLH of the red fork twice, we have 2 HAGOPIANs cooking. That means, that price will move further in the opposite direction than from where price came.
Price came from the Centerline, and that's where the high of the today's Candle peeked through. I expect more upside movement.
As for a trade, I want to see price holding above the centerline. From there, PTG1 is the U-MLH and beyond that it's the white Centerline again (...which looks like it's going to the Moon, like XRPUSD).
Of course, we seldom can eat the whole Cake. So we manage it and take partial profits on the way up.
🙏😊✨ Thanks for following and boosting folks. 🙏😊✨
XRPUSD is following our projectionThe red pressure line is broken.
After dabbling with the L-MLH, price decided to jump back into the fork, projecting a potential huge move ahead.
But not so fast!
The slope of the white fork is super steep.
In such situations I like to throw a Modified-Shiff-Fork, or a Shiff-Fork on the chart too. This gives me often more realistic profit targets.
The trade could be managed by using the light-grey fork's centerline as PTG1 and the rest of the position aims for the white mooning centerline §8-)
A second steak of the position could be loaded, after the yellow CIB-Line is broken. I like to wait for a test of it after the crack and jump-above. It's the same like a test/retest of a Medianline-Parallel if price broke out of it.
Let's have fun here §8-)

New CRAZY RALLY trying to unflod RIGHT HERE!Big momentum for coffee.
Commodity markets are known for aggresive bull and bear markets.
I never ever touched coffee in the last year and a half but now it looks promising enough to risk some money in a long trade.
Would you buy it?
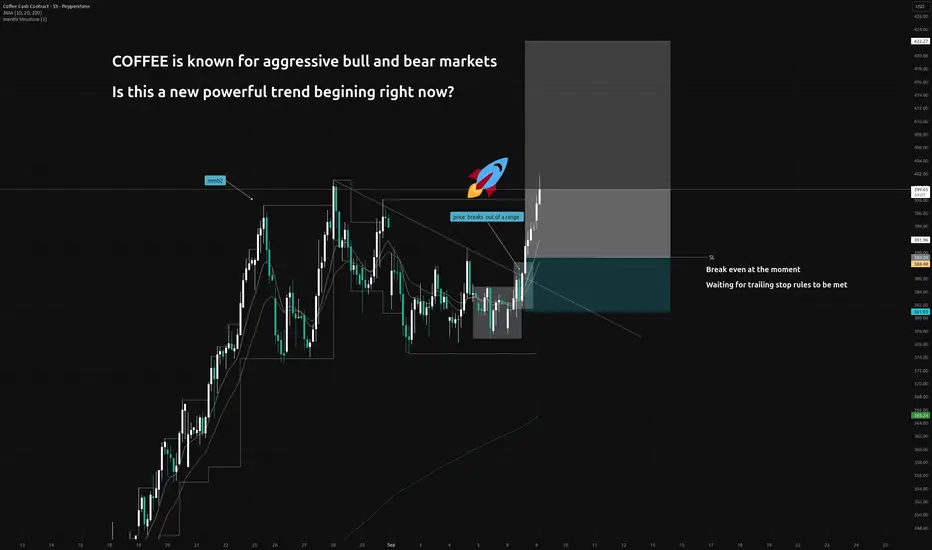
DON'T MISS a potential CRAZY RUN!!! Unfolding RIGHT NOW!!!When I m opening this chart I m always seeing hudge potential and upside.
This, right here, is a key moment in it's development: it either goes crazy or starts ranging some more.
Let's see!
Let me know if, and why, you agree or disagree with this!

Last and Best Buy spot is here near 0.2299$ ---soon---> 0.5000$I should start with this sentence now after years for BINANCE:DOGEUSDT : "Doge to the moon".
It is one of the last chance for DOGE to pump here and now after years of Range if it get back below 0.2$ once again the market is dead and range again so now and here i am looking for those daily +30% pump and gain to the targets like 0.4$ & 0.5$.
DISCLAIMER: ((trade based on your own decision))
<<press like👍 if you enjoy💚

#BTC #BTCUSD #BTCUSDT #BITCOIN #LONG #SWING #Analysis #Eddy#BTC #BTCUSD #BTCUSDT #BITCOIN #LONG #SWING #Analysis #Eddy
BTCUSDT.P Swing Long Analysis With Entry Point
This is my first possible scenario and analysis of Bitcoin's future trend.
This Analysis is based on a combination of different styles, including the volume,ict & Price Action Classic. (( Head & Shoulder Pattern ))
Based on your strategy and style, get the necessary confirmations for this Swing long to enter the trade.
Don't forget risk and capital management.
Entry point already touched : 🟢 79285.50
The responsibility for the transaction is yours and I have no responsibility for not observing your risk and capital management.
🗒 Note: The price can go much higher than the first target, and there is a possibility of a 500% pump on this currency. By observing risk and capital management, obtaining the necessary approvals, and saving profits in the targets, you can keep it for the pump.
Spot Investing : ((long 'buy' position)) :
🟢 Entry 1 : 79285.50
🟢 Entry 2 : 61845.77 (( This Entry is for secound scenario ))
First entry point calculations :
⚪️ SL : Behind the last shadow created.
⚫️ TP1 : 250000 ((215.32%))
⚫️ TP2 : 500000 ((530.63%))
⚫️ TP3 : 999000 ((1160.00%))
‼️ Futures Trading Suggested Leverages : 3-5-7
The World Let it be Remembered...
Dr. #Eddy Sunshine
4/4/2025
Be successful and profitable.
Do you remember my first Bitcoin swing long signal entry & targets?
My first swing long signal was provided on BTC, which was spot pumped by more than 150% and was profitable :

BnB is on the wayBnb usdt Daily analysis
Time frame 4hours
Target 900$
Close Target is upperside of the band
We hear a lot of news about major crypto companies collaborating, as well as corporate acquisitions and filling the coffers with valuable cryptocurrencies.
But there is no volume in the market.
We are not seeing the growth that we expect to hear after all this good news.😒
What is the reason?
The answer is one word.
👉Strategic patience. 👈
Wait, this is the beginning. The rockets are refueling for a long, long launch.🚀🚀🚀

TESLA | Weekly HTF TargetAfter having a deep retracement ~70% tesla looks ready to reach Higher Highs...
New High target: $490+

#BTC #BTCUSD #BTCUSDT #BITCOIN #LONG #SWING #Analysis #Eddy#BTC #BTCUSD #BTCUSDT #BITCOIN #LONG #SWING #Analysis #Eddy
BTCUSDT.P Swing Long Analysis With Entry Points.
This is my possible Scenarios 1&2 analysis of Bitcoin's future trend.
This Analysis is based on a combination of different styles, including the volume,ict & Price Action Classic.
Based on your strategy and style, get the necessary confirmations for this Swing long to enter the trade.
Don't forget risk and capital management.
First Entry point of Scenario 1 already touched.
The responsibility for the transaction is yours and I have no responsibility for not observing your risk and capital management.
🗒 Note: The price can go much higher than the first target, and there is a possibility of a 500% pump on this currency. By observing risk and capital management, obtaining the necessary approvals, and saving profits in the targets, you can keep it for the pump.
Spot Investing : ((long 'buy' position)) :
🟢 Entry 1 : 79285.50 (( Scenario 1 Entry point ))
🟢 Entry 2 : 61845.77 (( Scenario 2 Entry point ))
⚪️ SL : Behind the last shadow created.
⚫️ TP1 : 250000
⚫️ TP2 : 500000
⚫️ TP3 : 999000
‼️ Futures Trading Suggested Leverages : 3-5-7
The World Let it be Remembered...
Dr. #Eddy Sunshine
4/4/2025
Be successful and profitable.
My previous analysis of Bitcoin (a view of one of the reasons for my first scenario):
Do you remember my first Bitcoin swing long signal entry & targets?
My first swing long signal was provided on BTC, which was spot pumped by more than 150% and was profitable :

XRPUSDT.P — Is This the Beginning of the Next Pump?
BINANCE:XRPUSDT.P is bouncing back with style — and this long setup is giving off real “king of the charts” vibes. Look at that clean risk-to-reward!
Entry: 2.0905 USDT
Stop-loss: 2.0574 USDT
Take-Profit: 2.2238 USDT
R:R Ratio: 3.28
Why this setup matters:
Confirmed bounce off intraday support
Momentum shift with bullish engulfing candle
Targeting a clean resistance level for optimal exit
Tight stop, juicy upside — exactly what scalpers and day traders crave. Add to watchlist and get ready to trail that stop if momentum holds.

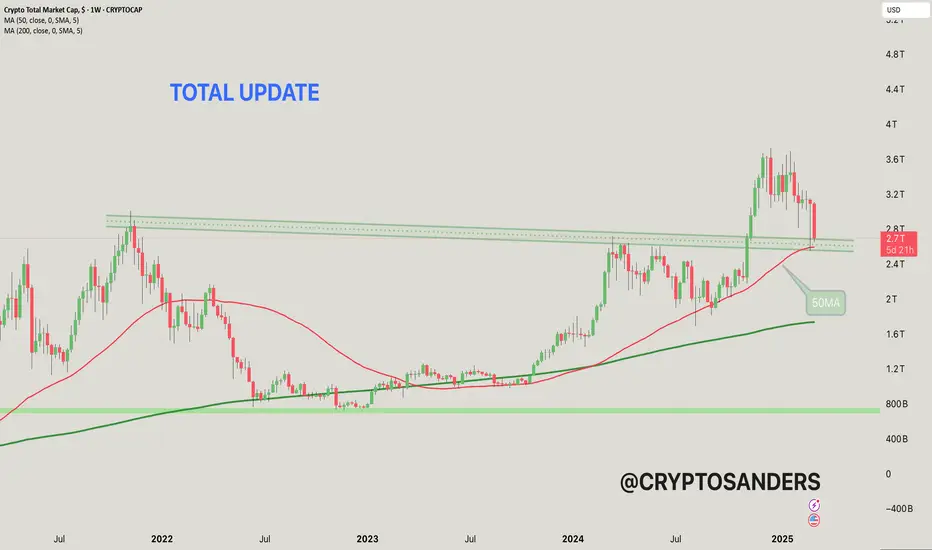
This chart shows the total cryptocurrency market capitalization,
The current value is around $2.271 trillion, which represents a significant drop of 12.51% from the recent peak.
50-MA (moving average): The red line represents the 50-week moving average, which is currently around $2.59 trillion. It acts as a short-term trend indicator and potential support level.
200-MA: The green line represents the 200-week moving average, which is around $1.73 trillion, which indicates a long-term trend and strong support level.
The horizontal green lines represent support levels around $2.4 trillion and $2.6 trillion. These levels are important for a potential bullish reversal if retested.
The dotted line above the price represents resistance levels near historical highs.
The recent decline suggests the market may be in a bearish trend after failing to break the resistance levels.
If the price is above the 50-MA, it could signal a reversal towards the resistance zones and a potential recovery. However, a break below the 50-MA could signal further decline. Keep an eye on the key levels around $2.4 trillion (support) and $2.6 trillion (resistance).
If you found this analysis helpful, hit the Like button and share your thoughts or questions in the comments below. Your feedback matters!
Thanks for your support!
DYOR. NFA
Doge to 1$Considering the recent movement of Dogecoin its most likely that we will see doge go to 1 dollar in the next 3 to 6 months .
only buy spot this idea is not for futures trading

I see a bullish movement for BTC!BITSTAMP:BTCUSD
Bitcoin is in the most boring symmetrical triangle ever! However It's cooking something!
we can see a bullish Divergence on MACD and a possible bullish cross between MACD and Signal line!
these are some bullish signs which makes me think that the price might be able to break out of the triangle and get up to 123k! (AB=CD)
since we are at a bottom and the bullish trend line isn't lost yet, It might be a good point to enter!
⚠️ Disclaimer:
This is not financial advice. Always manage your risks and trade responsibly.
👉 Follow me for daily updates,
💬 Comment and like to share your thoughts,
📌 And check the link in my bio for even more resources!
Let’s navigate the markets together—join the journey today! 💹✨

Shiba is gonna...BINANCE:SHIBUSDT
I see a descending channel for SHIBA!
I guess It's gonna decrease for now! cause no break out is gonna happen for now.
⚠️ Disclaimer:
This is not financial advice. Always manage your risks and trade responsibly.
👉 Follow me for daily updates,
💬 Comment and like to share your thoughts,
📌 And check the link in my bio for even more resources!
Let’s navigate the markets together—join the journey today! 💹✨

TOTAL3 Chart Analysis.
The TOTAL3 chart, representing the entire Altcoin market except for Ethereum, has successfully broken its downtrend resistance, indicating a significant shift in market sentiment. With the RSI remaining comfortably above 60, bullish momentum is gaining momentum, indicating growing confidence among market participants.
Historically, this pattern precedes a macro bullish phase, where small-cap Altcoins begin to surge, led by Bitcoin and Ethereum. A break above the $1.1T level could act as a catalyst, potentially igniting a broader Altcoin season as capital flows into the Altcoin market.
Let me know if you’d like further assistance or adjustments!
DYOR. NFA
