Tothemoon

LONG? BTC/USDTHey! On the 1h chart we can see inverse hs formation and a Gartley Pattern AB=CD (bullish variation)
that is why shoulders line is a strong level. Although flag is formed, it seems to be a similar situation to what we had 8th June.
Anyway be careful, have a good session!

something crazy!$tsla is finishing a consolidation period, and my avg indicator is revealing something very interesting, is in the same level that take us from $400 to $900

BTCUSD: Accumulation Phase D to Complete & BTC Bulls rallyHi, don't forget to checkout other Previous ideas on BTC.
One thing to note is that the Wyckoff Accumulation Structure about to be Completed as we are waiting for the confirmation of Phase D to complete then E then after the Bull rally will continue.
Price has to break , close above and Re-Test @40653.34 for the market to continue with being Bullish.
Checkout the previous Ideas as this is just an Update to them.
PLEASE trade Responsibly and FOLLOW you own RISK MANAGEMENT.

a flag formationas you can see, the super technicians of WSB are using this big formation at least 30%

BTC #TO_THE_MOON, very soon!!!!!A bullish pennant showing a probability for a upside movement!
42.5K is a strong resistance point though!
Breakout of that will be interesting!!!!

BTC back to normal??The line chart is posing some bit of hopes for BTC buyers!
A falling wedge kind of structure has given a upside delivery!
A sustainance above 39.5k will ensure higher levels for us soon!


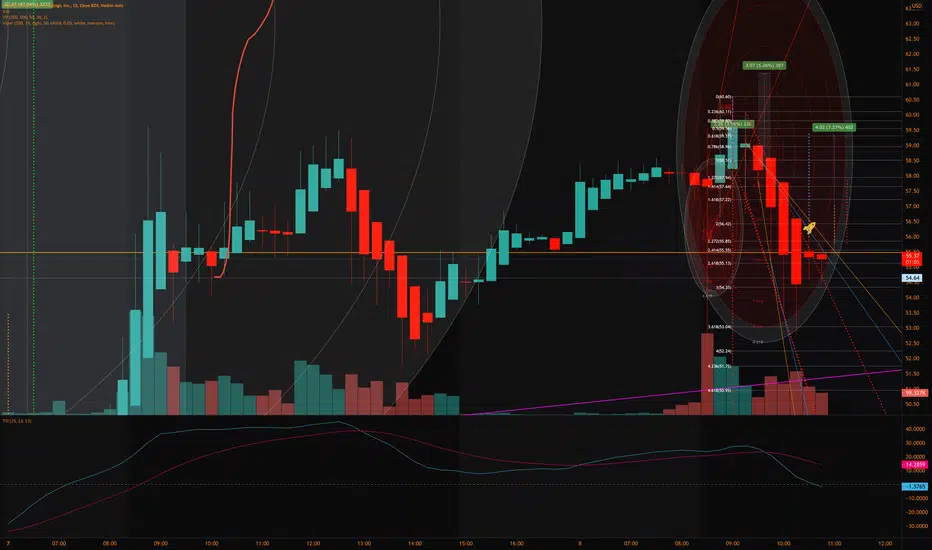
Predicting Elliot Wave and Fibonacci for the next WaveAfter completing the Cup and Handle pattern fully, it looks to me as if we completed a full impulse wave 12345 with a ABC correction. This perception is also supported by the perfect fibonacci levels.
This suggests we are about to enter a new cycle. Since the Earnings report was incredibly bullish (25% sales growth, 49% earnings beat) and the surrounding news (new CEO from AMZN, new CFO from AMZN) is all very bullish, I expect another impulse wave to begin. We might have a flat correction in between first, but I don't expect too much downside.
The next movement I expect a 1 wave retesting 300, but getting rejected, retracing to 240-260. Then we will see the long 3rd wave, achieving a new ATH, finally in the region of 620. Before I expected this to go between 600 and 800, so this is a fairly conservative estimation. The wave 4 correction will take us back down to the 400s before pushing for the wave 5 to over 1k.
Important to note, that after this strong move upwards, we will see a triangle wave or running flat correction first, with 3-5 weeks of sideways trading. This will not invalidate the idea. Also another step backwards below 232 will not invalidate the idea, just change the numbers slightly.
I consider this idea failed if we drop below previous wave 1 which is around 180.


Confluence of Support on EthereumWith the price of ETH currently at the support of both the 100 day SMA and the trendline of an ascending triangle (which is a reversal sign in itself), this price area presents a high probability of sparking a rally in ETH.

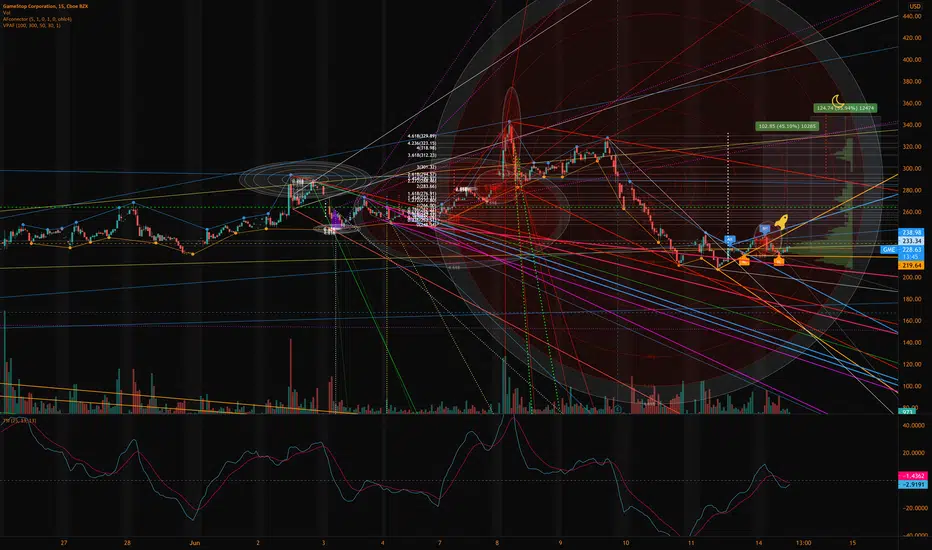
GME gearing up for more upsideAs predicted in my older posts, GME is now nearing the completion of the Cup and Handle pattern. This is very bullish, and indicated that it is ready to continue its long term upward trajectory.
The long term trend we see with this pitch fork from the ATL to first peak and next low outlines that we should be expecting another test of the top of the 1x trend line at around 760 to 800, and after that, we could even see a run to the 2x trend line like in January at around 3000 to 3200 within a months time. This is the best case scenario.
I consider this trend invalidated if we fall below the purple zone between 90 and 80.


AMC to the moon!This is a momentum play from the beginning. The momentum got weak... that explains the selling. Hope the momentum builds up again next week. Price closed in the golden zone of the Fib retracement. There is still hope. lol NYSE:AMC


400% ?Please fasten your seat belts we are going 400% up from the ground and we expect a lot of ups and downs

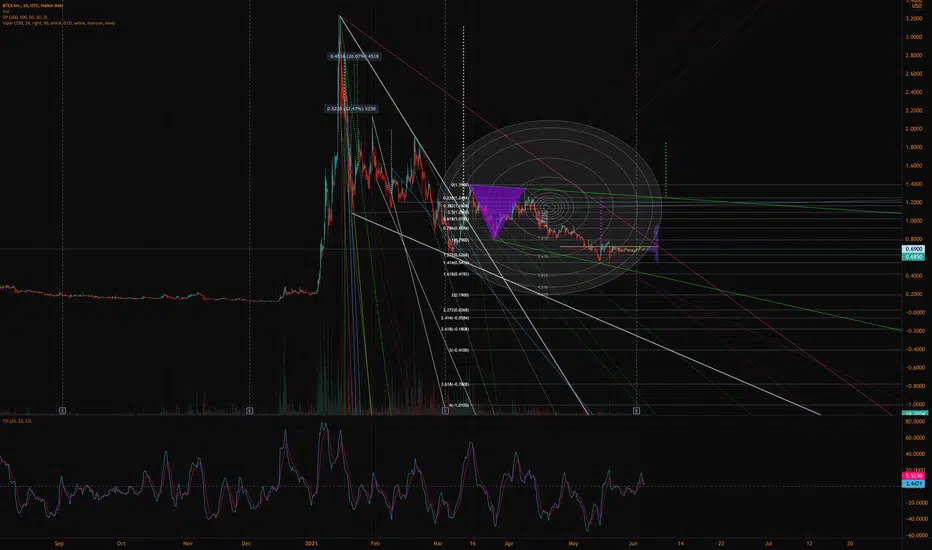
RKT looking like its ready for lift off at this spot..T-minus 5 before this takes off, but does it have rocket boosters or just rocket thrust.....I have two paths here that could be possible.
I left the unique pattern it was making as keys to where the same moved happened in the past and carried their trendlines forward.

TESLA READY TO SOARRRR!!! #BLESSEDPIPS BUY IN PRICE $590
HELD GREAT SUPPORT AT THE 0.618 FIB RETRACEMENT, PUT YOUR SEAT BELT TESLA IS GOING THE MOON MAYBE MARS.
VERY EXCITED FOR THESE SETUPS!!!
#BLESSEDPIPS

