Bitcoin ALIVE ! Try dont miss the market !
Bitcoin is trying to complete Cup and Handle pattern ! Dont miss a trend reversal ! Just look at the chart.
You can also try new trend analysis tool for free now tinyurl.com/blockchainrocket
Tothemoon


Diffusion of innovations. 10-year road to $1 Million.Diffusion of innovations is a theory that seeks to explain how, why, and at what rate new ideas and technology spread. Everett Rogers, a professor of communication studies, popularized the theory in his book Diffusion of Innovations.
Rogers defines an adopter category as a classification of individuals within a social system on the basis of innovativeness. In the book Diffusion of Innovations, Rogers suggests a total of five categories of adopters in order to standardize the usage of adopter categories in diffusion research.
Adopter categories:
Innovators — Innovators are willing to take risks, have the highest social status, have financial liquidity, are social and have closest contact to scientific sources and interaction with other innovators. Their risk tolerance allows them to adopt technologies that may ultimately fail. Financial resources help absorb these failures.
Early adopters — These individuals have the highest degree of opinion leadership among the adopter categories. Early adopters have a higher social status, financial liquidity, advanced education and are more socially forward than late adopters. They are more discreet in adoption choices than innovators. They use judicious choice of adoption to help them maintain a central communication position.
Early Majority — They adopt an innovation after a varying degree of time that is significantly longer than the innovators and early adopters. Early Majority have above average social status, contact with early adopters and seldom hold positions of opinion leadership in a system (Rogers 1962, p. 283)
Late Majority — They adopt an innovation after the average participant. These individuals approach an innovation with a high degree of skepticism and after the majority of society has adopted the innovation. Late Majority are typically skeptical about an innovation, have below average social status, little financial liquidity, in contact with others in late majority and early majority and little opinion leadership.
Laggards — They are the last to adopt an innovation. Unlike some of the previous categories, individuals in this category show little to no opinion leadership. These individuals typically have an aversion to change-agents. Laggards typically tend to be focused on "traditions", lowest social status, lowest financial liquidity, oldest among adopters, and in contact with only family and close friends
P.S.
The values of local highs and lows are approximate, but their time interval is calculated taking into account the date of halving.
Halving is undoubtedly a very important event in terms of the fundamental laws of nature, the true meaning of which we have yet to learn in the future.
I wanted to attach links to interesting research about the nature of Bitcoin, but I do not have enough reputation(

BTC Is Close To "Supernova Explosion" . CHEAP FOR THE FUTUREThe Most Important Moving Average Period is probably week.
AS you can see, In the recent year, MA20 and MA50 influenced trend price.
BTC is above the MA200 , That is ok.
MA50 and MA100 are close to each other, then we can focus on the MA50
Look! BTC is below the MA20 but very close to cross up the MA20.
IF BTC cross up 4060 USD in the end of this week then the big trend might be changed.
That is not all. There is Ma50 . IF BTC cross up Ma50 with high volume too, the bullish trend will come.
BTC Price: 4041
BITFINEX:BTCUSD

#MTHBTC #MTH UPDATE Please check the Triangle and canle jump out from the triangle :)) After stronge volume it can go to the Moon :)
Please push the like button and follow me please

NOS VAMOS A LA LUNA!! BTC/XBTQlq mis panas. Ya pasaron 2 semanas que no publico nah y bueno fue principalmente por el mercado que anda lento. Hoy les traigo mis dos
posibles entrada en SHORT.
La primera seria en la liquidación de los 25x a los 3985 que es la que veo con mas seguridad que pase y la segunda de los 10x a los 4280 que me parece esta muy difícil llegar ya que le ha costado romper los 4000 a BTC debido a que esta perdiendo fuerza alcista pero si el SH quiere lo sube para buscar la liquidez que tenemos en esos niveles. Si pasa el segundo escenario te recomiendo que dejes ese short abierto hasta que llegue como mínimo al ultimo LL que serian los 3360. Siempre trata de entrar a precio de liquidación mi pana, así tienes mas probabilidad de ganar que de perder, y siempre con tu SL.
#rafcryto #btc

Clean and SimpleIf you are a new trader/investor, don't look at small time frames, focus on the big picture and use these simple indicators: MACD, RSI, VOLUME. Fundamentals are also good for XRP.

IOTANow IOTA moving in accumulation zone this is good zone for buy before IOTA fly. According to my observations, I noticed that the iota team has market makers who know and have experience how to make a rocket for the price of iota. that's why my recommendation is to add this coin to portfolio for the medium term. Swing trading


All time high is nearBNB is very near all time high and moving there with huge bullish momentum. If and When price cross last level of resistance (if it will ever resist), there will be no more pressure from above. Everyone buying will be in profit, kust like with bitcoin before it went down. It might not land on the Moon, but potential is really unlimited and unrevealed, until we really see it clearly fall. No one can say how far BNB will grow, but according to Fibonacci possible levels will be at these areas 325 - 375 - 425 - 525.

Polymath Polymath
The Polymath platform has the overall aim of providing legal and technical expertise to facilitate tokenization of various financial assets and instruments. The platform has managed to pull token issuers, legal experts and technical professionals together in order to build an ecosystem which harbors the ability to assist in the production of tokens which are fully regulatory-compliant on the Ethereum blockchain.
The platform uses the POLY token as a medium of exchange for all key operations which include payments relating to the development of new securities tokens and the buying of new tokens created on the platform.
In technical we touched support line of the trend line and this is good opportunity to buy at this level. Swing trading


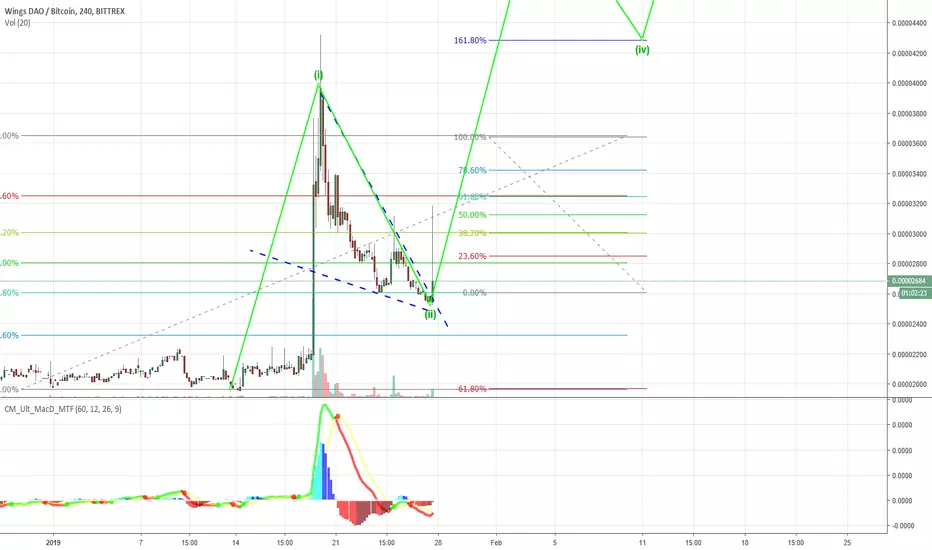
Wings is about to go up !All fibo is on the places
Triangle is broken with good bullish impulse pushing up from 61.8
Macd confirms bulls intentions
Huge volume went into the coin recently
Obviously in the coming days, we will begin to observe the 3rd Elliot wave moving up to the Near targets :
~ 4280
~ 5300
~ 6360
TRX/BTC #ToTheMoon or NOT YET?I expect TRX to go down to 500-530 zone, which is 0.618 Fibo.
However, this variant will reject if TRX goes up to 730 and breaks this level, then it will mean that:
1) This is not an ABC correction, and possible flat may occur.
2) The correction is already done and the upward trend will continue(Very low probability)
On the chart below, I showed how I see this correction on 15m TF and to my opinion we only have A wave and the beginning of the B wave.
To see more deep analysis of TRX you can join my Telegram channel("Location" in my profile).

BTCUSD, THINKING OUT LOUD FUNDAMENTALI won't be wordy.
Here are some fundamental reasons for long..long..long..long... :
Halving 2020
Bakkt
Fidelity
ETF initiatives
Lighting Network integration
Oversold
Full year of the bear market
Unprofitable mining
Increased volume on lows
Falling stock market
Weak-currency countries
Trade wars
Good diversification place for whales
e.t.c...
So there's no need to be smart to understand that it’s time to buy starting from current levels, so enjoy it !
There is no need to be a snipper ( if you trade spot )
This stuff was created after the crisis, think about it ..
The market segment is too small to speek so much in the media..
So - it will be ridiculous if that isn't going to work )
So - don't panic & Have a nice day !)

XELBTC LONG-TERM VISIONMarket Cap $2.800.000
Available Supply 91676277
All time high $1.16
All time high date 2018-01-10 (one year ago)
Since all time high -96.78 %
Rank #481
MACD goes bullish
abcde RSI pattern shows strong bullish
divergence with chart's discending triangle
Stochastic is in oversold
B-bands narrowed for impulse , seems it's ready to explode
targets :
1. ~ 0.00003900
2. ~ 0.00005800
3. ~ 0.00008700
4. ~ 0.00014000
5. ~ 0.00019000
6. ~ 0.00023000
Potential profit ~ 2500 %
Long term!

Golden Pocket ETH retraced back to the "Golden pocket" (.618 - .65) Fibonacci mark right around $113, went long right before this pennant and sold around $130. Seriously in love with Fibonacci.

12 April Fractal #tothemoonFractal from the day of cosmonautics sends greetings to all and aims at 4400
P. s.: and even retests 3952$

End of the bear market in 48hHi everyone ,
This idea is continuation of the previous idea . My prediction is very much in play and i am waiting for capitulation and big green rebound to set the end of the bear market . This will be the best trade to be made . No one expect the bears to stop now . Everyone is calling for 2.4k , 1.3k , the sentiment is fully bearish . Now is the time the bears to be rekt , and the ATH shorts to close and buy again.
BTC fundamentals now are stronger than ever , the institutions are slowly buying on OTC . Now is the time to be greedy .
Good luck and good job to everyone ,who is still holding the currency of the future.
Original idea for the ultimate bottom :

Trade of the year is almost here Hello everyone,
Looking at Bitcoin daily chart we can see the sellers seems exhausted , one last final dip can make ultimate low of bitcoin . $3000 level is a strong support and resistance and a big psychological level.
If this support breaks is likely to see sub 2k BTC.
I am watching for volume spike , big capitulation candies and fast reversal .
This can be trade with proper stop loss and can bring real crypto profits on the table .
Good luck.
previous idea is still very much in play :

BTC/USD wait for REVERSAL pattern near critical support zonesWe can see clear Falling wedge pattern and strong divergence on all indicators like MACD, RSI, Momentum etc..
Wait for a reversal pattern at support zones:
1. ±6000$ zone
2. ± 4500$ zone
3. ±3000$ zone
You will see a start rally with volume increasing ONLY after a reversal pattern completion at these zones.
The first Target of the rally is ±11500
Good luck!

BTC/USD Possible MovementThe deeper BTC goes, the closer is the next bullrun. However, there are two possible variants that I can see.
1) The Blue One(Most Possible). BTC goes to 4900-5000 zone, where people open a lot of longs, expecting a breakout of the trendline. But it turns out to be fake, and we fall again to 3600-3850 zone.
2) The Red One(Alternative). BTC goes to the 4900-5000 zone, breaks it with high volume and the next TO THE MOON begins.
P.s. the time will show, I am in LONG right now, expecting the test of the mentioned zone.

Bitcoin LOGISTIC CURVE LOGISTIC CURVE
The logistic curve describes the speed of information dissemination among people. This graph describes the distribution of information in an environment.
At first, a instrument is of little interest to anyone, investors are afraid of buying it, and its price fluctuates around r °. At this time, the initiated ("elite"), solely owning important information, begin to buy it, the price slightly grows. Then the information is shared with a small circle of insiders, individual purchases grow into active buying, the price of the instrument abruptly takes off. The general public is perplexed and can not understand what is the reason. At the third stage, news comes out and investors fearing not to have time to "jump into the last car" buy up this tool that the "elite" and "proxies" are happy to sell to them at the maximum price (with joy, because at that time the "elite" there is already new information that the "elite" has taken into account, a new logistic curve in another instrument begins, or in the same, but with another sign, sales begin). The third stage is completed, when the whole society is aware of what happened, discuss everywhere, in the metro , all who could have already made There is no one to sell.
Practice of application: the most important is to determine at what stage the price for the asset is now at which you paid attention and in relation to which you received some information. You can recognize and apply the Elliott waves .
The main thing is not to get into the crowd number at stage 3. If in all financial newspapers, on news sites, on TV there is a discussion of news / ideas - in fact, it is no longer news, this crowd of investors are bred, and this idea should not be used as its defining action (unless with another sign, directly opposite).
Examples in life and the stock market abound. On the classics the same was done with bitcoin last year
People do not change over time. Information and actions of the consonant received information people do the same actions.
The only thing that changes is the slope of the logistic curve - information dissemination rate
As a rule, 90% of bulls in high. And then the market unfolds and vice versa
If you are constantly being told the same thing, then everybody knows it already. It is necessary to look not at the news
If everyone around you screams the same thing, then you are in the upper zone
The task of stepping back from the noise
The main task is to be in the lower green zone. "When there's blood on the streets, buy property"
