US Federal Reserve & Central Bank Policies1. Introduction
Every economy in the world runs on money – but money is not just about paper notes or coins. Behind every financial system stands a central authority that manages the flow of money, credit, and liquidity. In the United States, that authority is the Federal Reserve System, commonly known as “The Fed.”
The Federal Reserve doesn’t just print money – it plays a much bigger role. It manages interest rates, regulates banks, provides stability during crises, and sets the overall monetary policy that affects the stock market, bond market, inflation, employment, housing, and even global trade.
To truly understand the global economy, traders, investors, and policymakers must understand how the Federal Reserve works and what central bank policies mean.
2. The Birth of the Federal Reserve
Before the Fed was established in 1913, the U.S. economy was chaotic. The country suffered repeated banking panics in the late 1800s and early 1900s. Banks failed often, depositors lost money, and there was no central authority to stabilize markets during crises.
The panic of 1907 became the turning point. With no central bank, private financiers like J.P. Morgan personally organized rescues for failing banks. This made it clear that America needed a central institution.
Thus, in December 1913, Congress passed the Federal Reserve Act, creating the Federal Reserve System. Its goals were:
Provide stability to the banking system
Act as a “lender of last resort”
Manage monetary policy to prevent panics
Support sustainable economic growth
3. Structure of the Federal Reserve
The Fed is not a single building or a single person. It’s a networked system designed to balance independence with government oversight.
The Main Parts:
Board of Governors – Based in Washington D.C., made up of 7 members appointed by the U.S. President. They guide overall policy.
Federal Reserve Banks – 12 regional banks across major U.S. cities (like New York, Chicago, San Francisco). They implement policies and interact with commercial banks.
Federal Open Market Committee (FOMC) – The most important decision-making body for monetary policy, particularly interest rates.
Member Banks – Thousands of commercial banks that hold reserves with the Fed and borrow when needed.
This system ensures checks and balances: the Fed is independent in decision-making but still accountable to Congress and the public.
4. Objectives of the Federal Reserve (Dual Mandate)
Unlike many central banks that focus only on inflation, the Federal Reserve has a dual mandate:
Price Stability – Keep inflation under control (not too high, not too low).
Maximum Employment – Ensure that as many people as possible have jobs in a healthy economy.
Additionally, financial stability and moderate long-term interest rates are also implicit goals.
5. Tools of the Federal Reserve
The Fed has several powerful tools to shape the economy:
(A) Monetary Policy Tools
Open Market Operations (OMO) – Buying and selling U.S. government securities (like Treasury bonds) to control money supply.
Buying securities → injects money → lowers interest rates → boosts growth.
Selling securities → absorbs money → raises interest rates → slows inflation.
Federal Funds Rate (Interest Rate Policy)
The Fed sets a target for the rate banks charge each other for overnight loans.
Lowering rates → cheaper borrowing → more spending & investing.
Raising rates → expensive borrowing → cooling the economy.
Reserve Requirements
The percentage of deposits banks must keep as reserves. Lower requirements → more lending. Higher requirements → less lending.
Rarely used today, as OMO and interest rates are more effective.
Discount Rate
The interest rate charged when commercial banks borrow directly from the Fed.
(B) Unconventional Tools (Used in Crises)
Quantitative Easing (QE) – Large-scale purchase of government bonds or mortgage-backed securities to inject liquidity (used after the 2008 crisis and COVID-19).
Forward Guidance – Communicating future policy intentions to influence market expectations.
Emergency Lending Programs – Special facilities to rescue banks, companies, or markets (example: COVID-19 corporate bond buying programs).
6. How Fed Policies Influence the Economy
The chain of influence looks like this:
Fed Actions → Interest Rates & Liquidity → Consumer & Business Borrowing → Investment & Spending → Employment & Inflation → Stock & Bond Markets → Overall Economy
Example:
If inflation is too high, the Fed raises rates → mortgages, car loans, business loans become expensive → spending falls → demand cools → inflation comes down.
If unemployment is high, the Fed cuts rates → cheaper credit → businesses expand → jobs increase.
7. Historical Policy Examples
(A) Great Depression (1930s)
The Fed failed to act aggressively, allowing banks to collapse.
Lesson: Central banks must act as lenders of last resort in crises.
(B) 1970s Inflation
Inflation reached double digits due to oil shocks and loose policy.
Fed Chair Paul Volcker (1979–1987) raised interest rates dramatically, even up to 20%, to crush inflation.
Short-term pain but long-term stability.
(C) 2008 Financial Crisis
Housing bubble burst, banks collapsed (Lehman Brothers).
Fed slashed rates to near 0%, launched QE worth trillions, and bailed out the system.
Critics said it encouraged risk-taking, but it prevented a depression.
(D) COVID-19 Pandemic (2020)
Fed cut rates to 0%, launched unlimited QE, provided emergency loans, and stabilized global dollar liquidity.
Prevented a financial collapse during lockdowns.
8. Impact on Global Markets
The Federal Reserve’s policies don’t just affect the U.S.—they impact the entire world because:
The U.S. dollar is the global reserve currency.
Most international trade, commodities (like oil), and debt are priced in dollars.
When the Fed raises rates, capital flows back to the U.S., causing emerging markets to suffer currency weakness and capital outflows.
When the Fed cuts rates, global liquidity rises, and risk assets (stocks, crypto, real estate) boom worldwide.
This is why traders globally watch every FOMC meeting, speech, and policy announcement.
9. Criticisms & Challenges of the Fed
While the Fed is powerful, it faces criticism:
Too much influence on markets – Investors often say markets are addicted to “easy money.”
Delay in action – Policies work with a time lag, so the Fed sometimes reacts late.
Political pressures – Even though independent, Presidents often criticize Fed decisions.
Income inequality – QE and asset purchases often benefit wealthy investors more than ordinary citizens.
Global ripple effects – Rate hikes in the U.S. can trigger crises in developing nations.
10. The Future of Central Bank Policies
As economies evolve, central banks face new challenges:
Digital Currencies (CBDCs) – The Fed is studying a “digital dollar.”
Climate Risks – Some argue central banks should consider environmental stability.
Geopolitical Pressures – Sanctions, trade wars, and global fragmentation may test Fed policy.
Technology & AI – Data-driven finance could change how monetary policy is transmitted.
Conclusion
The U.S. Federal Reserve is not just an American institution – it’s a global financial powerhouse. Its policies affect inflation, jobs, housing, stock markets, currencies, and even geopolitics.
Understanding the Fed means understanding how money moves, how economies grow or shrink, and how financial markets react.
For traders and investors, following Fed decisions is as important as tracking company earnings or global news. Every rate hike, cut, or policy signal from the Fed sends ripples across the world’s financial oceans.
In short, the Federal Reserve is like the captain of the world’s financial ship – sometimes steering smoothly, sometimes making hard turns, but always holding the power to influence the course of global markets.
Trade!

XAUUSD M5 BEARISH STRUCTURE QML LATE RETEST PATTERN NO 02Yes, this is the same market structure where we previously identified a buy setup on the M5 timeframe. Once again, the last Higher High (HH) has been formed, and immediately after that, an Order Block (OB) appeared on M5.
If this OB or “engineer candle” had been formed in isolation, it would hold no real value. However, its authenticity becomes valid because price first created the last HH before forming this structure.
This setup aligns perfectly as a QML (Quasimodo Level) with a late retest, according to both the M5 and M15 timeframes.

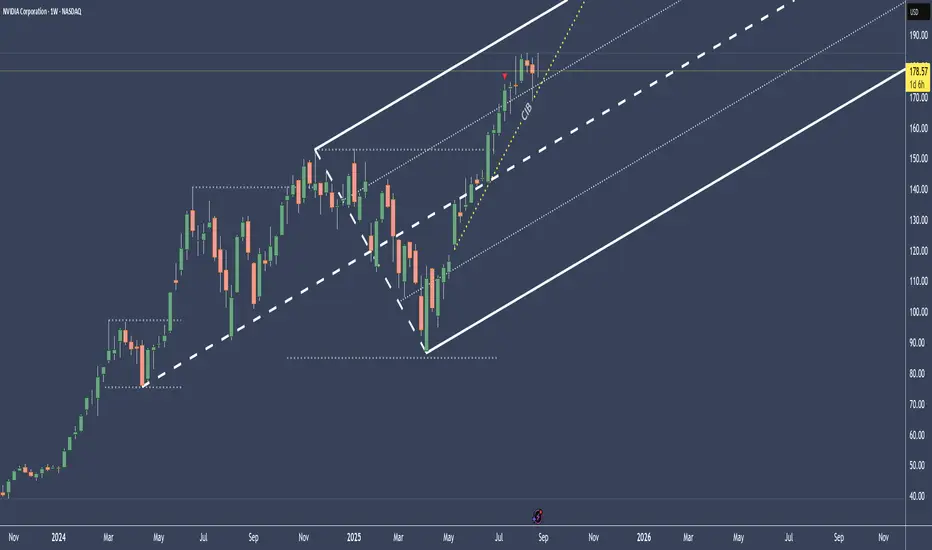
NVDA - Watch the show, until the Sh** hits the FanThe expected “end of hype” around Nvidia stems from its current inability to forecast H20 chip sales to China, forced production halts, and growing political friction—despite its strong financial performance elsewhere.
The tension between U.S. export policy and China’s technological self-reliance is creating real operational and strategic obstacles for Nvidia.
In this weekly chart we still have an upward projection.
Nonetheless do we all know what a Game NVDA is playing by selling to its one companies.
The air is thin, very thin up there.
And after the Earnings Report we all know how the books are pimped.
A breach of the CIB line would make me go "hmmm....", and starting to look for a short.
Until then, just relax and watch the show.
GBPAUD / EURGBP / AUDUSD Trade Recap (Closing +5.5%) 28.08.25Three positions covered in this recap.
GBP / AUD +2%
EUR / GBP +0.0%
AUD / USD +2.5%
Full explanation as to why I executed on these positions and the management plan with all three.
Any questions you have just drop them below 👇

28.08.25 Morning ForecastPairs on Watch -
FX:GBPAUD
FX:AUDUSD
FX:EURUSD
A short overview of the instruments I am looking at for today, multi-timeframe analysis down to what I will be looking at for an entry. Enjoy!

CPI Data Impact (Consumer Price Index)1. Introduction to CPI
The Consumer Price Index (CPI) is one of the most widely watched economic indicators in the world. At its core, CPI measures the average change over time in the prices that consumers pay for a basket of goods and services. This basket includes everyday essentials such as food, clothing, housing, transportation, healthcare, and entertainment. In simpler terms, CPI is a tool used to track inflation — the rise in the general price level of goods and services.
The reason CPI data carries such weight is because it directly affects the cost of living. When CPI rises, it means the purchasing power of money falls — people need more money to buy the same amount of goods and services. On the other hand, when CPI remains stable or falls, it signals controlled inflation or even deflation.
Every month, governments release CPI figures, and these numbers instantly capture the attention of central banks, investors, businesses, and the general public. This is because CPI not only reflects the current state of the economy but also guides crucial decisions related to interest rates, wages, investment strategies, and fiscal policies.
2. How CPI is Calculated
To understand its impact, it’s important to know how CPI is put together.
Basket of Goods & Services: Authorities create a list of items that represent what an average household typically consumes.
Food & Beverages
Housing & Utilities
Apparel
Transportation
Medical care
Recreation
Education
Miscellaneous goods
Weightage: Each category gets a weight based on its importance in household expenditure. For example, housing and food usually carry higher weights.
Data Collection: Price data is collected from retail stores, service providers, and online markets across the country.
Index Formula: The prices are compared with a base year (say 2010 = 100). If the index rises from 100 to 110, it means there has been a 10% increase in the price level.
Types of CPI Measures:
Headline CPI: Includes all items, even volatile ones like food and fuel.
Core CPI: Excludes food and energy because they fluctuate too much, giving a clearer picture of long-term inflation.
This method ensures CPI reflects the average change in prices felt by consumers, making it a direct measure of inflation.
3. Importance of CPI in the Economy
CPI data is not just about numbers; it has real-world implications:
Purchasing Power: CPI determines how much money is worth in terms of goods and services. If salaries don’t keep pace with rising CPI, people feel poorer.
Wages & Pensions: Many countries link wage hikes, pensions, and social security payments to CPI to protect citizens against inflation.
Tax Brackets: Some tax systems adjust brackets according to CPI so that inflation doesn’t push taxpayers unfairly into higher tax categories.
Business Planning: Companies use CPI to set prices, negotiate contracts, and forecast demand.
Government Policy: Policymakers rely on CPI to shape monetary and fiscal decisions.
4. CPI Data and Central Banks
One of the biggest reasons CPI data is so powerful is its influence on central banks. Institutions like the Federal Reserve (US), RBI (India), ECB (Europe), and BOJ (Japan) watch CPI numbers closely because inflation control is their primary responsibility.
If CPI is too high: Central banks usually raise interest rates to reduce money supply, making borrowing costlier and cooling down demand.
If CPI is too low or negative (deflation): They lower rates or inject liquidity to stimulate spending and investment.
For example, if US CPI comes in much higher than expected, markets immediately anticipate the Fed may raise interest rates. This triggers huge shifts in stock, bond, and forex markets.
5. Impact of CPI on Different Asset Classes
CPI data doesn’t stay in economics textbooks; it directly shakes global markets every time it’s released. Let’s explore the impact across major asset classes:
a. Stock Markets
High CPI (Inflation rising fast): Bad for stock markets in the short term. High inflation raises costs for companies (raw materials, wages, energy) and squeezes profit margins. Investors fear higher interest rates, which reduce future corporate earnings.
Low or stable CPI: Good for equities, as it signals controlled inflation, stable demand, and predictable interest rates.
Sectoral Impact:
Consumer staples (FMCG) may survive inflation better because people always buy essentials.
Technology and growth stocks suffer because their valuations depend on low interest rates.
Banks and financials sometimes benefit as higher rates improve lending margins.
b. Bond Markets
Bonds are highly sensitive to CPI data.
Rising CPI = Higher inflation = Future interest rates may rise = Bond prices fall.
Lower CPI = Bonds rally as investors expect stable or falling interest rates.
For example, a surprise jump in US CPI can cause a sharp sell-off in Treasury bonds within minutes.
c. Forex Market
CPI is a key driver of currency values.
Higher CPI = Expectation of rate hikes = Stronger currency.
Lower CPI = Rate cuts or dovish stance = Weaker currency.
Example: If India’s CPI jumps unexpectedly, the market may anticipate RBI rate hikes, strengthening the Indian Rupee against the US Dollar.
d. Commodities (Gold, Oil, etc.)
Gold: Seen as an inflation hedge. When CPI is high, investors rush to gold to preserve value.
Oil & Energy: Often the cause of rising CPI (fuel inflation). Their prices can rise further when CPI signals strong demand or supply constraints.
Food Commodities: High CPI often reflects higher food prices, influencing futures markets in grains, soybeans, sugar, etc.
6. CPI Data and Investors’ Behavior
CPI releases are like shockwaves in financial markets. Investors, traders, and analysts prepare days in advance for these numbers.
Expectations vs. Reality: If actual CPI matches forecasts, markets remain calm. But if CPI is higher or lower than expected, markets react violently.
Short-Term Traders: Use CPI releases for quick moves in forex, stocks, and commodities.
Long-Term Investors: Adjust portfolios based on CPI trends, shifting from growth stocks to defensive assets during inflationary times.
Hedging Strategies: Many hedge funds use derivatives like futures, options, and inflation-linked bonds to guard against CPI surprises.
7. Case Studies of CPI Shocks
a. US CPI in 2021-2022 (Post-COVID Inflation Spike)
After COVID-19, supply chain disruptions and stimulus spending caused US CPI to soar to 40-year highs. The Federal Reserve was forced to raise interest rates aggressively, leading to a global stock market correction, bond sell-offs, and a stronger US dollar.
b. India’s CPI and RBI Actions
India often battles food inflation due to monsoon impacts. A spike in food prices raises CPI quickly, forcing RBI to tighten monetary policy. This directly impacts borrowing rates for businesses and housing loans.
c. Eurozone Energy Crisis (2022)
The Russia-Ukraine conflict led to soaring energy prices in Europe. CPI in countries like Germany and the UK hit record highs, pushing the European Central Bank and Bank of England into aggressive rate hikes.
8. CPI Data in Global Context
CPI is universal, but its impact varies:
Developed Economies: Focus on core CPI, as food and energy form smaller shares of expenditure.
Developing Economies: Headline CPI is more important, since food and fuel dominate consumption.
Global Markets: US CPI carries the heaviest weight because the US Dollar is the world’s reserve currency. A higher-than-expected US CPI can shake global equity, forex, and commodity markets.
9. CPI vs. Other Inflation Measures
WPI (Wholesale Price Index): Tracks price changes at wholesale level; often a leading indicator of CPI.
PCE (Personal Consumption Expenditure, US): A broader measure used by the Fed.
GDP Deflator: Measures price changes across the economy, not just consumers.
CPI remains the most relatable and widely followed measure since it directly reflects household expenses.
10. How Traders Use CPI in Analysis
Volume & Price Action: Traders look at how markets react immediately after CPI release (volatility spikes).
Forward Guidance: They link CPI trends with central bank statements to predict interest rate cycles.
Technical + Fundamental Mix: Many combine CPI-driven sentiment with technical chart patterns for entries and exits.
Options Trading: CPI days often see huge spikes in implied volatility; options traders profit from straddles or strangles.
11. Criticism and Limitations of CPI
While CPI is powerful, it has limitations:
The basket of goods may not reflect actual consumption of all groups (urban vs. rural, rich vs. poor).
It doesn’t always capture asset inflation (like rising real estate prices).
Substitution bias: If beef prices rise, consumers may switch to chicken, but CPI still reflects beef inflation.
Globalization: Many goods are imported, so CPI may reflect international price shifts more than local demand.
12. Conclusion
CPI data is one of the most important numbers in economics. It is not just about tracking inflation but also about shaping central bank decisions, guiding government policies, influencing financial markets, and affecting every household’s cost of living.
A single CPI release can shake stock markets, move bond yields, strengthen or weaken currencies, and shift commodity prices. For investors and traders, understanding CPI is crucial because it links economic fundamentals to market movements.
In the modern interconnected world, where inflationary shocks in one country can spread globally, CPI has become more than just a domestic indicator — it is a global barometer of economic health. Whether you are a policymaker, investor, business owner, or simply a consumer, CPI impacts your daily financial reality in one way or another.
27.08.25 Morning ForecastPairs on Watch -
FX:GBPCAD
FX:AUDUSD
FX:GBPAUD
A short overview of the instruments I am looking at for today, multi-timeframe analysis down to what I will be looking at for an entry. Enjoy!

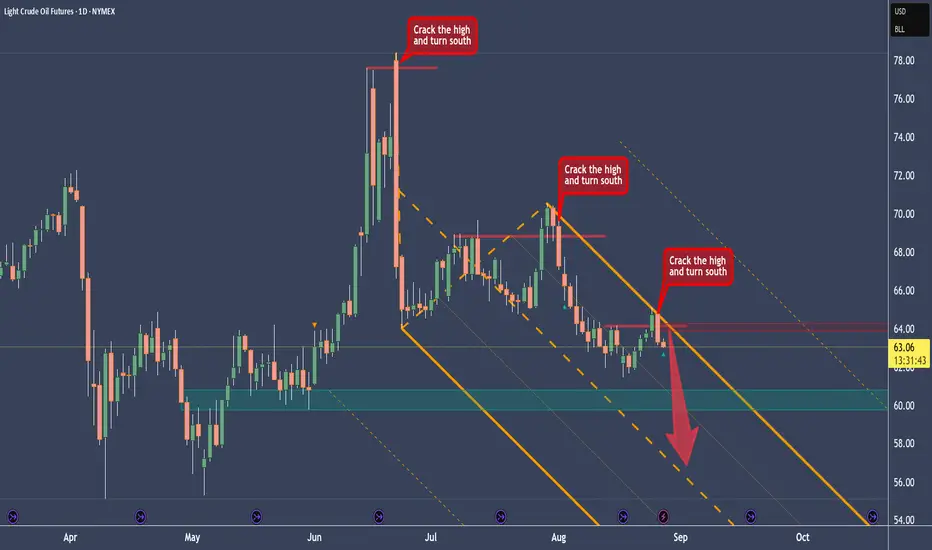
Crude Oil Short After Finding A Recurring BehaviorAfter I cleared the CL chart, I immediately saw a behavior that we can use for a setup right now.
You see that the highs got cracked, and then immediately price turns to the south. And since we are in a downtrend on Crude, we have a legit Short-Trade at hand.
With the modified Shiff-Fork you see how nice CL is reacting at the U-MLH, where it get's rejected. This level also coincides with the crack level.
I personally would love a pullback up to the crack-zone before shorting it. Maybe the trading Gods give us a gift on this Wednesday.
Talking about Wednesday: today we get the Crude Oil EIA numbers, which will probably move the markets.
However you plan is if you trade it, don't have FOMO. There are many more trades to come in your trading career.
Have a happy hump day §8-)
SNP500 ShortThis is against the H4 trend; however there is very good resistance at this level, as it is the all-time high and contesting the previous week's high.
There is a pattern on M15 to show a potential reversal zone.
Multiple tops on M15 to H1 with divergence and showing the trends flattening out.
This is against the trend so look to get out at M15 oversold

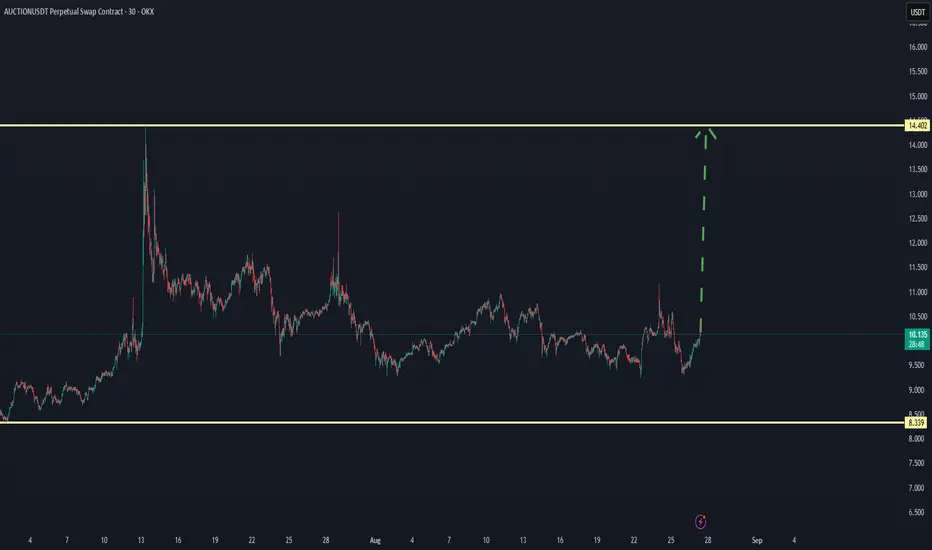
AUCTION CAN SEE A SHOT TREND TO UP $14 by confirmationAUCTION CAN SEE A SHOT TREND TO UP $14 by confirmation
AUCTION/USDT one of the coins that shows a pre-increase ( checking if it can get proof next hours). When this gets confirmed, there is a high chance ofa breakout.
When new updates coming will add here below at this chart.
XAUUSD - Daily and 4hr | Charts are bullish Daily:
Gold is back in the upper range of this consolidation zone. You can see the high of the range is 3440, and the low is 3250 roughly.
Gold is clearly making a bullish pennant pattern. When gold reached the top trend line, we expected a breakout. Once again, we are finding resistance. (as of now)
4-Hour
Inverted Head and Shoulders - Simple trading
Gold broke out of an inverted head and shoulders pattern and just hit the target at 3395. Gold is now finding resistance and failing to find support.
Bulls:
Gold is pulling back into an Inverted FVG on the Daily. If the price is bullish, then we should reject the gap with ease. (Gap is from 3360-3376) Gold is on the brink of a daily breakout or another rejection back down to support.
Bears:
If Gold continues to fall with clean displacement through support. We can say the news from last week was false, and gold is still trending bearish. expect a fall back down to 3320

Setting up for a Long Swing TradeHi Traders!
I've been keeping an eye on CHEWY for a few weeks now. Chewy dipped into the 78% fib, and set up for a reversal. I'd like to see a possible retest at a Daily Breaker Order Block at around $39.50. If that can verify that the Daily CHOCH is valid, I'm planning to swing this Options trade for a few weeks. My first target would be around $42. In addition, the monthly IMO is bullish and could give us another long term swing.
Alerts are set for now.
*DISCLAIMER: I am not a financial advisor. The ideas and trades I take on my page are for educational and entertainment purposes only. I'm just showing you guys how I trade. Remember, trading of any kind involves risk. Your investments are solely your responsibility and not mine.*

26.08.25 Morning ForecastPairs on Watch -
FX:AUDUSD
FX:GBPCAD
FX:GBPAUD
A short overview of the instruments I am looking at for today, multi-timeframe analysis down to what I will be looking at for an entry. Enjoy!

Gold price analysis on August 26The uptrend is still maintained today. The focus is on observing the support zones to find BUY points.
3370 → important support zone (50% of H4 candle strong buying force from Asian session).
3358 → candle wick zone, playing the role of bullish wave structure.
If the price holds above these zones, the expansion target can be towards 3428 today and the following sessions.
📈 Trading strategy
BUY at 3370 (price rejection, 50% of H4 candle).
BUY at 3358 (liquidity candle wick zone).

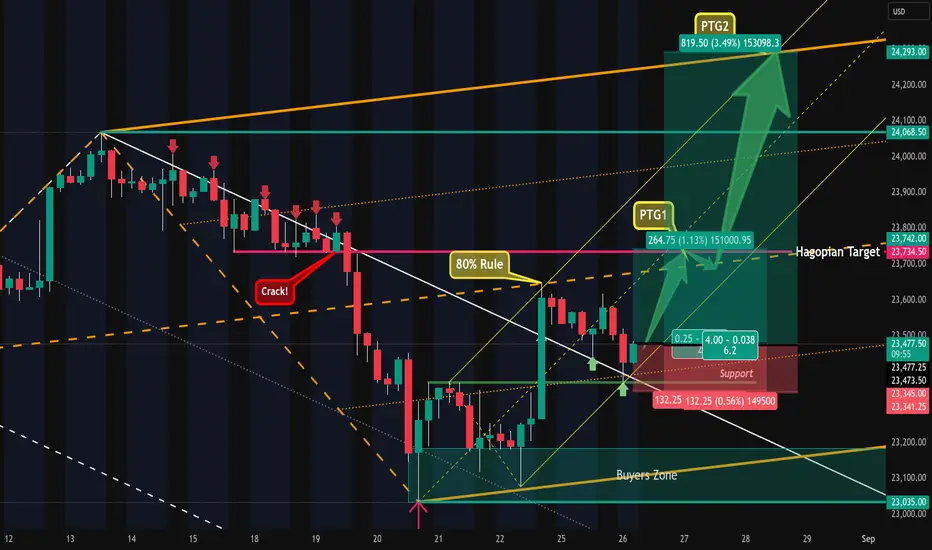
Nasdaq - Intraday Setup & Potential TradePrice was not abel to trade out of the white forks U-MLH and got constantly rejected.
It cracked the little support and fell down, but missed the white Centerline, creating a HAGOPIAN.
Then price traded outside of the white fork, following a textbook test/retest at the white U-MLH and found support.
The yellow fork points upwards, showing us the most probable path of price.
Going long near the white U-MLH gives us several potential targets:
1. the orange Centerline
2 the yellow Centerline
3. the HAGOPIAN target line.
4. the orange U-MLH
Stops would be below the last red bars low, because this, as of the time of writing, is the best structural level to hide behind.
I'm off to the mountains, have a happy trading day!
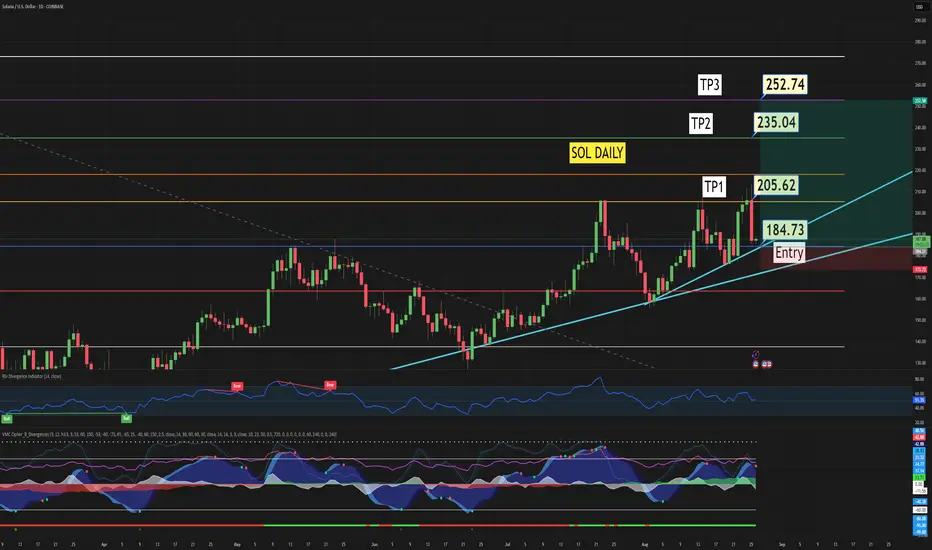
Sol Long Trade set up ideaSOL is at an important level right now. On the secondary trendline and at a 0.5 Fib pulled from ATH to April Low.. And currently on smaller time frame its in the middle of fibs with liquidity up and down.. So With BTC coming down to 108.8 after hours and Sol coming down to 187 kinda in the middle of noting I wouldn't be surprised for BTC to retest 108.8-107.500k (golden pocket) 618 fib tomorrow am market open and maybe Sol gets to 184.. Either way in this 185-180 range I like SOL for a move up to 232-252 if we get a bounce. If BTC falls below 106 this fails too so just keep a watch on both But looks very nice.
BTC CAN TURN MONDAY IN A GREEN DAY..📊 Market Update
On the lower time frame, BTC is still in a downtrend. However, there is a possibility of a green day if BTC targets the first level at 113.8K, with a 1-hour time frame confirmation.
The main confirmation for BTC will be at 115.4K. A move from 113.8K could provide an opportunity to consider new day trades.

25.08.25 Morning ForecastPairs on Watch -
FX:USDCAD
FX:EURAUD
FX:AUDJPY
A short overview of the instruments I am looking at for today, multi-timeframe analysis down to what I will be looking at for an entry. Enjoy!

TITAN Reversing from Support ZoneNSE:TITAN is reversing from Support Zone. Below are the Targets and Stoploss. Once you achieved the 1st Target, if you are waiting for the next Targets, kindly use Trailing Stop Loss.
You can Buy at the current value.
!st Target - 3600
2nd Target - 3650
3rd Target - 3700
4th Target - 3800
Stop Loss - 3370

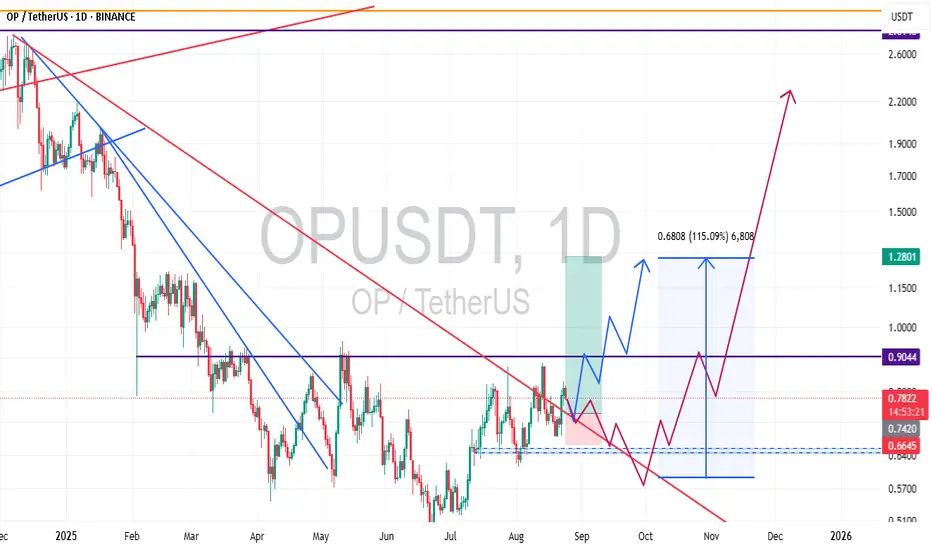
crypto pair opusdt Greetings dear friends
I have two predictions for the OP currency that you see in the picture
I hope they come true and friends will use them
22.08.25 Morning ForecastPairs on Watch -
FX:EURCAD
FX:GBPAUD
A short overview of the instruments I am looking at for today, multi-timeframe analysis down to what I will be looking at for an entry. Enjoy!

CHFJPY / GBPUSD / EURGBP Trade Recaps 22.08.25A tester trade on CHFJPY with the reasons explained as to why this was a test position, a long position executed on GBPUSD, a solid setup that this time around just didn't commit. And lastly a long position on EURGBP playing the failure of sell structure and getting involved in the buys.
Full explanation as to why I executed on these positions and the management plan with all three.
Any questions you have just drop them below 👇

Gold Price Analysis August 21Gold has broken the Trendline and returned to the wide trading range of 3330 - 3360, an important accumulation area in the past few days. This will continue to be the reference area for investors to find entry points.
In the Asian session, the price adjusted to around 3332 - the convergence between the lower edge of the accumulation zone and the 0.5 Fibonacci retracement of yesterday's increase. This is an important milestone to determine the next direction:
✅ If it rebounds from 3332 → the possibility of forming a new uptrend, target 3378.
❌ If H1 closes below 3332 → confirming the return of the downtrend, the price may expand to 3285 in the short term.
📌 Reference strategy:
Buy when the price retests 3333 and there is a clear buy signal.
Sell when it breaks & holds below 3332.
Sell DCA when it breaks 3320 (confluence of trendline + previous break zone).
🔑 Important Zone
Support: 3332 – 3320 – 3310 – 3300 – 3285
Resistance: 3358 – 3378
