XAUUSD On the 1-hour chart, Gold is currently trading inside a tight symmetrical triangle, with price compressing between a rising trendline from the November 5th lows and a descending trendline from the November 14th highs.
Price is hovering around the $4,070 zone, which also aligns with the 50-period moving average, showing indecision but increasing pressure for a breakout.
A break and retest above the $4,085–4,095 resistance zone (highlighted in grey) may trigger a bullish momentum wave. The projected breakout target points toward the $4,180–4,220 region, based on the measured move from the previous swing.
As long as price holds above the rising trendline support, the structure remains bullish, with buyers expected to step in on any retest of support.
Trader1mran

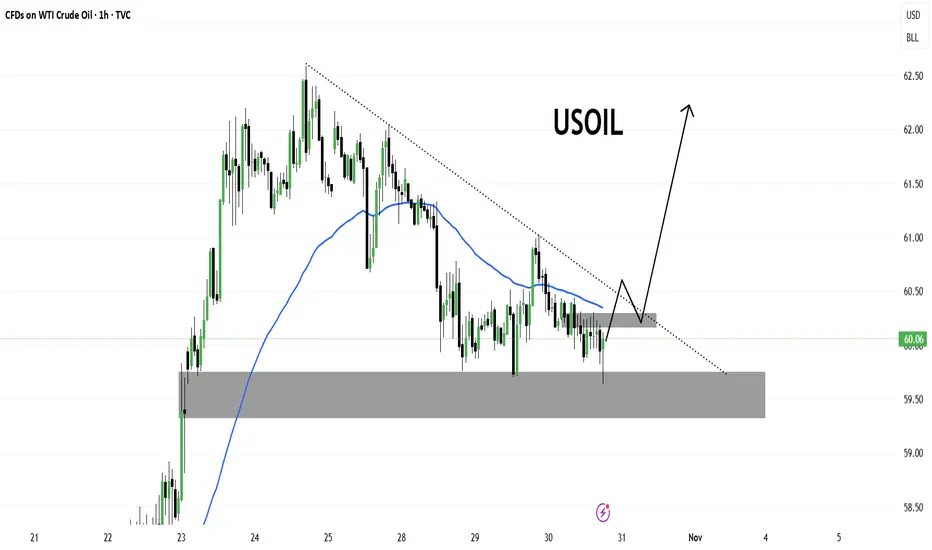
USOILCrude oil is currently trading around the $60.00 level, consolidating after a recent bearish phase. Price has respected the support zone near $59.50–59.80, forming a potential accumulation base.
A descending trendline is acting as dynamic resistance, while the 50-period moving average is flattening—indicating that bearish momentum is losing strength.
The projection suggests a possible breakout above the trendline, followed by a retest of the breakout zone before a potential rally toward the $62.00–62.50 area.
As long as the price holds above the support zone, the bullish scenario remains valid. A breakdown below $59.50 would invalidate this setup.
Gold Elliott Wave Analysis – Potential Wave (4) Completion ZoneGold (XAU/USD) on the daily chart appears to be completing a classic Elliott Wave 5-wave impulse structure. After a strong rally into the wave (3) high, price is currently retracing toward the projected wave (4) correction zone.
The highlighted support area aligns with key Fibonacci retracement levels:
0.5 retracement: around $3,845
0.618 retracement: around $3,718
This region also coincides with the lower boundary of the ascending channel, adding confluence for potential bullish reversal.
If wave (4) finds support within this zone and maintains structure, a new impulsive rally toward wave (5) could begin — targeting the upper trendline resistance near $4,500–$4,600.

XAUUSDGold is currently testing a major confluence support zone, aligning with the daily inclining trendline and a previous demand area around the 4000–3980 region.
The recent sharp decline has brought price back into this key structure, where buyers previously stepped in. If this zone holds, we could see a potential bullish reversal toward the 4200–4250 area in the coming session
A strong bullish reaction from this level would confirm continuation of the broader uptrend. However, a clean break below 3980 could signal a deeper retracement.

XAUUSDGold is currently trading near $4,229, showing signs of exhaustion after a strong bullish run within a rising wedge pattern. The price has recently broken below the wedge support, and a bearish divergence is visible on the RSI, indicating weakening momentum.
🔹 Key Zone: The grey area around $4,220–$4,230 may act as a short-term retest zone.
🔹 Bearish Outlook: If price fails to reclaim the wedge support, a continuation move toward the $4,107 support zone is likely.
🔹 Further Support: Below that, next key level sits around $4,015.
🔹 Bias: Short-term bearish correction expected unless price breaks back above $4,235 with strong momentum

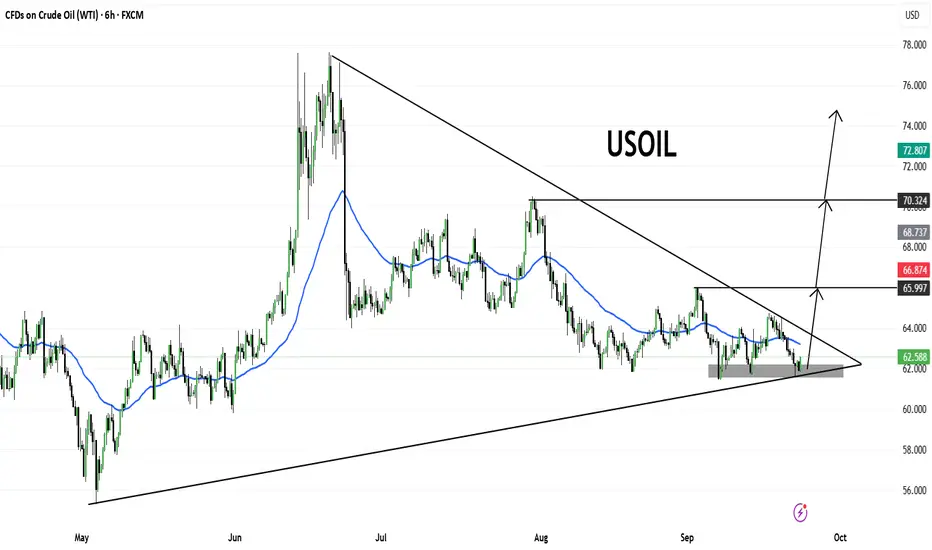
USOILPrice is consolidating inside a large symmetrical triangle pattern, with strong support forming around the $62.00–62.50 zone. A breakout is approaching as price nears the apex.
🔹 Key levels to watch:
Resistance zone: $65.99 – $66.87
Major breakout confirmation: $70.32
Upside target (if breakout sustains): $72.80 – $74.00
🔹 Bias:
As long as $62.00 holds, bulls may attempt a breakout towards the upper resistance trendline. A clean close above $66.87 could trigger momentum toward $70.32 and potentially $72+.
⚠️ However, a failure to hold $62.00 support may invalidate the bullish setup and push price lower.
DXY Analysis – Possible Fakeout Ahead of NFP?The Dollar Index (DXY) is currently consolidating within a large symmetrical triangle formation. Price is sitting around 98.00, testing both horizontal support and the ascending trendline.
We could see:
A fakeout to the downside around the upcoming NFP release, tapping into the demand zone near 97.50 – 97.00.
If this level holds, DXY may quickly reverse and break higher, leading to strong USD strength across major pairs.

ARBUSDTARB is showing a strong bullish structure after reclaiming the key support zone around 0.48 – 0.49 USDT (highlighted in grey). Price is respecting the ascending trendline and currently holding above the 50-day EMA (blue line), which indicates momentum is shifting in favor of buyers.
Support zone: 0.48 – 0.49
Trendline support: rising from 0.30 lows
Immediate resistance: 0.60
Major target zone: 1.20+ (if breakout sustains)
Invalidation: A daily close below 0.48 and trendline would weaken the bullish outlook, with 0.30 as the next major support.
Overall, as long as ARB maintains this structure, the bias remains bullish with a potential upside towards 1.20 USDT in the coming weeks.

EURCADPrice recently swept liquidity above the previous highs and immediately rejected, confirming a liquidity grab. This move also led to a market structure shift (MSS) to the downside.
Currently, EURCAD is pulling back towards the supply zone (grey box), where sellers are expected to step in. If price respects this area, we could see continuation to the downside in line with the bearish structure.
Key Points:
Liquidity sweep above highs.
Bearish market structure shift.
Retest of supply zone in progress.
Bearish continuation expected if rejection holds.
📉 Outlook: Bearish – potential downside targets lie towards 1.5950 – 1.5850 zone.

XAUUSDGold is still trading inside a descending channel, respecting lower highs and lower lows. Currently, price is testing the short-term descending wedge, with a possible pullback into the 3340–3350 resistance zone (highlighted in grey).
As long as price remains below this resistance and the channel trendline, the bias remains bearish, and we could see another leg down toward 3240–3220 in the coming sessions.
Key Points:
Price respecting bearish structure.
Short-term pullback expected into resistance.
Sellers likely to step in below 3350.
Downside targets: 3260 → 3240 → 3220.
Bias: Bearish below 3350

NZDUSD – Breakout from Inverse Head & Shoulders + Trendline AreaNZDUSD is showing a bullish reversal setup on the 1-hour chart.
Price has broken above a long-standing descending trendline, indicating a potential shift in market structure.
A clear Inverse Head & Shoulders pattern has formed, suggesting a bullish reversal.
Price has broken above the neckline and the key resistance zone (highlighted in grey)
he 50 EMA has now been reclaimed, supporting the bullish bias

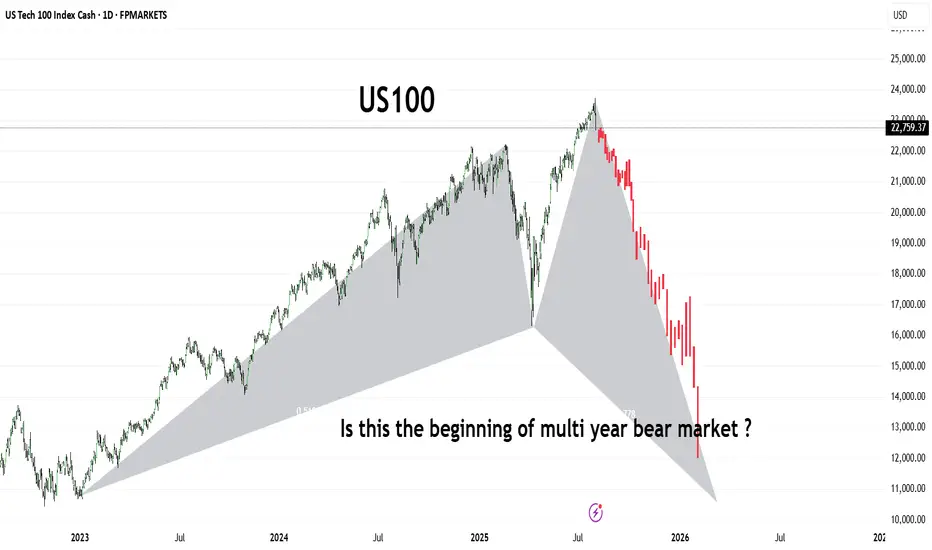
US100The US100 (Nasdaq 100) has shown a dramatic shift in trend, forming what appears to be a large-scale bearish harmonic pattern or potential M-top structure. After reaching its peak in mid-2025, the index has entered a sharp downward trajectory, shedding significant value in a short span.
This chart raises a critical question for long-term investors and traders:
Are we witnessing the early phase of a prolonged bear market that could stretch into 2026 and beyond?
🔻 Key Observations:
Bearish structure developing with aggressive selling pressure.
Potential breakdown from long-term support trendlines.
Momentum suggests institutional risk-off behavior.
Stay alert for macroeconomic cues, interest rate policy, and earnings season signals. A break below 13,000 could confirm a deeper bear cycle
USDCHFUSDCHF is approaching a critical breakout zone after forming a bullish ascending triangle pattern. The pair has been in a sustained downtrend but is now testing the confluence of a descending trendline resistance and the 50-period EMA.
Price is currently consolidating just below the key resistance zone near 0.8000. A clean breakout and retest of this zone could trigger bullish momentum, potentially targeting the 0.8250 region in the coming sessions.

GBPUSDThe market structure on GBPUSD shows a clear liquidity sweep above recent highs, followed by a market structure shift (MSS) to the downside, signaling a potential reversal. After the liquidity grab, price failed to sustain above the swept highs and started to form lower highs.
The RSI indicator also confirms a bearish divergence, strengthening the bearish bias. Currently, price is consolidating below the MSS level, which could act as a supply zone on any retest.
A strong bearish continuation is expected, targeting the SSL (Sell-side Liquidity) level marked below, which aligns with a potential demand zone from late June. The bearish projection suggests a move toward the 1.3350–1.3400 area.
This setup favors short opportunities on lower timeframe pullbacks, maintaining a bearish outlook as long as the price remains below the MSS.

XAUUSDGold has shown a strong historical pattern of impulsive rallies followed by significant corrections. After the recent explosive move from the $2,067 breakout zone to new all-time highs around $3,500, representing a +67% rally, the metal appears overextended and due for a healthy pullback.
Past cycles suggest that after such parabolic moves, price tends to retrace back to key demand zones or previous accumulation levels. In this case, the medium-term correction target aligns with the $2,800–$2,750 region — a strong structural support and confluence with the 2024 breakout base.
While the long-term trend remains bullish, this setup hints at a potential mean reversion or consolidation phase. Traders should remain cautious at current highs and watch for signs of distribution and lower highs forming in the coming weeks

USDJPYUSDJPY is currently approaching a major breakout zone as it nears the apex of a symmetrical triangle pattern. The pair has broken above the key horizontal resistance area around 145.80–146.00, which previously acted as a strong supply zone. Price is now challenging the descending trendline resistance.
A confirmed breakout and retest of the triangle and resistance zone may open the door for a bullish continuation toward 147.50, and potentially 150.00+, as marked on the chart. However, if the breakout fails, we may see a pullback toward the 145.00–144.80 support region before any further upside.
This setup highlights a potential breakout-retest-continuation scenario. Traders should watch for price action confirmation near the trendline for further direction.

XAUUSD Is XAUUSD getting ready for new ATHs? Gold has formed a clear bullish flag pattern and retested it clearly. One Thing I am looking for the retest of 50 DEMA . If the Price holds above the 50 DEMA, there are much chances that gold may target the new ATHs very soon.
What you guys think about it?

EURUSDEU is forming a solid bullish structure. Recently is break through the ascending symmetrical triangle with solid bullish candle. Any retest of LTF structure will be a nice buying opportunity.

XAUUSDGOLD is been pushed down very hard and now is trading at very crucial level, horizontal and at trendline support.
William percentage range is at over sold level which is also suggesting a relief rally in gold.

US100US100 has shown great strength after terrif news.
If we look at the bigger picture, recent bullish rally looks like a pull back. Currently it is heading towards very important region , 20500 which is also the 61% retracement level.
If the price close above 20500 then we can consider it a new bullish rally.

XAUUSDIs XAUUSD building for massive breakout?
If XAUUSD sustains 3300 level then it can target 3400 in no time.

GBPNZDGBPNZD is forming strong bullish structure.
Recently the price is retraced to Daily breakout level and also has given the pivot to daily inclining trendline.
It looks like a perfect buy setup.

GBPUSDRising wedge with bearish divergence, break of 1.3360 , which is the neckline of double top, break of this neckline starts the immediate sell pressure.
