CSE All Share Price Index 📈 CSE All Share Price Index (ASPI) – Technical + Fundamental Outlook
🔹 Trend Overview
The index is moving inside a strong ascending channel.
Multiple successful retests of channel support show consistent buying interest.
As long as price stays inside the channel, the trend remains bullish.
🎯 Key Price Zones to Watch
Immediate Resistance: 22,800 – 23,000
→ Expect mild profit-taking here.
Breakout Zone: Above 23,000
→ If broken with volume, next targets could be 23,500 → 24,200.
Ideal Buy Zone (Pullback): Around 22,000
→ Mid-channel area — good for dip entries.
Trend Invalidation: Below 21,000
→ Only a break below this would signal real weakness.
📊 Market Behavior
Candles are getting stronger — buyers in control.
No major upper wicks — little selling pressure currently.
A short-term pullback is possible, but structure is still very healthy.
🧾 Fundamentals Support the Trend
Increasing foreign inflows.
Interest rates are stable to slightly easing — supports equities.
Corporate earnings for key sectors improving.
Currency risk (LKR) still something to monitor but currently manageable.
✅ Strategy Suggestions
Short-Term Traders: Take partial profit near 22,800-23,000 and reload on dips.
Medium-Term Investors: Hold as long as we stay above 21,000.
New Entries: Better to buy dips rather than chase highs.
🟢 Conclusion
“Still in a clean bullish structure. Every dip inside the channel is a buying opportunity — not a reversal signal.”
Traderchamp

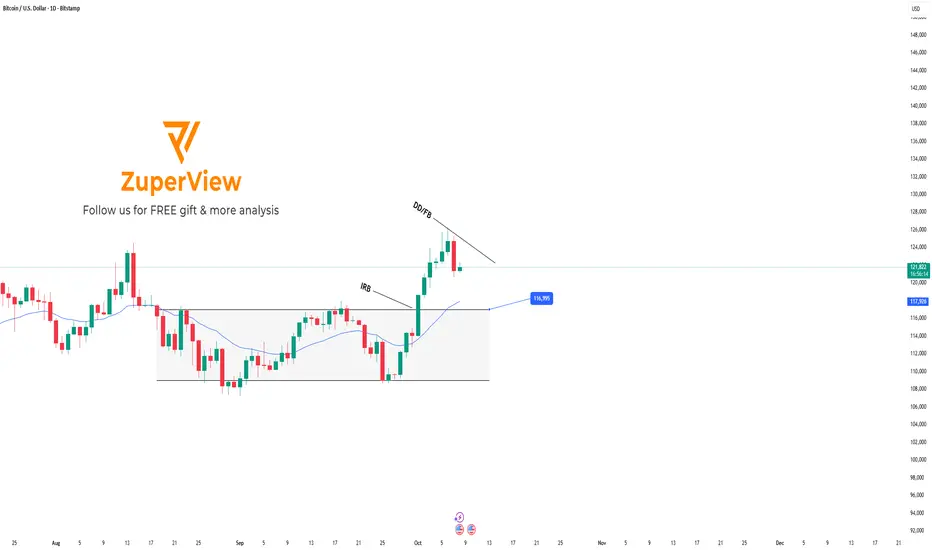
BTCUSD: Short term sell setup - Long term buy opportunity ahead
🔁 Review of Yesterday’s Plan
After BITSTAMP:BTCUSD rallied and set a new high at 126,190, the market entered a corrective phase.
In yesterday’s plan, we expected that:
Once the H1 candle closed below EMA, BTC could continue its decline and retest the lower support zone.
After touching support, price might pause briefly, then break lower to continue the downtrend.
Currently, BITSTAMP:BTCUSD has broken below and is consolidating sideways within a narrow range on H1, aligning perfectly with the anticipated correction scenario.
📈 Trading Plan for Today
On the H1 timeframe
Two key levels to watch for the Sell plan:
Resistance: 123,449
Support: 121,293
Scenario 1:
If price fails to break above EMA and keeps consolidating near 121,238While staying below EMA, → wait for a BB (Break Block) confirmation → Sell following the breakout signal.
Scenario 2:
If price retraces toward EMA and moves up to test 123,471→ wait for bearish confirmation around resistance to Sell from that level.
On the Daily timeframe
After the strong rally, BTC is now undergoing a technical correction.
The plan is to wait for price to pull back to retest the upper boundary of the previous range around 116,995, and Buy from that area.
Alternative setup:
If price reaches EMA sooner without testing the 116,995 zone,→ wait for BTC to accumulate momentum, then look for DD (Double Doji) / FB (First Breakout) pattern confirmation → Buy after signal confirmation.
🎯 Summary:
Short-term (H1): Bearish correction.
Mid-term (Daily): Bullish bias intact, waiting for confirmation near support.
Please like and comment below to support our traders. Your reactions motivate us to do more analysis in the future 🙏✨
Daniel Miller @ ZuperView
BTC Bearish Structure, $109,350 Next? Bitcoin
Bearish Outlook
Structure: Trendline, Key Level and Bearish Flag
BTC’s recent price action shows strong selling pressure, with a clear bearish breakout below the hourly trendline and the key level at $114,500. Currently, price is consolidating within minor support and resistance levels. A further break below the minor support could trigger continued downside momentum, targeting the next support at $109,350.

East West Properties PLC | Bearish OutlookEast West Properties PLC
Bearish Outlook
Structure: Daily Resistance, Trend Line
A daily resistance has been identified where a reversal has occurred. For a further decline, a bearish breakout below the trendline is required. However, as long as EAST trades above the trendline, the overall market trend remains bullish.

XAUUSD | Expanding Triangle | Bearish OutlookXAUUSD is signaling a potential reversal or retracement within the recent bullish trend on the hourly timeframe, following the sharp drop triggered by the FED interest rate decision. Price has reached a high above $3727, aligning with the upper boundary of the expanding triangle and key resistance, making this level a likely point for a possible reversal.

First Capital Treasuries PLC | Bullish OutlookFirst Capital Treasuries PLC
Bullish Outlook
Structure: Breakout and Retracement on the recent bullish rally
FCT has shown strong bullish momentum, but with the recent buying pressure, we’ve identified a sharp rejection followed by selling. This suggests a potential retracement in the recent rally before any continuation to the upside. Additionally, a gap has appeared near the highlighted key support level, which could play a crucial role in the next move.

Commercial Bank PLC | Bearish OutlookCommercial Bank PLC
Bearish Outlook
Structure: Bullish Channel and Reversal on Upper Boundary
As expected the price has started to respect and reverse on top by respecting the upper boundary of the bullish channel formed. We expect a retest back on the trend line/ lower boundary formed.

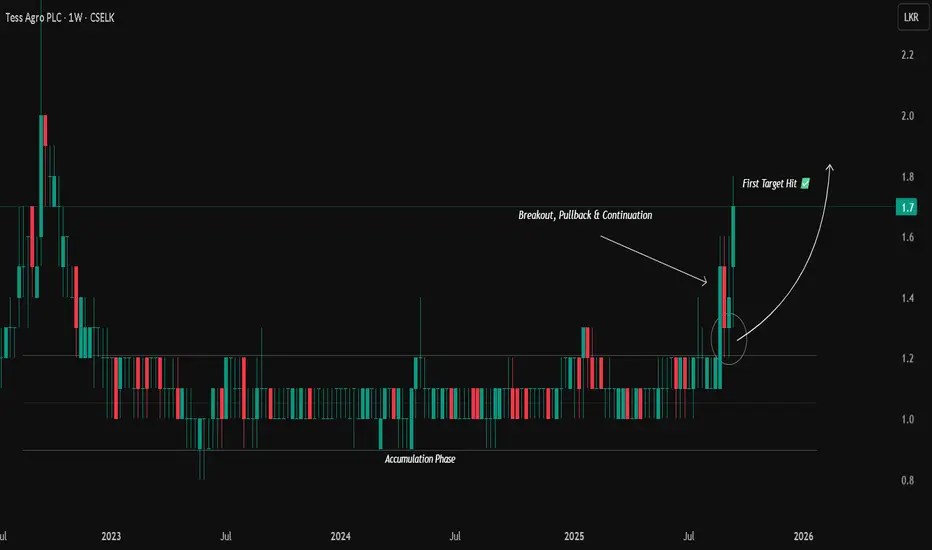
TESS Agro PLC | First Target AchievedTESS Agro PLC
Bullish Outlook
Structure: Accumulation Breakout and Continuation
Price rally has hit our first target level at Rs1.7 successfully with the recent bullish sentiment built on the market. And now we hold our positions towards the next target above Rs 2.0
LVL Energy Fund PLC | Requires ConfirmationLVL Energy Fund PLC
Neutral Outlook
Structure: Breakout on resistance with strong weekly rejection.

Sampath Bank PLC | Bearish OutlookSampath Bank PLC
Bearish Outlook
Structure: Bearish sentiment building on top followed by bullish channel and trendline


CADJPY BEARISH SETUP💱 CAD/JPY Reversal Watch: Bearish Pressure Builds Below Resistance
4-Hour Candlestick Chart – Analysis as of June 30, 2025
The CAD/JPY pair is showing signs of weakening momentum after repeated failures to break above the key 106.000 resistance level. This suggests growing downside pressure and increased chances of a corrective move in the near term.
🔍 Key Technical Levels
🟥 Current Price: 105.481
🚫 Resistance Zone: Around 106.000 — multiple rejections signal seller dominance
🛡️ Key Support Level: 104.000 — acting as the downside magnet
📉 Downward Arrow: Suggests bearish directional sentiment remains intact
🧠 Technical Interpretation
📌 Price action is forming a lower high, a classic sign of a potential short-term reversal.
📌 Repeated failures near the 106.000 mark highlight resistance strength and declining bullish interest.
📌 A drop below 105.000 could intensify downside momentum, with the 104.000 support as the next major level.
📌 For bulls to regain control, the pair must reclaim 106.000 with solid buying volume.

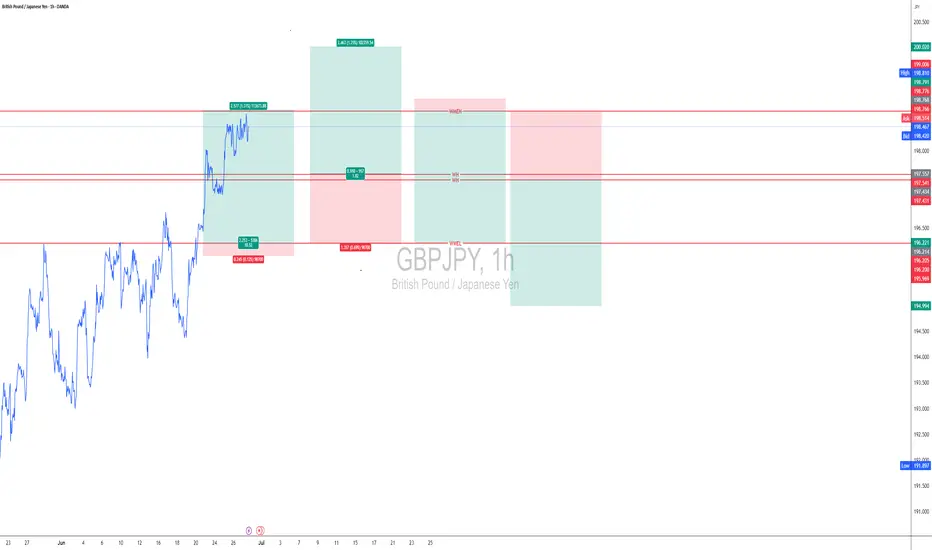
ANALYSIS FOR THE UP COMING DAYS AND WEEK FOR GBPJPY -GJ
Trading involves speculation and probabilities, making market direction predictions challenging. Mastering a strategy that works for you is crucial. Currently, I focus on my strategy to consistently profit.
Here's my analysis for the upcoming days: WH and WL levels indicate market direction. If the price closes above WH by Tuesday, expect an upward trend; if below WL, expect a downward trend.
For trading decisions, enter at WMEL or WMEH levels, or trade between them if you prefer and experienced. Always manage your risk carefully.
Don’t worry about the names, these are the names I have given my strategy:
Week High-WH
Week Low- WL
Week High Margin of Error High - WMEH
Week High Margin of Error Low – WMEl
197.5414432 WH
197.4305568 WL
196.2045568 WMEL
198.7674432 WMEH
GRIFFAIN BEARISH SETUPGRIFFAIN/USDT (1H Chart) – Distribution Phase Signals Short-Term Bearish Reversal
The 1-hour chart of GRIFFAIN/USDT on Binance displays a distribution pattern at the recent high, suggesting bullish exhaustion and an imminent correction. Price has now broken below the consolidation range, confirming a shift in intraday sentiment.
🔍 Key Technical Insights:
Distribution Zone Formed: Price stalled at the top with several failed attempts to push higher, forming a range – a classic sign of distribution before reversal.
Bearish Breakdown: The bearish candle has breached support, initiating a potential downward move toward the 0.5 Fibonacci retracement level.
Key Level to Watch:
Next Target: $0.0400 (50% Fib level + historical demand zone)
Further Support: $0.0360 (Fib 0.786 region)
📉 Outlook & Expectations:
Short-term bias remains bearish below the $0.0458 zone. As long as price stays below the distribution range, expect continuation toward the $0.0400 support area, aligning with key structural and Fibonacci levels.
This setup is ideal for intraday or short-term swing traders watching for pullback entries or breakdown continuation.

XMR BEARISH SETUPWith the recent bearish momentum we have witnessed a breakout on support and the recent pullback can trigger another selling pressure as a continuation of the major bearish trend to the downside.

ZECUSDT BEARISH SETUPIdentified a trend breakout under the daily timeframe which has a potential for a retest back on the key zone highlighted. Expecting a continuation in the bearish trend to follow up price target close to $40.

BITCOIN BEARISH SETUPBitcoin (BTC/USDT) – Breakdown from Double Top Confirms Bearish Trend Continuation
The 4-hour chart of BTC/USDT (Binance Perpetual Contracts) presents a textbook double top formation followed by a confirmed breakdown below structural support levels. The bearish trend has already met its first target, and technicals suggest the move could extend lower toward the key demand zone around $96,000.
🔍 Key Technical Highlights:
Double Top Pattern: Clear double top structure formed between $109,000–$110,000, followed by a strong rejection.
Support Break: Price broke down below key support at ~$105,000, triggering a sell-off and validating the bearish reversal.
Bearish Retest: After the breakdown, price retested the broken trendline (highlighted with a red zone) and failed to reclaim the range.
First Target Hit: Price achieved the first projected support zone at around $101,000.
Next Target: Based on measured move projection and previous structure, the next downside target lies near the $96,000 mark.
📉 Outlook:
The structure remains bearish as long as BTC trades below the broken support-turned-resistance zone (~$105,000). Momentum favors continued downside toward the next key zone unless a significant bullish reversal signal emerges.

CSE ASI BEARISH SETUPThe monthly chart of the CSE All Share Price Index (ASI) reveals a technically significant scenario: the index is currently testing the upper boundary of a long-term ascending channel while also aligning with the 1.618 Fibonacci extension, both of which signal potential reversal pressure ahead.
Key Observations:
Long-Term Resistance: The price is testing the channel’s upper resistance line near the 17,000 – 17,700 zone, where rejection often occurs historically.
Fibonacci Confluence: The current high coincides with the 1.618 Fibonacci extension, a critical level where long rallies often stall or reverse.
Bearish Candlestick Pattern: The formation of a potential bearish reversal candle near the resistance zone is an early signal of seller interest.
Expected Retracement Levels:
Initial support lies at the 0.382 and 0.5 Fibonacci retracement zones, around 15,000 – 14,000.
Deeper correction could target the 0.618 level (~13,000), which aligns with previous breakout structure and the channel midline.
Conclusion:
The ASI appears overextended after a strong bullish leg and is currently showing signs of exhaustion at the top of a multi-year channel. Unless price breaks above and sustains above 17,700, a correction toward the 13,000–14,000 zone is likely, supported by Fibonacci retracement levels and the channel structure.
This presents a potential medium-term bearish outlook for investors and swing traders, with caution advised around current highs.

AUDNZD BULLISH SETUPThe 4-hour chart of AUD/NZD shows a strong bullish breakout from a prolonged consolidation phase, followed by a healthy retest of the breakout level, suggesting the pair is gearing up for further upside.
Key Observations:
Consolidation Breakout: After spending several weeks in a tight consolidation range between 1.0760–1.0800, the price has convincingly broken above the range resistance near 1.0810.
Key Level Retest: The breakout zone (previous resistance) is now acting as new support, confirmed by multiple rejections (highlighted area).
Bullish Momentum: Structure is forming higher highs and higher lows, indicating continuation of upward trend.
Upside Target: With the breakout holding, the next logical target lies near the resistance zone around 1.0910, which served as a previous swing high.
Conclusion:
AUD/NZD is showing bullish strength after breaking out of consolidation and holding above the retested key level. As long as 1.0800–1.0810 support holds, the pair remains poised for a bullish continuation toward the 1.0900–1.0920 resistance zone. A break below this level would invalidate the setup and bring price back into the previous range.

AUDCHF BEARISH SETUPThe AUD/CHF 4-hour chart is presenting a classic Head & Shoulders pattern within a well-defined bearish descending channel, signaling a likely continuation to the downside if neckline support fails.
Key Observations:
Bearish Channel in Play: The broader trend remains bearish, with price action respecting both channel boundaries.
Head & Shoulders Formation: A visible Head & Shoulders pattern has formed near the top of the channel, with the neckline around 0.5275.
Neckline Break Risk: Price is currently testing the neckline area (highlighted in red). A confirmed break below would likely trigger bearish momentum.
Downside Target: A break below the neckline could push AUD/CHF toward the support zone near 0.5220, in line with the lower boundary of the channel.
Trend Structure: Lower highs and lower lows continue to dominate, reinforcing the bearish bias.
Conclusion:
AUD/CHF remains technically weak, and the emerging Head & Shoulders breakdown may act as a strong continuation signal within the existing downtrend channel. A clear close below 0.5270 could open the door for a further drop toward 0.5220. Caution is warranted for bulls unless a significant reversal signal emerges.

AUDCAD BEARISH SETUPThe 4-hour chart for AUD/CAD shows a well-respected bearish descending channel, where price action remains capped below a strong dynamic resistance. Price recently rejected a key resistance zone near 0.8900, signaling a potential continuation to the downside.
Key Observations:
Bearish Channel Intact: Price continues to respect the upper and lower bounds of the descending channel.
Key Resistance Rejection: The pair tested the 0.8900 resistance area and faced immediate rejection (highlighted in red), forming a lower high.
Break of Trendline: A rising trendline from the recent low has been broken, reinforcing bearish pressure.
Support Zone in Sight: If bearish momentum continues, the next major support lies around 0.8780 – 0.8800, offering a possible target area.
Short-term Setup: Minor upward retracement may retest the broken trendline, but unless 0.8900 is breached, the bias remains strongly bearish.
Conclusion:
AUD/CAD remains under bearish control within the descending channel. The recent rejection from the upper boundary and break of the rising trendline suggest a high-probability move toward the 0.8800 support zone. Traders should look for confirmation of lower highs or bearish engulfing patterns to position short.

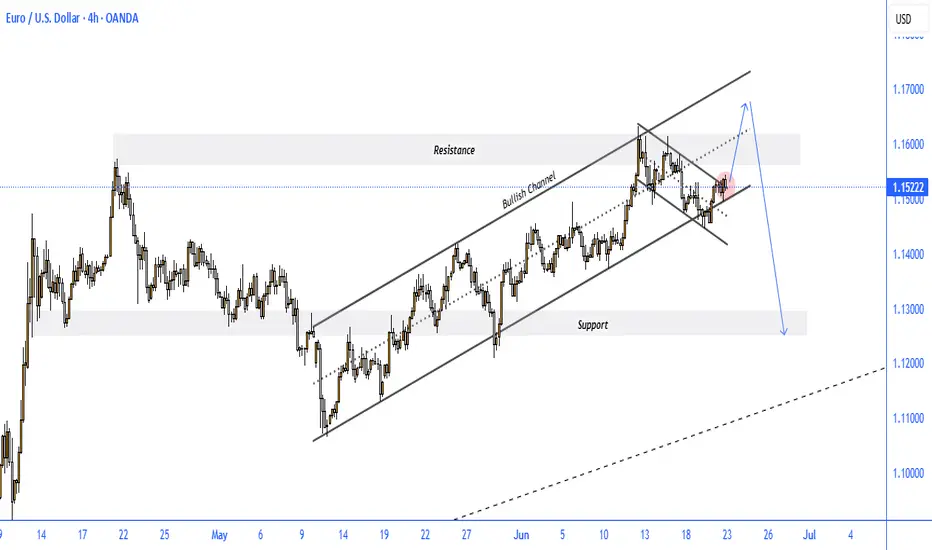
EURUSD BEARISH SETUP
The EUR/USD 4-hour chart reflects a significant technical setup, showing price action within a bullish ascending channel that has recently broken to the downside, forming a falling wedge pattern—typically a bullish continuation signal.
Key Observations:
Bullish Channel Broken: The price broke below the ascending channel earlier this month, signaling initial weakness.
Falling Wedge Formation: A bullish falling wedge has developed, and the pair is now testing its upper boundary near 1.1522, attempting a breakout.
Resistance Zone: The price is approaching a key resistance area between 1.1550 – 1.1600, which aligns with previous highs and the wedge's upper edge.
Scenario Projection:
A temporary bullish breakout toward the resistance zone is expected.
If the pair gets rejected from this resistance, a sharp decline toward the major support area near 1.1300 is likely.
Bearish Confirmation: A clear rejection at the resistance zone followed by a break below the recent minor support (red zone) would confirm the bearish move.
Conclusion:
While short-term bullish momentum may push EUR/USD slightly higher, the confluence of resistance levels suggests a high probability of rejection. Traders should watch for reversal signals in the 1.1550–1.1600 zone, as failure to break higher could lead to a bearish move toward 1.1300 in the coming days.
ETH BULLISH SETUPEthereum has recently broken out bullishly on higher timeframes, signaling a potential move toward the key resistance zone around $3,460. This level holds significant technical importance. The breakout above the hourly flag pattern confirms bullish momentum. As long as price holds above $2,300, the setup remains valid. A drop below this level would invalidate the current bullish outlook.
